
Aviation Fuel Card Market Growth Opportunities and Forecast by 2030
Aviation Fuel Card Market Size and Forecast (2020-2030), Global and Regional Share, Trend, and Growth Opportunity Analysis Report Coverage: By Type (Merchant, Branded); Application (Commercial, Private); and Geography
Historic Data: 2020-2021 | Base Year: 2022 | Forecast Period: 2022-2030- Status : Published
- Report Code : TIPRE00031432
- Category : Banking, Financial Services, and Insurance
- No. of Pages : 142
- Available Report Formats :


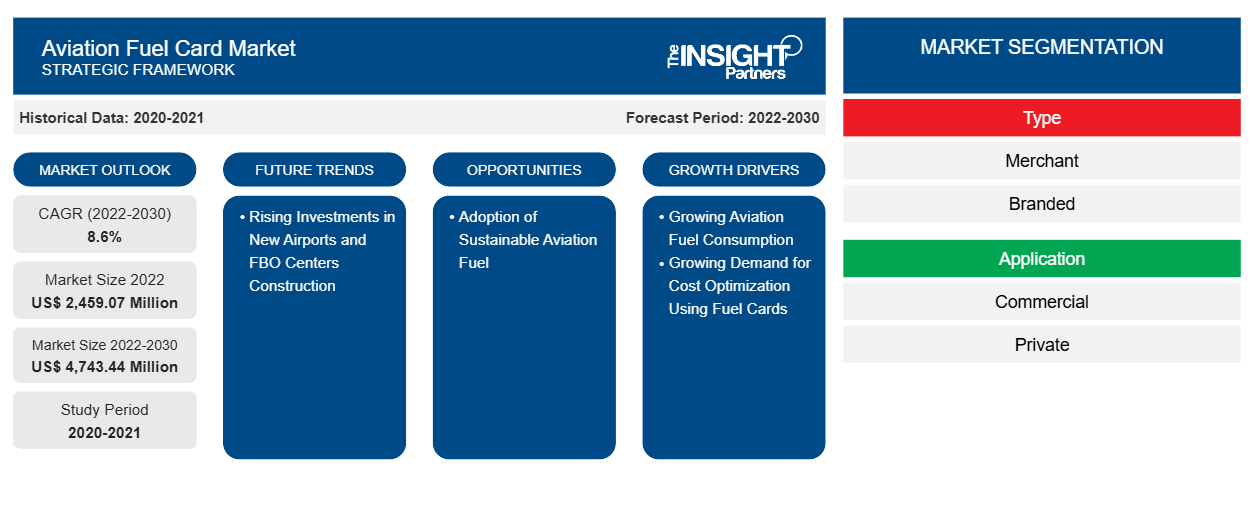
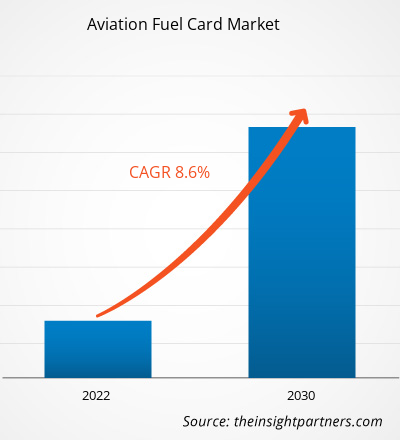
The Aviation Fuel Card Market size is projected to reach US$ 4,743.44 million by 2030 from US$ 2,459.07 million in 2022. The market is expected to register a CAGR of 8.6% in 2022–2030.
Traditionally, the aviation industry has made payments for fuel in a variety of ways, depending on the fuel industry’s and airline’s economic conditions and agreements in existence. Airlines and other aviation industries frequently purchase fuel on the spot market, either directly from oil companies or through fuel brokers. In such situations, the aviation corporation will most likely pay for the fuel with a mix of cash and credit. . Overall, the payment method used by the aviation industry to acquire fuel will be determined by a variety of criteria, such as the company's size, location, purchasing strategy, market conditions, and available possibilities. High-limit corporate cards with integrated cost management software can make it much easier to monitor fuel payments. High-limit cards allow businesses a lot more payment flexibility, which means they can keep operating without facing bank delays and fees for lending. In addition, unlike gasoline cards, which are rarely linked to cost management software, high-limit corporate credit cards from spend management companies offer a fully integrated experience. Corporate credit cards have made it simple to centralize fuel bills and streamline the overall expense management process. Rather than relying on different payment methods or refunds, a single credit card can be used for all fuel-related purchases, making it easier to track and manage spending. Consolidating fuel expenditures with a business credit card can aid in the development of stronger connections with fuel providers. Aviation companies that frequently utilize a single card for fuel transactions can have more negotiating power with fuel providers in terms of volume discounts or favourable terms. Thus, the benefits offered by other alternative methods hamper the aviation fuel card market growth.
Aviation Fuel Card Market Analysis
Many fuel producers and airline operators are taking initiatives to develop and adopt sustainable aviation fuel. In 2023, at the Dubai Airshow, officials from Boeing and Zero Petroleum signed an agreement to accelerate the development of synthetic sustainable aviation fuel (SAF). In 2023, Neste assisted the Trollhättan-Vänersborg airport and the airline Västflyg to become the world's first airline to use sustainable aviation fuel on all flights. In 2023, Emirates agreed to supply approximately 300,000 gallons of blended sustainable aviation fuel (SAF) to the airline's international hub in Dubai (DXB) through a partnership with Shell Aviation. Such initiatives are projected to increase the adoption of sustainable aviation fuel. Aviation fuel card suppliers can expand their business by offering attractive offers and discounts on the purchase of sustainable aviation fuel. This will ultimately lead to higher adoption and usage of aviation fuel cards. Further, by partnership with fixed-based operators, fuel card service providers can expand the network to supply sustainable aviation fuel. Thus, the rise in sustainable aviation fuel transactions is anticipated to have ample opportunities for the aviation fuel card market growth during the forecast period.
Aviation Fuel Card Market Overview
The role of fuel card suppliers in the ecosystem of the aviation fuel card market is crucial in ensuring the seamless functioning and reliability of fuel cards. Aviation fuel card suppliers play a significant role in providing fuel card services to end users such as commercial and private airlines. Fuel card suppliers ensure a secure and efficient role in payment processes for aviation fuel. Major fuel suppliers that provide fuel card services are termed branded fuel suppliers, which include BP plc, Shell Global, ExxonMobil, Titan Aviation Fuels, Jio-BP, AEGFUELS, and TotalEnergies Aviation. These entities are responsible for supplying aviation fuel and aviation fuel cards by themselves and hence ensuring a reliable aviation fuel card supply chain. Third parties and private companies that provide fuel card services are termed merchant fuel suppliers, which include World Fuel Services, CSI global-fleet, Aviation Pros, and Avfuel Corporation. Merchant fuel card suppliers are entities that are engaged in partnership or collaboration with major aviation fuel suppliers and ensure a seamless and secure payment process. This partnership or collaboration involves integrating systems to facilitate efficient transactions and maintain a reliable fuel supply.
Market Research Highlights
- North America dominated the market with 55.4% share in 2022.
- Asia Pacific is poised to grow at a CAGR of 10% over the forecast period.
- US market is projected to grow at a CAGR of 8.2% over the forecast period.
- By Product Type, the Merchant segment accounted for the largest market share of 72.6% in 2022.
- By Application, the Commercial segment is anticipated to witness the fastest growth, registering a CAGR of 8.8% over the forecast period
- The report profiles key industry players such as TotalEnergies SE, Shell Plc, BP Plc, Viva Energy Group Ltd, Associated Energy Group LLC, TITAN Aviation Fuels Inc, CSI Enterprises Inc, EPIC Aviation LLC, Kropp Holdings Inc, Avfuel Corp, while also analyzing key developments in novel ideas, disruptive products, and innovative services that could reshape the future market and reveal emerging themes across the industry.
Customize This Report To Suit Your Requirement
Get FREE CUSTOMIZATIONAviation Fuel Card Market: Strategic Insights
-
Get Top Key Market Trends of this report.This FREE sample will include data analysis, ranging from market trends to estimates and forecasts.
Aviation Fuel Card Market Drivers and Opportunities
Increasing Aviation Fuel Consumption
Due to the high demand for air travel, overall fuel consumption has increased. In 2022, US airlines carried 194 million more passengers than in 2021, an increase of 30% year on year. From January to December of 2022, US airlines handled 853 million passengers, up from 658 million in 2021 and 388 million in 2020. In 2021, the European Union (EU) experienced a significant rebound in air travel as the total number of passengers reached 373 million. This figure reflects a remarkable increase of 34.9% compared to the previous year, 2020. The surge in air passenger numbers was observed in Croatia, which experienced a remarkable increase of 84% in comparison to the 2021. Furthermore, Cyprus and Greece recorded substantial growth rates of 104.8% and 85.9%, respectively. This surge in the number of passengers, particularly in countries such as Croatia, Cyprus, and Greece, highlights the growing demand for air travel and the subsequent need for fuel.
Rising Investments in New Airport and Fixed Base Operator Center Construction
Various developed and developing countries across the globe are focusing on increasing their total number of airports. In 2023, the government of Vietnam intends to build more than 30 airports by 2030 in order to enhance tourism and trade. The country has established 22 airports; however, the government is focused on constructing new airports in order to accommodate the growing number of aircraft. The Vietnamese government approved the building of the Long Thanh International Airport in 2021, with completion scheduled for 2025. The Long Thanh International Airport will be Vietnam's largest airport, with a capacity of up to 100 million people per year. The government aims to expand to more than 30 airports by 2030, which demonstrates the country's commitment to developing its aviation industry. In 2023, Saudi Arabia announced the expansion of its domestic aviation industry, which will require an investment of US$ 100 billion. In 2023, India announced investments of US$ 12 billion in airports over the next two years, including orders for hundreds of new planes to fulfill surging travel demand, which is putting a burden on current infrastructure.
Aviation Fuel Card Market Report Segmentation Analysis
Key segments that contributed to the derivation of the Aviation Fuel Card Market analysis are type, application, and geography.
- Based on type, the Aviation Fuel Card Market has been segmented into merchant and branded. The merchant segment held a larger market share in 2022.
- By application, the Aviation Fuel Card Market has been segmented into commercial and private. The commercial segment held the largest share of the market in 2022.
Aviation Fuel Card Market Share Analysis by Geography
The geographic scope of the Aviation Fuel Card Market report is mainly divided into five regions: North America, Europe, Asia Pacific, Middle East & Africa, and South America.
North America has dominated the Aviation Fuel Card Market in 2022, and it is expected to retain its dominance during the forecast period as well. The North America aviation fuel card industry is mainly driven by the growing awareness of the fuel card concept. Moreover, the growing aviation industry in countries such as the US and Canada is further driving the aviation fuel card market. The aviation industry is one of the notable industries in the US. As per the data published by the Airlines for America in 2023, commercial aviation accounted for 5% of US GDP and US$ 1.25 trillion in 2022. In addition, a large network of airports and fixed base operators in the US has supported the increased use of aviation fuel cards. In 2022, the US operated more than 5,100 public airports and 14,850 private airports. The air transportation industry contributes significantly to the Canadian economy. As per the International Air Transport Association (IATA), the industry contributed US$ 37 billion to Canadian GDP in 2018. Rising aviation fuel consumption and increasing aviation prices are driving the aviation fuel card market in Mexico. In June 2022, state-owned Pemex's wholesale jet fuel prices increased dramatically. The US held the largest share in the North America aviation fuel card market in 2022.
Aviation Fuel Card Market Report Scope
| Report Attribute | Details |
|---|---|
| Market size in 2022 | US$ 2,459.07 Million |
| Market Size by 2030 | US$ 4,743.44 Million |
| Global CAGR (2022-2030) | 8.6% |
| Historical Data | 2020-2021 |
| Forecast period | 2022-2030 |
| Segments Covered |
By Type
|
| Regions and Countries Covered |
North America
|
| Market leaders and key company profiles |
|
Aviation Fuel Card Market Players Density: Understanding Its Impact on Business Dynamics
The Aviation Fuel Card Market is growing rapidly, driven by increasing end-user demand due to factors such as evolving consumer preferences, technological advancements, and greater awareness of the product's benefits. As demand rises, businesses are expanding their offerings, innovating to meet consumer needs, and capitalizing on emerging trends, which further fuels market growth.
Aviation Fuel Card Market News and Recent Developments
The Aviation Fuel Card Market is evaluated by gathering qualitative and quantitative data post primary and secondary research, which includes important corporate publications, association data, and databases. The following is a list of developments in the market for aviation fuel card market and strategies:
- In September 2023, Air bp, the international aviation fuel products and services supplier, launched the offering of Jet-A1 fuel at Berlin Brandenburg Airport’s (BER) General Aviation (GA) terminal in a newly agreed agency collaboration with ExecuJet. (Source: Air BP, Press Release/Company Website/Newsletter)
- In October 2022, TreviPay, the global B2B payments and invoicing network, launched TreviPay Aviation Network, powered by KHI, to offer a co-branded, closed-loop card solution tailored to the needs of FBOs (fixed-base operators) and flight support service organizations who service the general and defense aviation industries, and their customers. (Source: TreviPay, Press Release/Company Website/Newsletter)
Aviation Fuel Card Market Report Coverage and Deliverables
The “Aviation Fuel Card Market Size and Forecast (2020–2030)” report provides a detailed analysis of the market covering below areas:
- Market size and forecast at global, regional, and country levels for all the key market segments covered under the scope
- Market dynamics such as drivers, restraints, and key opportunities
- Key future trends
- Detailed Porter’s Five Forces analysis
- Global and regional market analysis covering key market trends, major players, regulations, and recent market developments
- Industry landscape and competition analysis covering market concentration, heat map analysis, prominent players, and recent developments
- Detailed company profiles with SWOT analysis

- Historical Analysis (2 Years), Base Year, Forecast (7 Years) with CAGR
- PEST and SWOT Analysis
- Market Size Value / Volume - Global, Regional, Country
- Industry and Competitive Landscape
- Excel Dataset
Recent Reports
Testimonials
The Insight Partners' SCADA System Market report is comprehensive, with valuable insights on current trends and future forecasts. The team was highly professional, responsive, and supportive throughout. We are very satisfied and highly recommend their services.
RAN KEDEM Partner, Reali Technologies LTDsI requested a report on a very specific software market and the team produced the report in a few days. The information was very relevant and well presented. I then requested some changes and additions to the report. The team was again very responsive and I got the final report in less than a week.
JEAN-HERVE JENN Chairman, Future AnalyticaWe worked with The Insight Partners for an important market study and forecast. They gave us clear insights into opportunities and risks, which helped shape our plans. Their research was easy to use and based on solid data. It helped us make smart, confident decisions. We highly recommend them.
PIYUSH NAGPAL Sr. Vice President, High Beam GlobalThe Insight Partners delivered insightful, well-structured market research with strong domain expertise. Their team was professional and responsive throughout. The user-friendly website made accessing industry reports seamless. We highly recommend them for reliable, high-quality research services
YUKIHIKO ADACHI CEO, Deep Blue, LLC.This is the first time I have purchased a market report from The Insight Partners.While I was unsure at first, I visited their web site and felt more comfortable to take the risk and purchase a market report.I am completely satisfied with the quality of the report and customer service. I had several questions and comments with the initial report, but after a couple of dialogs over email with their analyst I believe I have a report that I can use as input to our strategic planning process.Thank you so much for taking the extra time and making this a positive experience.I will definitely recommend your service to others and you will be my first call when we need further market data.
JOHN SUZUKI President and Chief Executive Officer, Board Director, BK TechnologiesI wish to appreciate your support and the professionalism you displayed in the course of attending to my request for information regarding to infectious disease IVD market in Nigeria. I appreciate your patience, your guidance, and the fact that you were willing to offer a discount, which eventually made it possible for us to close a deal. I look forward to engaging The Insight Partners in the future, all thanks to the impression you have created in me as a result of this first encounter.
DR CHIJIOKE ONYIA MANAGING DIRECTOR, PineCrest Healthcare Ltd.Reason to Buy
- Informed Decision-Making
- Understanding Market Dynamics
- Competitive Analysis
- Identifying Emerging Markets
- Customer Insights
- Market Forecasts
- Risk Mitigation
- Boosting Operational Efficiency
- Strategic Planning
- Investment Justification
- Tracking Industry Innovations
- Aligning with Regulatory Trends
Unlock Exclusive Report Discounts
Enquire Now


 Get Free Sample For