Tarjeta de combustible de aviación Estrategias de mercado, principales actores, oportunidades de crecimiento, análisis y pronóstico para 2030
Datos históricos : 2020-2021 | Año base : 2022 | Período de pronóstico : 2022-2030Tamaño y pronóstico del mercado de tarjetas de combustible de aviación (2020-2030), participación global y regional, tendencias y análisis de oportunidades de crecimiento. Cobertura del informe: por tipo (comerciante, de marca); aplicación (comercial, privada); y geografía.
- Estado : Publicada
- Código de informe : TIPRE00031432
- Categoría : Banca, servicios financieros y seguros
- Número de páginas : 142
- Formatos de informe disponibles :


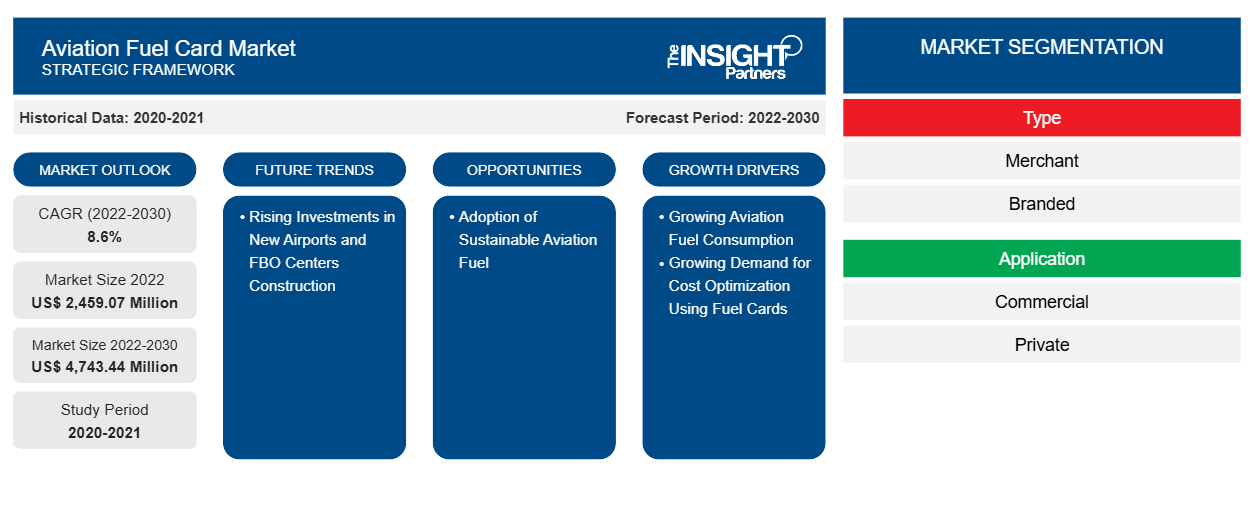
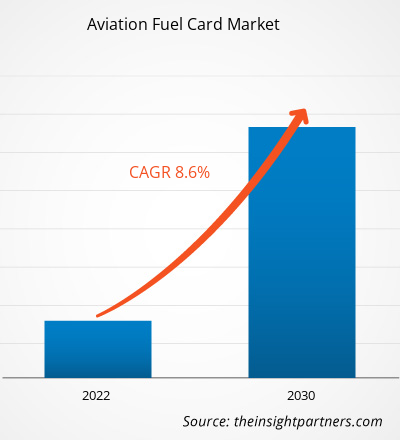
Se proyecta que el tamaño del mercado de tarjetas de combustible de aviación alcance los 4.743,44 millones de dólares estadounidenses para 2030, desde los 2.459,07 millones de dólares estadounidenses en 2022. Se espera que el mercado registre una CAGR del 8,6 % entre 2022 y 2030.
Tradicionalmente, la industria de la aviación ha realizado pagos por combustible de diversas formas, dependiendo de las condiciones económicas y los acuerdos existentes de la industria del combustible y de las aerolíneas. Las aerolíneas y otras industrias de la aviación con frecuencia compran combustible en el mercado spot, ya sea directamente de las compañías petroleras o a través de corredores de combustible. En tales situaciones, la corporación de aviación probablemente pagará el combustible con una combinación de efectivo y crédito. En general, el método de pago utilizado por la industria de la aviación para adquirir combustible estará determinado por una variedad de criterios, como el tamaño de la empresa, la ubicación, la estrategia de compra, las condiciones del mercado y las posibilidades disponibles. Las tarjetas corporativas de alto límite con software de gestión de costos integrado pueden hacer que sea mucho más fácil monitorear los pagos de combustible. Las tarjetas de alto límite permiten a las empresas mucha más flexibilidad de pago, lo que significa que pueden seguir operando sin enfrentar demoras bancarias y tarifas por préstamos. Además, a diferencia de las tarjetas de gasolina, que rara vez están vinculadas a un software de gestión de costos , las tarjetas de crédito corporativas de alto límite de las empresas de gestión de gastos ofrecen una experiencia completamente integrada. Las tarjetas de crédito corporativas han simplificado la centralización de las facturas de combustible y agilizan el proceso general de gestión de gastos. En lugar de depender de diferentes métodos de pago o reembolsos, se puede utilizar una única tarjeta de crédito para todas las compras relacionadas con el combustible, lo que facilita el seguimiento y la gestión de los gastos. La consolidación de los gastos de combustible con una tarjeta de crédito empresarial puede ayudar a desarrollar vínculos más sólidos con los proveedores de combustible. Las compañías de aviación que utilizan con frecuencia una única tarjeta para las transacciones de combustible pueden tener más poder de negociación con los proveedores de combustible en términos de descuentos por volumen o condiciones favorables. Por lo tanto, los beneficios que ofrecen otros métodos alternativos obstaculizan el crecimiento del mercado de tarjetas de combustible para aviación .
Análisis del mercado de tarjetas de combustible para aviación
Muchos productores de combustible y operadores de aerolíneas están tomando iniciativas para desarrollar y adoptar combustible de aviación sostenible. En 2023, en el Salón Aeronáutico de Dubái, los funcionarios de Boeing y Zero Petroleum firmaron un acuerdo para acelerar el desarrollo de combustible de aviación sostenible sintético (SAF). En 2023, Neste ayudó al aeropuerto de Trollhättan-Vänersborg y a la aerolínea Västflyg a convertirse en la primera aerolínea del mundo en utilizar combustible de aviación sostenible en todos los vuelos. En 2023, Emirates acordó suministrar aproximadamente 300.000 galones de combustible de aviación sostenible (SAF) mezclado al centro internacional de la aerolínea en Dubái (DXB) a través de una asociación con Shell Aviation. Se prevé que estas iniciativas aumenten la adopción de combustible de aviación sostenible. Los proveedores de tarjetas de combustible de aviación pueden ampliar su negocio ofreciendo ofertas atractivas y descuentos en la compra de combustible de aviación sostenible. Esto, en última instancia, conducirá a una mayor adopción y uso de las tarjetas de combustible de aviación. Además, mediante la asociación con operadores con base fija, los proveedores de servicios de tarjetas de combustible pueden ampliar la red para suministrar combustible de aviación sostenible. Por lo tanto, se anticipa que el aumento en las transacciones de combustible de aviación sustentable generará amplias oportunidades para el crecimiento del mercado de tarjetas de combustible de aviación durante el período de pronóstico.
Descripción general del mercado de tarjetas de combustible para aviación
El papel de los proveedores de tarjetas de combustible en el ecosistema del mercado de tarjetas de combustible para aviación es crucial para garantizar el funcionamiento sin problemas y la fiabilidad de las tarjetas de combustible. Los proveedores de tarjetas de combustible para aviación desempeñan un papel importante en la prestación de servicios de tarjetas de combustible a usuarios finales, como aerolíneas comerciales y privadas. Los proveedores de tarjetas de combustible garantizan un papel seguro y eficiente en los procesos de pago del combustible de aviación. Los principales proveedores de combustible que proporcionan servicios de tarjetas de combustible se denominan proveedores de combustible de marca, que incluyen a BP plc, Shell Global, ExxonMobil, Titan Aviation Fuels, Jio-BP, AEGFUELS y TotalEnergies Aviation. Estas entidades son responsables de suministrar combustible de aviación y tarjetas de combustible de aviación por sí mismas y, por lo tanto, garantizar una cadena de suministro de tarjetas de combustible de aviación confiable. Los terceros y las empresas privadas que brindan servicios de tarjetas de combustible se denominan proveedores de combustible comercial, que incluyen World Fuel Services, CSI global-fleet, Aviation Pros y Avfuel Corporation. Los proveedores de tarjetas de combustible comercial son entidades que participan en asociación o colaboración con los principales proveedores de combustible de aviación y garantizan un proceso de pago seguro y sin problemas. Esta asociación o colaboración implica la integración de sistemas para facilitar transacciones eficientes y mantener un suministro de combustible confiable.
Personalice este informe según sus necesidades
Obtendrá personalización en cualquier informe, sin cargo, incluidas partes de este informe o análisis a nivel de país, paquete de datos de Excel, así como también grandes ofertas y descuentos para empresas emergentes y universidades.
Mercado de tarjetas de combustible para aviación: perspectivas estratégicas
-
Obtenga las principales tendencias clave del mercado de este informe.Esta muestra GRATUITA incluirá análisis de datos, desde tendencias del mercado hasta estimaciones y pronósticos.
Factores impulsores y oportunidades del mercado de tarjetas de combustible para aviación
Aumento del consumo de combustible en la aviación
Debido a la alta demanda de viajes aéreos, el consumo general de combustible ha aumentado. En 2022, las aerolíneas estadounidenses transportaron 194 millones de pasajeros más que en 2021, un aumento del 30% interanual. De enero a diciembre de 2022, las aerolíneas estadounidenses manejaron 853 millones de pasajeros, frente a los 658 millones de 2021 y los 388 millones de 2020. En 2021, la Unión Europea (UE) experimentó un repunte significativo en los viajes aéreos, ya que el número total de pasajeros alcanzó los 373 millones. Esta cifra refleja un notable aumento del 34,9% en comparación con el año anterior, 2020. El aumento en el número de pasajeros aéreos se observó en Croacia, que experimentó un notable aumento del 84% en comparación con 2021. Además, Chipre y Grecia registraron tasas de crecimiento sustanciales del 104,8% y el 85,9%, respectivamente. Este aumento del número de pasajeros, especialmente en países como Croacia, Chipre y Grecia, pone de relieve la creciente demanda de viajes aéreos y la consiguiente necesidad de combustible.
Aumentan las inversiones en la construcción de nuevos aeropuertos y centros de operaciones fijos
Varios países desarrollados y en desarrollo de todo el mundo se están centrando en aumentar su número total de aeropuertos. En 2023, el gobierno de Vietnam pretende construir más de 30 aeropuertos para 2030 con el fin de mejorar el turismo y el comercio. El país ha establecido 22 aeropuertos; sin embargo, el gobierno se centra en la construcción de nuevos aeropuertos para dar cabida al creciente número de aeronaves. El gobierno vietnamita aprobó la construcción del Aeropuerto Internacional de Long Thanh en 2021, cuya finalización está prevista para 2025. El Aeropuerto Internacional de Long Thanh será el aeropuerto más grande de Vietnam, con una capacidad de hasta 100 millones de personas al año. El gobierno pretende ampliar a más de 30 aeropuertos para 2030, lo que demuestra el compromiso del país con el desarrollo de su industria de la aviación. En 2023, Arabia Saudita anunció la expansión de su industria de la aviación nacional, que requerirá una inversión de 100 mil millones de dólares. En 2023, India anunció inversiones por 12.000 millones de dólares en aeropuertos durante los próximos dos años, incluidos pedidos de cientos de aviones nuevos para satisfacer la creciente demanda de viajes, que está suponiendo una carga para la infraestructura actual.
Análisis de segmentación del informe del mercado de tarjetas de combustible de aviación
Los segmentos clave que contribuyeron a la derivación del análisis del mercado de tarjetas de combustible de aviación son el tipo, la aplicación y la geografía.
- Según el tipo, el mercado de tarjetas de combustible para aviación se ha segmentado en tarjetas comerciales y de marca. El segmento comercial tuvo una mayor participación de mercado en 2022.
- Por aplicación, el mercado de tarjetas de combustible para aviación se ha segmentado en comercial y privado. El segmento comercial tuvo la mayor participación del mercado en 2022.
Análisis de la cuota de mercado de las tarjetas de combustible de aviación por geografía
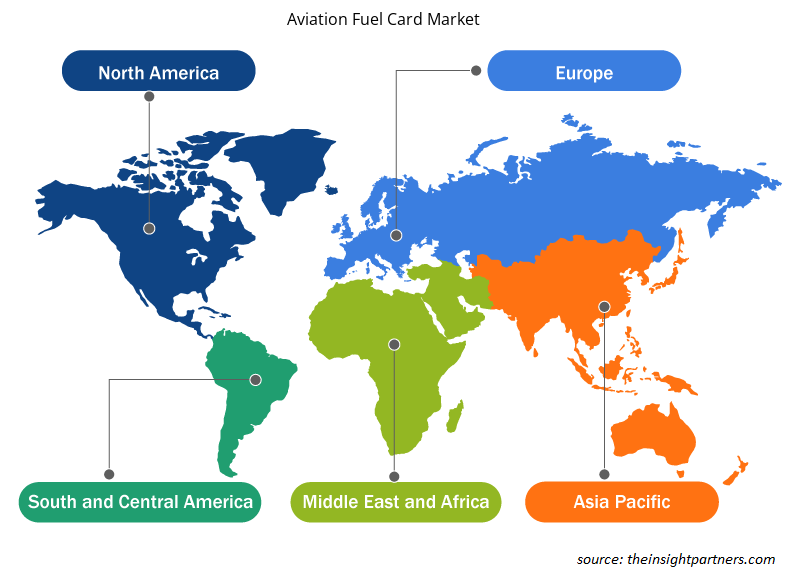
El alcance geográfico del informe del mercado de tarjetas de combustible de aviación se divide principalmente en cinco regiones: América del Norte, Europa, Asia Pacífico, Medio Oriente y África, y América del Sur.
América del Norte ha dominado el mercado de tarjetas de combustible de aviación en 2022 y se espera que mantenga su dominio también durante el período de pronóstico. La industria de tarjetas de combustible de aviación de América del Norte está impulsada principalmente por la creciente conciencia del concepto de tarjeta de combustible. Además, la creciente industria de la aviación en países como EE. UU. y Canadá está impulsando aún más el mercado de tarjetas de combustible de aviación. La industria de la aviación es una de las industrias notables en los EE. UU. Según los datos publicados por Airlines for America en 2023, la aviación comercial representó el 5% del PIB de EE. UU. y US $ 1,25 billones en 2022. Además, una gran red de aeropuertos y operadores de base fija en los EE. UU. Ha respaldado el aumento del uso de tarjetas de combustible de aviación. En 2022, EE. UU. operaba más de 5.100 aeropuertos públicos y 14.850 aeropuertos privados. La industria del transporte aéreo contribuye significativamente a la economía canadiense. Según la Asociación Internacional de Transporte Aéreo (IATA), la industria contribuyó con 37 mil millones de dólares al PIB canadiense en 2018. El aumento del consumo de combustible de aviación y de los precios de la aviación están impulsando el mercado de tarjetas de combustible de aviación en México. En junio de 2022, los precios mayoristas del combustible para aviones de la estatal Pemex aumentaron drásticamente. Estados Unidos tuvo la mayor participación en el mercado de tarjetas de combustible de aviación de América del Norte en 2022.
Perspectivas regionales del mercado de tarjetas de combustible para aviación
Los analistas de Insight Partners explicaron en detalle las tendencias y los factores regionales que influyen en el mercado de tarjetas de combustible para aviación durante el período de pronóstico. Esta sección también analiza los segmentos y la geografía del mercado de tarjetas de combustible para aviación en América del Norte, Europa, Asia Pacífico, Oriente Medio y África, y América del Sur y Central.
- Obtenga los datos regionales específicos para el mercado de tarjetas de combustible de aviación
Alcance del informe sobre el mercado de tarjetas de combustible para aviación
| Atributo del informe | Detalles |
|---|---|
| Tamaño del mercado en 2022 | US$ 2.459,07 millones |
| Tamaño del mercado en 2030 | US$ 4.743,44 millones |
| CAGR global (2022-2030) | 8,6% |
| Datos históricos | 2020-2021 |
| Período de pronóstico | 2022-2030 |
| Segmentos cubiertos |
Por tipo
|
| Regiones y países cubiertos |
América del norte
|
| Líderes del mercado y perfiles de empresas clave |
|
Densidad de actores del mercado de tarjetas de combustible de aviación: comprensión de su impacto en la dinámica empresarial
El mercado de tarjetas de combustible para aviación está creciendo rápidamente, impulsado por la creciente demanda de los usuarios finales debido a factores como la evolución de las preferencias de los consumidores, los avances tecnológicos y una mayor conciencia de los beneficios del producto. A medida que aumenta la demanda, las empresas amplían sus ofertas, innovan para satisfacer las necesidades de los consumidores y aprovechan las tendencias emergentes, lo que impulsa aún más el crecimiento del mercado.
La densidad de actores del mercado se refiere a la distribución de las empresas o firmas que operan dentro de un mercado o industria en particular. Indica cuántos competidores (actores del mercado) están presentes en un espacio de mercado determinado en relación con su tamaño o valor total de mercado.
Las principales empresas que operan en el mercado de tarjetas de combustible de aviación son:
- Shell Sociedad Anónima
- Compañía BP Plc
- Grupo de energía asociada LLC
- Grupo Viva Energy Ltd.
- Combustibles de aviación TITAN Inc.
Descargo de responsabilidad : Las empresas enumeradas anteriormente no están clasificadas en ningún orden particular.
- Obtenga una descripción general de los principales actores clave del mercado de tarjetas de combustible de aviación
Noticias y desarrollos recientes del mercado de tarjetas de combustible para aviación
El mercado de tarjetas de combustible para aviación se evalúa mediante la recopilación de datos cualitativos y cuantitativos posteriores a la investigación primaria y secundaria, que incluye publicaciones corporativas importantes, datos de asociaciones y bases de datos. A continuación, se incluye una lista de los avances en el mercado de tarjetas de combustible para aviación y las estrategias:
- En septiembre de 2023, Air BP, el proveedor internacional de productos y servicios de combustible para aviación, lanzó la oferta de combustible Jet-A1 en la terminal de Aviación General (GA) del Aeropuerto de Berlín Brandeburgo (BER) en una colaboración de agencia recientemente acordada con ExecuJet. (Fuente: Air BP, comunicado de prensa/sitio web de la empresa/boletín informativo)
- En octubre de 2022, TreviPay, la red global de pagos y facturación B2B, lanzó TreviPay Aviation Network, impulsada por KHI, para ofrecer una solución de tarjeta de circuito cerrado y marca compartida adaptada a las necesidades de los operadores de base fija (FBO) y las organizaciones de servicios de asistencia de vuelo que prestan servicios a las industrias de aviación general y de defensa, y a sus clientes. (Fuente: TreviPay, comunicado de prensa/sitio web de la empresa/boletín informativo)
Informe sobre el mercado de tarjetas de combustible para aviación: cobertura y resultados
El informe “Tamaño y pronóstico del mercado de tarjetas de combustible de aviación (2020-2030)” proporciona un análisis detallado del mercado que cubre las siguientes áreas:
- Tamaño del mercado y pronóstico a nivel global, regional y nacional para todos los segmentos clave del mercado cubiertos bajo el alcance
- Dinámica del mercado, como impulsores, restricciones y oportunidades clave
- Principales tendencias futuras
- Análisis detallado de las cinco fuerzas de Porter
- Análisis del mercado global y regional que cubre las tendencias clave del mercado, los principales actores, las regulaciones y los desarrollos recientes del mercado.
- Análisis del panorama de la industria y de la competencia que abarca la concentración del mercado, el análisis de mapas de calor, los actores destacados y los desarrollos recientes
- Perfiles de empresas detallados con análisis FODA

Ankita es una profesional dinámica en investigación de mercados y consultoría con más de 8 años de experiencia en los sectores de tecnología, medios de comunicación, TIC, electrónica y semiconductores. Ha liderado y ejecutado con éxito más de 100 proyectos de consultoría e investigación para clientes globales como Microsoft, Oracle, NEC Corporation, SAP, KPMG y Expeditors International. Sus principales competencias incluyen la evaluación de mercado, el análisis de datos, la previsión, la formulación de estrategias, la inteligencia competitiva y la redacción de informes.
Ankita es experta en la gestión de ciclos completos de proyecto, desde el diseño de propuestas de preventa y las conversaciones con los clientes hasta la entrega de información práctica posventa. Es experta en la gestión de equipos multifuncionales, la estructuración de módulos de investigación complejos y la alineación de soluciones con los objetivos de negocio específicos del cliente. Sus excelentes habilidades de comunicación, liderazgo y presentación le han permitido obtener constantemente resultados orientados al valor en entornos de mercado dinámicos y en constante evolución.
- Análisis histórico (2 años), año base, pronóstico (7 años) con CAGR
- Análisis PEST y FODA
- Tamaño del mercado, valor/volumen: global, regional y nacional
- Industria y panorama competitivo
- Conjunto de datos de Excel
Informes recientes
Testimonios
El informe de mercado de sistemas SCADA de Insight Partners es completo y ofrece información valiosa sobre las tendencias actuales y las previsiones futuras. El equipo fue altamente profesional, receptivo y me brindó un gran apoyo en todo momento. Estamos muy satisfechos y recomendamos ampliamente sus servicios.
RAN KEDEM Socio, Reali Technologies LTDsSolicité un informe sobre un mercado de software muy específico y el equipo lo elaboró en pocos días. La información era muy relevante y estaba bien presentada. Posteriormente, solicité algunos cambios y adiciones al informe. El equipo fue muy receptivo y recibí el informe final en menos de una semana.
JEAN-HERVE JENN Presidente, Future AnalyticaTrabajamos con The Insight Partners para un importante estudio y pronóstico de mercado. Nos brindaron una visión clara de las oportunidades y los riesgos, lo que nos ayudó a definir nuestros planes. Su investigación fue fácil de usar y se basó en datos sólidos. Nos ayudó a tomar decisiones inteligentes y seguras. Los recomendamos ampliamente.
PIYUSH NAGPAL Vicepresidente Sénior, , High Beam GlobalThe Insight Partners realizó una investigación de mercado profunda y bien estructurada con una sólida experiencia en el sector. Su equipo fue profesional y receptivo en todo momento. El sitio web, fácil de usar, facilitó el acceso a los informes del sector. Los recomendamos ampliamente por sus servicios de investigación confiables y de alta calidad.
YUKIHIKO ADACHI Director Ejecutivo, , Deep Blue, LLCEsta es la primera vez que compro un informe de mercado de The Insight Partners. Aunque al principio tenía dudas, visité su sitio web y me sentí más cómodo al arriesgarme y comprarlo. Estoy completamente satisfecho con la calidad del informe y el servicio al cliente. Tenía varias preguntas y comentarios sobre el informe inicial, pero después de un par de conversaciones por correo electrónico con su analista, creo que tengo un informe que puedo usar como base para nuestro proceso de planificación estratégica. Muchas gracias por tomarse el tiempo y hacer de esta una experiencia positiva. Sin duda, recomendaré sus servicios y serán mi primera opción cuando necesitemos más datos de mercado.
JOHN SUZUKI Presidente y Director Ejecutivo, Director de la Junta Directiva, BK TechnologiesAgradezco su apoyo y la profesionalidad que demostraron al atender mi solicitud de información sobre el mercado de diagnóstico in vitro (IVD) para enfermedades infecciosas en Nigeria. Agradezco su paciencia, su orientación y su disposición a ofrecerme un descuento, lo que finalmente nos permitió cerrar un trato. Espero poder colaborar con The Insight Partners en el futuro, gracias a la impresión que me causó este primer encuentro.
DRA. CHIJIOKE ONYIA, DIRECTORA GENERAL, PineCrest Healthcare Ltd.Razón para comprar
- Toma de decisiones informada
- Comprensión de la dinámica del mercado
- Análisis competitivo
- Información sobre clientes
- Pronósticos del mercado
- Mitigación de riesgos
- Planificación estratégica
- Justificación de la inversión
- Identificación de mercados emergentes
- Mejora de las estrategias de marketing
- Impulso de la eficiencia operativa
- Alineación con las tendencias regulatorias


 Obtenga una muestra gratuita para - Mercado de tarjetas de combustible para aviación