
Building Analytics Market Key Players and Opportunities by 2027
Building Analytics Market to 2027 - Industry Analysis and Forecasts by Deployment Type (Cloud-Based and On-Premise), Component (Software and Service); Building Type (Manufacturing Facilities, Residential Building, Commercial Building, Public Places, and Government Buildings); and Application (Fault Detection & Monitoring Facilities, Security Management, Energy Management, Emergency Management, Parking Management, Operations Management, and Network Management)
- Status : Published
- Report Code : TIPTE00002052
- Category : Technology, Media and Telecommunications
- No. of Pages : 177
- Available Report Formats :


- Last update date : June 13, 2024

2018 Market Size
US$ 6.18 Bn
Base year value
2027 Forecast
US$ 19.66 Bn
Projected by 2027
CAGR 2019-2027
14.1 %
Growth rate
Addressable Market
US$ 113.91 Bn
(2019-2027)
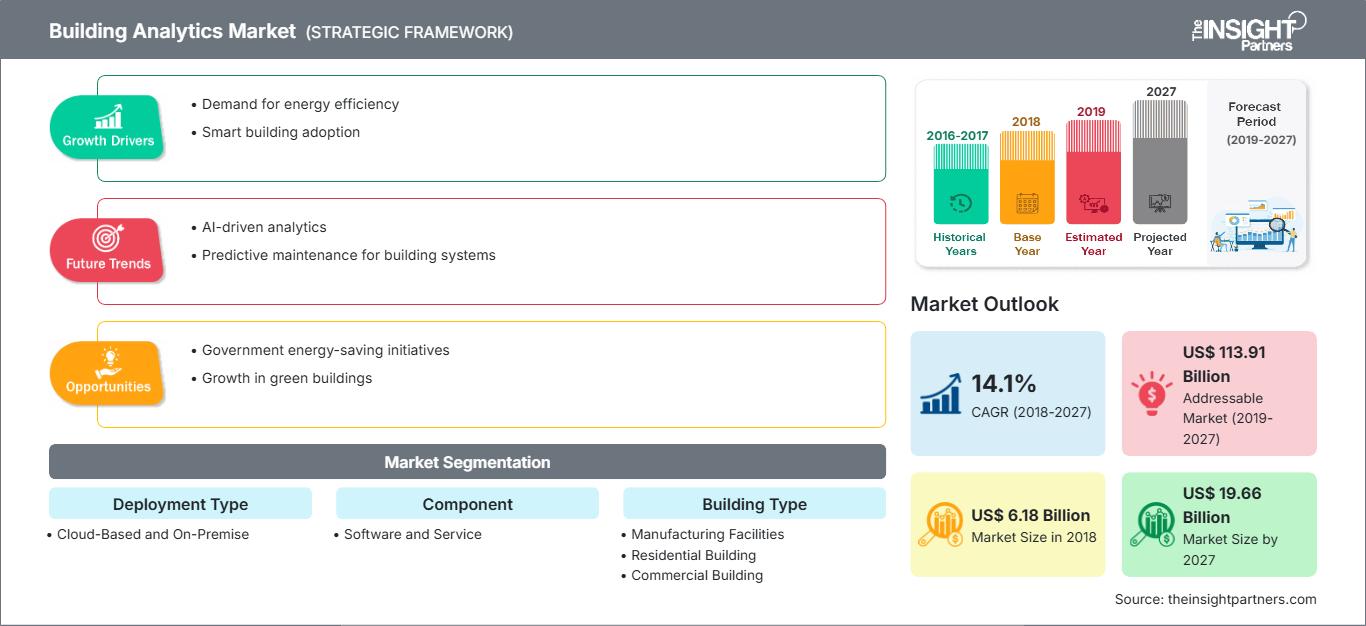
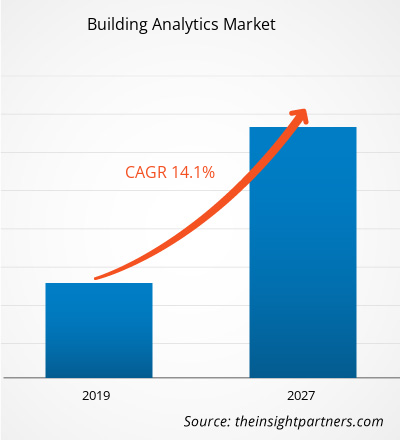
The global building analytics market was valued at US$ 6,181.4 million in 2018 and it is expected to grow at a CAGR of 14.1% between 2019 and 2027.
Building analytics market is experiencing growth all across the globe, growing energy prices, increasingly stringent building energy guidelines, and achieving maximum operational efficiency for building and facility management is expected to be the major market driving forces in the coming years.
The report focuses on an in-depth segmentation of building analytics market based on deployment type, component, building type, and application. The geographic segmentation of the report covers five major regions including; North Americas, Europe, Asia-Pacific (APAC), Middle East and Africa (MEA) and South America (SA). The regional market has been further segmented by respective countries. By application, energy management accounted for the largest share in the building analytics market in 2018.
Market Research Highlights
- Global market for Building Analytics was valued at US$ 6.18 Billion in 2018
- Annual market size is expected to reach US$ 19.66 Billion by 2027
- Total addressable market (TAM) during 2019-2027 is projected to reach approximately US$ 113.91 Billion
- Market is anticipated to register a CAGR of 14.1% during the forecast period
- The United States represents a key market, supported by Demand for energy efficiency, Smart building adoption, as well as evolving industry dynamics
- Market analysis covers North America, Europe, Asia-Pacific, South and Central America, Middle East and Africa, with growth evaluated across the forecast period
- Market opportunities such as Government energy-saving initiatives, Growth in green buildings are expected to influence market dynamics and addressable market
- Report profiles industry participants, including Schneider Electric, International Business Machines (IBM) Corporation, SkyFoundry, Environmental Systems, Inc., ENGIE Insight Services Inc, Senseware, Inc., Gooee, Acorn Engineering Group Limited, Waibel Energy Systems, BuildingIQ, Inc1, Siemens AG1, General Electric (GE)1, Iconics, Inc.1, Coppertree Analytics1, Delta Electronics, while analyzing competitive strategies and innovation developments
-
Source: The Insight Partners' analysis based on proprietary research, government publications, company annual reports, investor presentations, industry databases, and expert interviews.
● REPORT CUSTOMIZATION
Tailor This Report To Align With Your Specific Business Requirements
This report can be customized to align precisely with your business objectives, scope, and target markets. Customization options include tailored segmentation, geography, competitive analysis, and strategic insights to support informed decision-making.
Customize This Report →WHAT YOU CAN ADJUST
- ● Segmentations
- ● Geography
- ● Competitive Analysis
- ● Language Preferences
Building Analytics Market: Strategic Insights
-
Get Top Key Market Trends of this report.This FREE sample will include data analysis, ranging from market trends to estimates and forecasts.
The report aims to provide an overview of the global building analytics market with detailed market segmentation. Also, it analyzes the current building analytics market scenario and forecasts the market till 2027. The report covers market dynamics affecting the building analytics market during the forecast period. Furthermore, the report analyzes the competitive scenario, geographic trends, and opportunities in the building analytics market with respect to all geographic regions. The report also includes the detailed company profiles of the key players in the building analytics market along with their market strategies. The report also provides PEST along with the SWOT analysis for all company profiled in the report.
Currently, the building analytics market penetration rates in Europe region is higher than any other markets across the globe. The European Union's Energy Efficiency Directive, launched in 2012 established a set of obligatory measures to aid the EU achieve its 20% energy efficiency target by 2020. The Directive requires all EU countries to use energy more efficiently throughout the energy chain i.e. from production to final consumption. Also, in 2016, an update to Energy Efficiency Directive was proposed, which included a new 30% energy efficiency target for 2030, as well as measures to meet the new target. In the EU, buildings accounts for around 40% of the total energy consumption and 36% of total CO2 emissions. Also, around 35% of the buildings in the EU are more than 50 years old and nearly 75% of the building stock is energy inefficient, although only 0.4-1.2% of the building stock is restored every year. Thus, more restoration of existing buildings has the prospective to lead to substantial energy savings. Such facts provides a prosperous opportunity to the building analytics market growth.
Building Analytics Market Report Scope
| Report Attribute | Details |
|---|---|
| Market size in 2018 | US$ 6.18 Billion |
| Market Size by 2027 | US$ 19.66 Billion |
| Global CAGR (2018 - 2027) | 14.1% |
| Historical Data | 2016-2017 |
| Forecast period | 2019-2027 |
| Segments Covered |
By Deployment Type
|
| Regions and Countries Covered |
North America
|
| Market leaders and key company profiles |
|
Building Analytics Market Players Density: Understanding Its Impact on Business Dynamics
The Building Analytics Market is growing rapidly, driven by increasing end-user demand due to factors such as evolving consumer preferences, technological advancements, and greater awareness of the product's benefits. As demand rises, businesses are expanding their offerings, innovating to meet consumer needs, and capitalizing on emerging trends, which further fuels market growth.
Some of the leading players operating in this market are (in alphabetic order) namely: Acorn Engineering Group Limited, Arup Group, AT Kearney, Buildingiq, Buildinglogix, Buildpulse, Coppertree Analytics, Crestron Electronics, Delta Electronics, Ecovox, Energy Advantage, Enernoc, Engie Insight, Environmental Systems Inc., General Electric, Gooee, Gridpoint, Honeywell, IBM Corporation, Iconics, Schneider Electric, Senseware, Siemens, SkyFoundry, Waibel Energy Systems, Xchanging PLC (CSC Computer Sciences International Operations Limited) among others.

- Comprehensive Market Sizing and Forecast Analysis
- Detailed Segmentation Analysis
- In-Depth Market Dynamics Assessment
- Regional and Country-Level Insights
- Competitive Landscape and Company Benchmarking
- Strategic Business Intelligence
Recent Reports
Testimonials
The Insight Partners' SCADA System Market report is comprehensive, with valuable insights on current trends and future forecasts. The team was highly professional, responsive, and supportive throughout. We are very satisfied and highly recommend their services.
RAN KEDEM Partner, Reali Technologies LTDsI requested a report on a very specific software market and the team produced the report in a few days. The information was very relevant and well presented. I then requested some changes and additions to the report. The team was again very responsive and I got the final report in less than a week.
JEAN-HERVE JENN Chairman, Future AnalyticaWe worked with The Insight Partners for an important market study and forecast. They gave us clear insights into opportunities and risks, which helped shape our plans. Their research was easy to use and based on solid data. It helped us make smart, confident decisions. We highly recommend them.
PIYUSH NAGPAL Sr. Vice President, High Beam GlobalThe Insight Partners delivered insightful, well-structured market research with strong domain expertise. Their team was professional and responsive throughout. The user-friendly website made accessing industry reports seamless. We highly recommend them for reliable, high-quality research services
YUKIHIKO ADACHI CEO, Deep Blue, LLC.This is the first time I have purchased a market report from The Insight Partners.While I was unsure at first, I visited their web site and felt more comfortable to take the risk and purchase a market report.I am completely satisfied with the quality of the report and customer service. I had several questions and comments with the initial report, but after a couple of dialogs over email with their analyst I believe I have a report that I can use as input to our strategic planning process.Thank you so much for taking the extra time and making this a positive experience.I will definitely recommend your service to others and you will be my first call when we need further market data.
JOHN SUZUKI President and Chief Executive Officer, Board Director, BK TechnologiesI wish to appreciate your support and the professionalism you displayed in the course of attending to my request for information regarding to infectious disease IVD market in Nigeria. I appreciate your patience, your guidance, and the fact that you were willing to offer a discount, which eventually made it possible for us to close a deal. I look forward to engaging The Insight Partners in the future, all thanks to the impression you have created in me as a result of this first encounter.
DR CHIJIOKE ONYIA MANAGING DIRECTOR, PineCrest Healthcare Ltd.Reason to Buy
- Informed Decision-Making
- Understanding Market Dynamics
- Competitive Analysis
- Identifying Emerging Markets
- Customer Insights
- Market Forecasts
- Risk Mitigation
- Boosting Operational Efficiency
- Strategic Planning
- Investment Justification
- Tracking Industry Innovations
- Aligning with Regulatory Trends


