Hydrographic Survey Market Growth Drivers and Forecast by 2031
Historic Data: 2021-2022 | Base Year: 2023 | Forecast Period: 2023-2031Hydrographic Survey Market Size and Forecast (2021 - 2031), Global and Regional Share, Trend, and Growth Opportunity Analysis Report Coverage: By Component (Software, Services), End User (Marine and Oil & Gas), and Geography
- Report Date : Sep 2025
- Report Code : TIPRE00019125
- Category : Technology, Media and Telecommunications
- Status : Data Released
- Available Report Formats :


- No. of Pages : 150
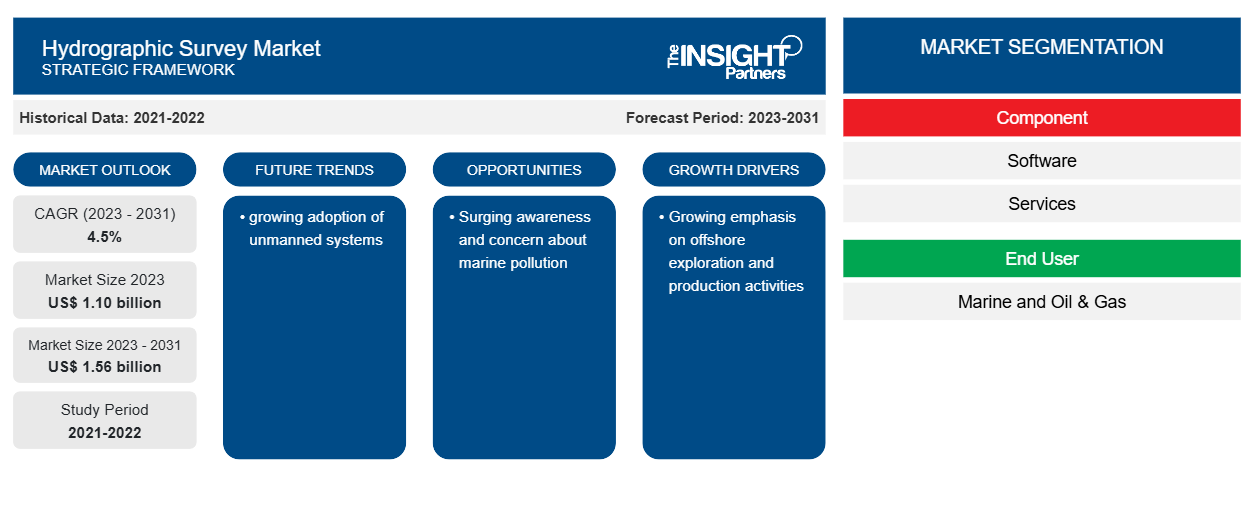
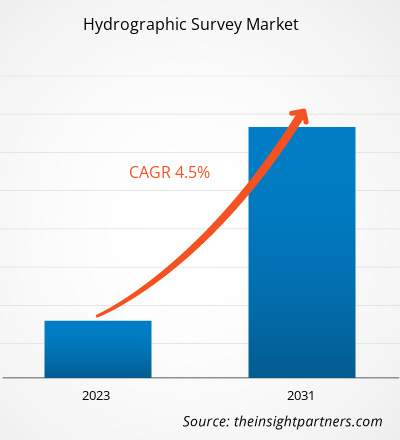
The hydrographic survey market size is expected to grow from US$ 1.10 billion in 2023 to US$ 1.56 billion by 2031; it is anticipated to expand at a CAGR of 4.5% from 2023 to 2031. The growing adoption of unmanned systems is likely to remain a key hydrographic survey market trends.
Hydrographic Survey Market Analysis
The rising need for accurate and up-to-date marine charts and maps. This is essential for safe navigation, offshore exploration, and production activities and is a key driver for the growth of the hydrographic survey market.
Hydrographic Survey Market Overview
A hydrographic survey, also known as a bathymetric survey, is a process that involves measuring various factors beneath the surface of water. This survey can be conducted in both still and running water. The main objectives of hydrographic survey equipment are to measure tides for seacoasts, aid in the construction of sea defense works and harbors, establish leveling dams, and determine bed depth. Additionally, hydrographic surveys can identify soundings for navigation, locate rocks and sand bars, and measure volumes of underwater excavation. These surveys are also used in irrigation and land drainage schemes to determine the direction and flow of water, as well as for water schemes and flood control.
Customize This Report To Suit Your Requirement
You will get customization on any report - free of charge - including parts of this report, or country-level analysis, Excel Data pack, as well as avail great offers and discounts for start-ups & universities
Hydrographic Survey Market: Strategic Insights
- Get Top Key Market Trends of this report.This FREE sample will include data analysis, ranging from market trends to estimates and forecasts.
Hydrographic Survey Market Drivers and Opportunities
Growing emphasis on offshore exploration and production activities to Favor Market
Hydrographic surveys play a crucial role in supporting offshore exploration and production activities. These surveys involve the measurement and description of features that affect maritime navigation, marine construction, dredging, offshore oil exploration and drilling, and related activities. Offshore exploration and production activities require detailed surveys of the seabed and underwater structures to ensure safe and efficient operations. Hydrographic surveys provide essential information about the physical characteristics of the underwater environment, including soundings, shorelines, tides, currents, seabed conditions, and submerged obstructions.
Surging awareness and concern about marine pollution
The increasing awareness and concern about marine pollution have led to a growing demand for hydrographic surveys. These surveys play a crucial role in monitoring and assessing the impact of pollution on marine ecosystems. Marine pollution has multiple negative impacts on marine ecosystems. For example, petroleum-based pollutants reduce photosynthesis in marine microorganisms that generate oxygen. Additionally, increasing absorption of carbon dioxide into the seas causes ocean acidification, which destroys coral reefs, impairs shellfish development, dissolves calcium-containing microorganisms at the base of the marine food web, and increases the toxicity of some pollutants. Hydrographic surveys are essential tools in monitoring and assessing the impact of pollution on marine ecosystems. These surveys provide valuable data on the physical characteristics of the marine environment, including water depth, seabed topography, and the presence of pollutants.
Hydrographic Survey Market Report Segmentation Analysis
Key segments that contributed to the derivation of the Hydrographic Survey market analysis are component and end user.
- Based on component, the market is divided into software and services. The software segment held a larger market share in 2023.
- In terms of end user, the market is bifurcated into marine and oil & gas. The marine segment held a larger market share in 2023.
Hydrographic Survey Market Share Analysis by Geography
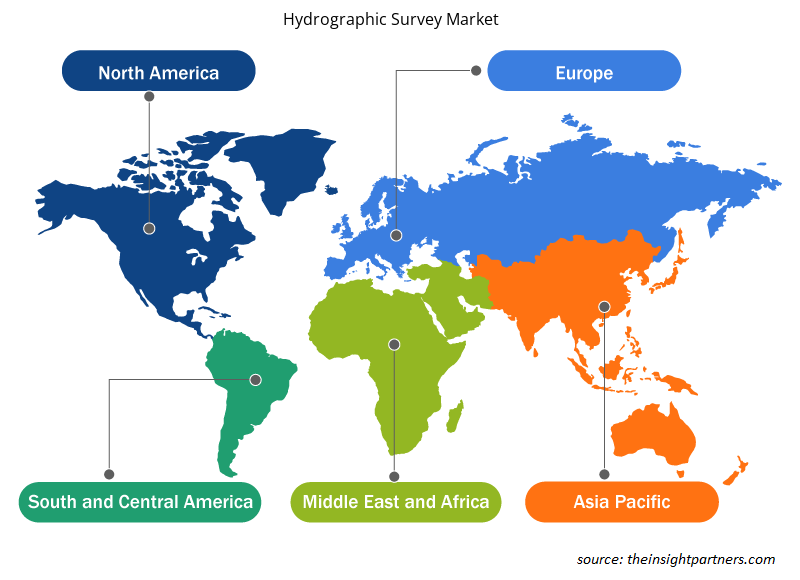
The geographic scope of the Hydrographic Survey market report is mainly divided into five regions: North America, Asia Pacific, Europe, Middle East & Africa, and South America/South & Central America. North America dominated the hydrographic survey market in 2023. North America is highly adopting hydrographic survey software and services to achieve data about water depth, the shape of the seafloor and coastline, and other physical features of water bodies. This adoption is driven by the need to improve the water bodies and ensure they are free of major issues that might lead to high maintenance requirements in the future. Furthermore, continuous advancements in technology, including the development of innovative sonar systems, LiDAR, and unmanned systems, are driving the hydrographic survey market in North America.
Hydrographic Survey Market Regional Insights
The regional trends and factors influencing the Hydrographic Survey Market throughout the forecast period have been thoroughly explained by the analysts at The Insight Partners. This section also discusses Hydrographic Survey Market segments and geography across North America, Europe, Asia Pacific, Middle East and Africa, and South and Central America.
- Get the Regional Specific Data for Hydrographic Survey Market
Hydrographic Survey Market Report Scope
| Report Attribute | Details |
|---|---|
| Market size in 2023 | US$ 1.10 billion |
| Market Size by 2031 | US$ 1.56 billion |
| Global CAGR (2023 - 2031) | 4.5% |
| Historical Data | 2021-2022 |
| Forecast period | 2023-2031 |
| Segments Covered |
By Component
|
| Regions and Countries Covered | North America
|
| Market leaders and key company profiles |
Hydrographic Survey Market Players Density: Understanding Its Impact on Business Dynamics
The Hydrographic Survey Market is growing rapidly, driven by increasing end-user demand due to factors such as evolving consumer preferences, technological advancements, and greater awareness of the product's benefits. As demand rises, businesses are expanding their offerings, innovating to meet consumer needs, and capitalizing on emerging trends, which further fuels market growth.
Market players density refers to the distribution of firms or companies operating within a particular market or industry. It indicates how many competitors (market players) are present in a given market space relative to its size or total market value.
Major Companies operating in the Hydrographic Survey Market are:
- BeamworX BV
- Hydromagic
- Xylem Inc.
- Woolpert
- Norcom Technology Limited
- Teledyne Marine (Teledyne Technologies Incorporated)
Disclaimer: The companies listed above are not ranked in any particular order.
- Get the Hydrographic Survey Market top key players overview
Hydrographic Survey Market News and Recent Developments
The hydrographic survey market is evaluated by gathering qualitative and quantitative data post primary and secondary research, which includes important corporate publications, association data, and databases. The following is a list of developments in the market:
- In February 2022, Woolpert, a US-based company specializing in hydrographic engineering and survey, acquired eTrac Inc., a vessel-based hydrographic survey and marine technology firm. The acquisition was aimed at enhancing Woolpert's solutions in integrated architecture, engineering, and geospatial (AEG) capabilities. The specific financial details of the acquisition were not disclosed.
(Source: Woolpert, Press Release, 2022)
Hydrographic Survey Market Report Coverage and Deliverables
The "Hydrographic Survey Market Size and Forecast (2021–2031)" report provides a detailed analysis of the market covering below areas:
- Market size and forecast at global, regional, and country levels for all the key market segments covered under the scope
- Market dynamics such as drivers, restraints, and key opportunities
- Key future trends
- Detailed PEST/Porter's Five Forces and SWOT analysis
- Global and regional market analysis covering key market trends, major players, regulations, and recent market developments
- Industry landscape and competition analysis covering market concentration, heat map analysis, prominent players, and recent developments
- Detailed company profiles
Frequently Asked Questions
What is the estimated market size for the global hydrographic survey market in 2023?
The hydrographic survey market size is expected to grow from US$ 1.10 billion in 2023 to US$ 1.56 billion by 2031; it is anticipated to expand at a CAGR of 4.5% from 2024 to 2031.
What are the driving factors impacting the global hydrographic survey market?
The rising need for accurate navigation, offshore exploration, and production activities is a key driver for the growth of the hydrographic survey market.
What are the future trends of the global Hydrographic Survey market?
The growing adoption of unmanned systems is likely to remain a key hydrographic survey market trends.
Which are the key players holding the major market share of the global Hydrographic Survey market?
The key players holding the majority of shares in the global Hydrographic Survey market are BeamworX BV, Hydromagic, Xylem Inc., Woolpert, and Norcom Technology Limited.
What will be the market size of the global hydrographic survey market by 2031?
The global hydrographic survey market is expected to reach US$ 1.56 billion by 2031.

Market Research & Consulting
- Historical Analysis (2 Years), Base Year, Forecast (7 Years) with CAGR
- PEST and SWOT Analysis
- Market Size Value / Volume - Global, Regional, Country
- Industry and Competitive Landscape
- Excel Dataset
- Parking Meter Apps Market
- eSIM Market
- Advanced Distributed Management System Market
- Online Exam Proctoring Market
- Electronic Data Interchange Market
- Barcode Software Market
- Maritime Analytics Market
- Cloud Manufacturing Execution System (MES) Market
- Robotic Process Automation Market
- Digital Signature Market
Testimonials
I wish to appreciate your support and the professionalism you displayed in the course of attending to my request for information regarding to infectious disease IVD market in Nigeria. I appreciate your patience, your guidance, and the fact that you were willing to offer a discount, which eventually made it possible for us to close a deal. I look forward to engaging The Insight Partners in the future, all thanks to the impression you have created in me as a result of this first encounter.
DR CHIJIOKE ONYIA MANAGING DIRECTOR, PineCrest Healthcare Ltd.The Insight Partners delivered insightful, well-structured market research with strong domain expertise. Their team was professional and responsive throughout. The user-friendly website made accessing industry reports seamless. We highly recommend them for reliable, high-quality research services
YUKIHIKO ADACHI CEO, Deep Blue, LLC.We worked with The Insight Partners for an important market study and forecast. They gave us clear insights into opportunities and risks, which helped shape our plans. Their research was easy to use and based on solid data. It helped us make smart, confident decisions. We highly recommend them.
PIYUSH NAGPAL Sr. Vice President, Market ResearchThe research report delivered details on drivers and restraints, trends, and opportunities, along with strategic activities in the market. Previously, we were struggling to get reliable information.
Manager Medical Devices ManufacturingReason to Buy
- Informed Decision-Making
- Understanding Market Dynamics
- Competitive Analysis
- Identifying Emerging Markets
- Customer Insights
- Market Forecasts
- Risk Mitigation
- Boosting Operational Efficiency
- Strategic Planning
- Investment Justification
- Tracking Industry Innovations
- Aligning with Regulatory Trends
Yes! We provide a free sample of the report, which includes Report Scope (Table of Contents), report structure, and selected insights to help you assess the value of the full report. Please click on the "Download Sample" button or contact us to receive your copy.
Absolutely — analyst assistance is part of the package. You can connect with our analyst post-purchase to clarify report insights, methodology or discuss how the findings apply to your business needs.
Once your order is successfully placed, you will receive a confirmation email along with your invoice.
• For published reports: You’ll receive access to the report within 4–6 working hours via a secured email sent to your email.
• For upcoming reports: Your order will be recorded as a pre-booking. Our team will share the estimated release date and keep you informed of any updates. As soon as the report is published, it will be delivered to your registered email.
We offer customization options to align the report with your specific objectives. Whether you need deeper insights into a particular region, industry segment, competitor analysis, or data cut, our research team can tailor the report accordingly. Please share your requirements with us, and we’ll be happy to provide a customized proposal or scope.
The report is available in either PDF format or as an Excel dataset, depending on the license you choose.
The PDF version provides the full analysis and visuals in a ready-to-read format. The Excel dataset includes all underlying data tables for easy manipulation and further analysis.
Please review the license options at checkout or contact us to confirm which formats are included with your purchase.
Our payment process is fully secure and PCI-DSS compliant.
We use trusted and encrypted payment gateways to ensure that all transactions are protected with industry-standard SSL encryption. Your payment details are never stored on our servers and are handled securely by certified third-party processors.
You can make your purchase with confidence, knowing your personal and financial information is safe with us.
Yes, we do offer special pricing for bulk purchases.
If you're interested in purchasing multiple reports, we’re happy to provide a customized bundle offer or volume-based discount tailored to your needs. Please contact our sales team with the list of reports you’re considering, and we’ll share a personalized quote.
Yes, absolutely.
Our team is available to help you make an informed decision. Whether you have questions about the report’s scope, methodology, customization options, or which license suits you best, we’re here to assist. Please reach out to us at sales@theinsightpartners.com, and one of our representatives will get in touch promptly.
Yes, a billing invoice will be automatically generated and sent to your registered email upon successful completion of your purchase.
If you need the invoice in a specific format or require additional details (such as company name, GST, or VAT information), feel free to contact us, and we’ll be happy to assist.
Yes, certainly.
If you encounter any difficulties accessing or receiving your report, our support team is ready to assist you. Simply reach out to us via email or live chat with your order information, and we’ll ensure the issue is resolved quickly so you can access your report without interruption.


 Get Free Sample For