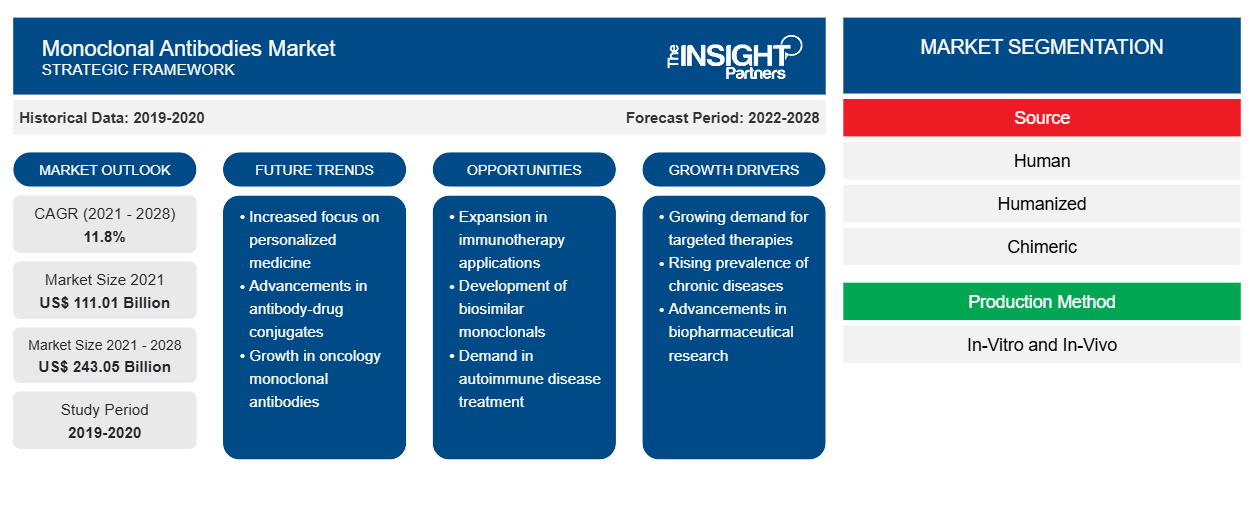
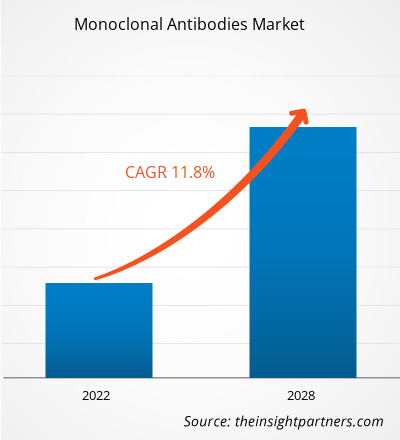
The monoclonal antibodies market is projected to reach US$ 243.05 billion by 2028 from US$ 111.01 billion in 2021; it is expected to grow at a CAGR of 11.8% from 2021 to 2028.
The increasing prevalence of cancer and other chronic diseases, and a tremendous rise in COVID-19 cases across various regions are the key factors fueling the market growth. According to World Cancer Research Fund and American Institute for Cancer, in 2020, ~18.1 million cancer cases were recorded, including 9.3 million cases in men and 8.8 million cases in women. The use of monoclonal antibodies in the treatment of various types of cancer is still in phases 2 and phase 3 trials.
North America is likely to continue its dominance in the monoclonal antibodies market during 2021–2028. The US holds the largest share of the market in this region and is expected to continue to be a dominant shareholder in the market during the forecast period. According to the statistics released by Globocan 2020, ~1,806,590 new cases of cancer were diagnosed in the US and ~606,520 people died due to this disease. As per a report by the US Department of Commerce, its National Institute of Standards and Technology (NIST) announced the funding of US$ 153 million to the National Institute for Innovation in Manufacturing Biopharmaceuticals. Additionally, the FDA has been extending support for the development of monoclonal antibodies during COVID-19 prevalence.
Customize This Report To Suit Your Requirement
You will get customization on any report - free of charge - including parts of this report, or country-level analysis, Excel Data pack, as well as avail great offers and discounts for start-ups & universities
Monoclonal Antibodies Market: Strategic Insights
- Get Top Key Market Trends of this report.This FREE sample will include data analysis, ranging from market trends to estimates and forecasts.
Market Insights
Significant Rise in Prevalence of Cancer and Other Chronic Diseases Drives Market Growth
As per the American Cancer Society report, ~16.9 million individuals with a history of cancer were residing in the US as of January 2019. By January 2030, the population of cancer survivors is estimated to rise to 22.1 million due to the growth and aging of the population alone. Therefore, with the growing prevalence of cancer and other chronic diseases, the demand for biologics, such as monoclonal antibodies (mABs), has also surged. Being principal components of many therapeutic regimens and cost-effectiveness treatments, biologics play a key role in cancer treatment.
Source-Based Insights
Based on the source, the monoclonal antibodies market is segmented into murine, chimeric, human, and humanized. The human segment is estimated to account for the largest market share during 2021–2028. The market growth of this segment is attributed to the rise on account of the integration of human monoclonal antibodies for the treatment of various kinds of infectious diseases. For instance, Regeneron launched FDA approved antibody cocktail casirivimab and imdevimab together for use in COVID-19. The drug has received Emergency Use Authorization (EUA) from FDA. It is used for the treatment of mild to moderate COVID-19 in adults as well as in pediatric patients at least 12 years of age and weighing at least 40kg. Moreover, an increase in their use in various chronic diseases and employment of advanced genetic engineering technology are among the significant factors driving the market segment's growth.
Indication-Based Insights
Based on indication, cancer, autoimmune diseases, inflammatory diseases, infectious disease, microbial disease, and others. The cancer segment would dominate the market in the coming years. Advancements related to the therapeutic application of monoclonal antibodies have enabled their successful implementation in the treatments of various cancer types, such as breast cancer, lung cancer, and colon cancer. Drugs based on these antibodies help in flagging cancer cells, triggering cell-membrane destruction, blocking immune system inhibitors, and so on. The FDA, in June 2020, approved two drugs—olaparib and rucaparib for the treatment of prostate cancer. The drug is especially effective among men with prostate cancer conditions that have spread or metastasized and has stopped responding to standard hormone treatments, i.e., castration-resistant disease condition.
End-User-Based Insights
By end-user, the monoclonal antibody market is segmented into hospitals, research institutes, and others. The hospital segment holds the largest market share owing to the increasing adoption mABs as a preferred line of treatment, especially for cancer treatment.
Companies operating in the monoclonal antibodies market adopt the product innovation strategy to meet the evolving customer demands across the world, which also permits them to maintain their brand name in the global market.
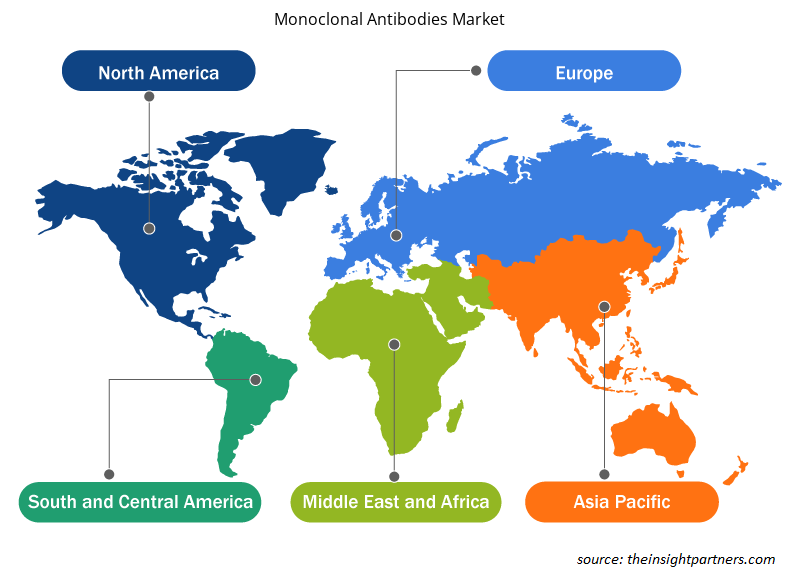
Monoclonal Antibodies Market Regional Insights
The regional trends and factors influencing the Monoclonal Antibodies Market throughout the forecast period have been thoroughly explained by the analysts at Insight Partners. This section also discusses Monoclonal Antibodies Market segments and geography across North America, Europe, Asia Pacific, Middle East and Africa, and South and Central America.
- Get the Regional Specific Data for Monoclonal Antibodies Market
Monoclonal Antibodies Market Report Scope
| Report Attribute | Details |
|---|---|
| Market size in 2021 | US$ 111.01 Billion |
| Market Size by 2028 | US$ 243.05 Billion |
| Global CAGR (2021 - 2028) | 11.8% |
| Historical Data | 2019-2020 |
| Forecast period | 2022-2028 |
| Segments Covered |
By Source
|
| Regions and Countries Covered | North America
|
| Market leaders and key company profiles |
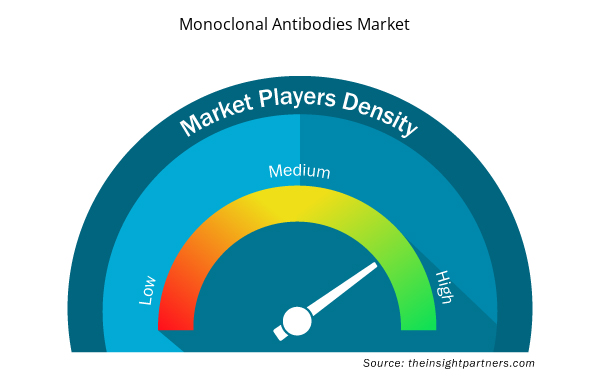
Monoclonal Antibodies Market Players Density: Understanding Its Impact on Business Dynamics
The Monoclonal Antibodies Market is growing rapidly, driven by increasing end-user demand due to factors such as evolving consumer preferences, technological advancements, and greater awareness of the product's benefits. As demand rises, businesses are expanding their offerings, innovating to meet consumer needs, and capitalizing on emerging trends, which further fuels market growth.
Market players density refers to the distribution of firms or companies operating within a particular market or industry. It indicates how many competitors (market players) are present in a given market space relative to its size or total market value.
Major Companies operating in the Monoclonal Antibodies Market are:
- Novartis AG
- Pfizer Inc.
- GlaxoSmithKline plc
- Amgen, Inc
- Daiichi Sankyo Company, Limited
Disclaimer: The companies listed above are not ranked in any particular order.
- Get the Monoclonal Antibodies Market top key players overview
Monoclonal antibodies Market - Segmentation
Based on the source, the monoclonal antibodies market is segmented into human, humanized, chimeric, and murine. By production method, the market is segmented into in-vitro and in-vivo. The monoclonal antibodies market, by indication, is further segmented as cancer, autoimmune diseases, infectious diseases, inflammatory diseases, microbial diseases, and others. By application, the market is subsegmented as therapeutic applications, diagnostic applications, and research applications. Furthermore, based on end-user, the market is segmented into hospitals, others, and research institutes..
Monoclonal antibodies Market - by Geography
- North America
- US
- Canada
- Mexico
- Europe
- France
- Germany
- Italy
- UK
- Spain
- Rest of Europe
- Asia Pacific (APAC)
- China
- India
- South Korea
- Japan
- Australia
- Rest of APAC
- Middle East and Africa (MEA)
- South Africa
- Saudi Arabia
- UAE
- Rest of MEA
- South and Central America (SCAM)
- Brazil
- Argentina
- Rest of SCAM
Company Profiles
- Novartis AG
- Pfizer Inc.
- GlaxoSmithKline plc
- Amgen, Inc
- Daiichi Sankyo Company, Limited
- F. Hoffmann-La Roche AG
- AstraZeneca
- Elli Lily and Company
- Bayer AG
- Bristol-Myers Squibb Company
- Historical Analysis (2 Years), Base Year, Forecast (7 Years) with CAGR
- PEST and SWOT Analysis
- Market Size Value / Volume - Global, Regional, Country
- Industry and Competitive Landscape
- Excel Dataset

- Fishing Equipment Market
- Cosmetic Bioactive Ingredients Market
- Excimer & Femtosecond Ophthalmic Lasers Market
- UV Curing System Market
- Airport Runway FOD Detection Systems Market
- Microplate Reader Market
- Fish Protein Hydrolysate Market
- Aircraft MRO Market
- Analog-to-Digital Converter Market
- Battery Testing Equipment Market

Report Coverage
Revenue forecast, Company Analysis, Industry landscape, Growth factors, and Trends

Segment Covered
Source, Production Method, Indication, Application, and End-User

Regional Scope
North America, Europe, Asia Pacific, Middle East & Africa, South & Central America

Country Scope
Argentina, Australia, Brazil, Canada, China, France, Germany, India, Italy, Japan, Mexico, Saudi Arabia, South Africa, South Korea, Spain, United Arab Emirates, United Kingdom, United States
Frequently Asked Questions
What are the driving factors for the monoclonal antibodies market across the globe?
Significant rise in the cancer and chronic diseases is one of the most significant factors responsible for the overall market growth.
Which segment led the monoclonal antibodies market?
Based on source, human segment took the forefront lead in the worldwide market by accounting largest share in 2020 and is expected to continue to do so till the forecast period.
What is meant by the monoclonal antibodies market?
Food and Drug Administration (FDA) defines monoclonal antibodies as immunoglobulin molecules that are secreted from a population of identical cells. They are homogenous in structure and binding specificity. These are used as multifunctional components for the immune system. They facilitate numerous cellular and humoral reactions to a variety of antigens, which include host and foreign substances.
Which production method segment held the largest revenue (US$ Mn) in the monoclonal antibodies market?
The in vitro segment dominated the global monoclonal antibodies market and accounted for the largest revenue of 75,044.50 Mn in 2021.
What is the regional market scenario of the monoclonal antibodies market?
Global monoclonal antibodies market is segmented by region into North America, Europe, Asia Pacific, Middle East & Africa, and South & Central America. In North America, the U.S. is the largest market for monoclonal antibodies market. The US is estimated to hold the largest share in the monoclonal antibodies market during the forecast period. The presence of top players and favorable regulations related to product approvals coupled with commercializing new products are the contributing factors for the regional growth. Additionally, the increasing number of R&D activities is the key factor responsible for the Asia-Pacific regional growth for monoclonal antibodies accounting fastest growth of the region during the coming years.
Who are the key players in the monoclonal antibodies market?
Novartis AG, Pfizer, Inc., GlaxoSmithKline Plc, Amgen, Inc., Daiichi Sankyo Company, Limited, F.Hoffmann-La Roche AG, AstraZeneca, Elli Lilly and Company, Bayer AG, Bristol-Myers Squibb Company are among the leading companies operating in the global monoclonal antibodies market
Trends and growth analysis reports related to Life Sciences : READ MORE..
The List of Companies - Monoclonal Antibody Market
- Novartis AG
- Pfizer Inc.
- GlaxoSmithKline plc
- Amgen, Inc
- Daiichi Sankyo Company, Limited
- F. Hoffmann-La Roche AG
- AstraZeneca
- Elli Lilly and Company
- Bayer AG
- Bristol-Myers Squibb Company
 Get Free Sample For