North America Soft Tissue Repair Market Segments and Growth by 2028
North America Soft Tissue Repair Market Forecast to 2028 - COVID-19 Impact and Regional Analysis By Product (Fixation Instruments and Tissue Mesh/Patch) and Application (Orthopedic Repair, Hernia Repair, Breast Reconstruction, Pelvic and Vaginal Prolapse Repair, Skin Repair, Dental Repair, Dural Repair, and Others)
- Status : Published
- Report Code : TIPRE00025733
- Category : Life Sciences
- No. of Pages : 184
- Available Report Formats :


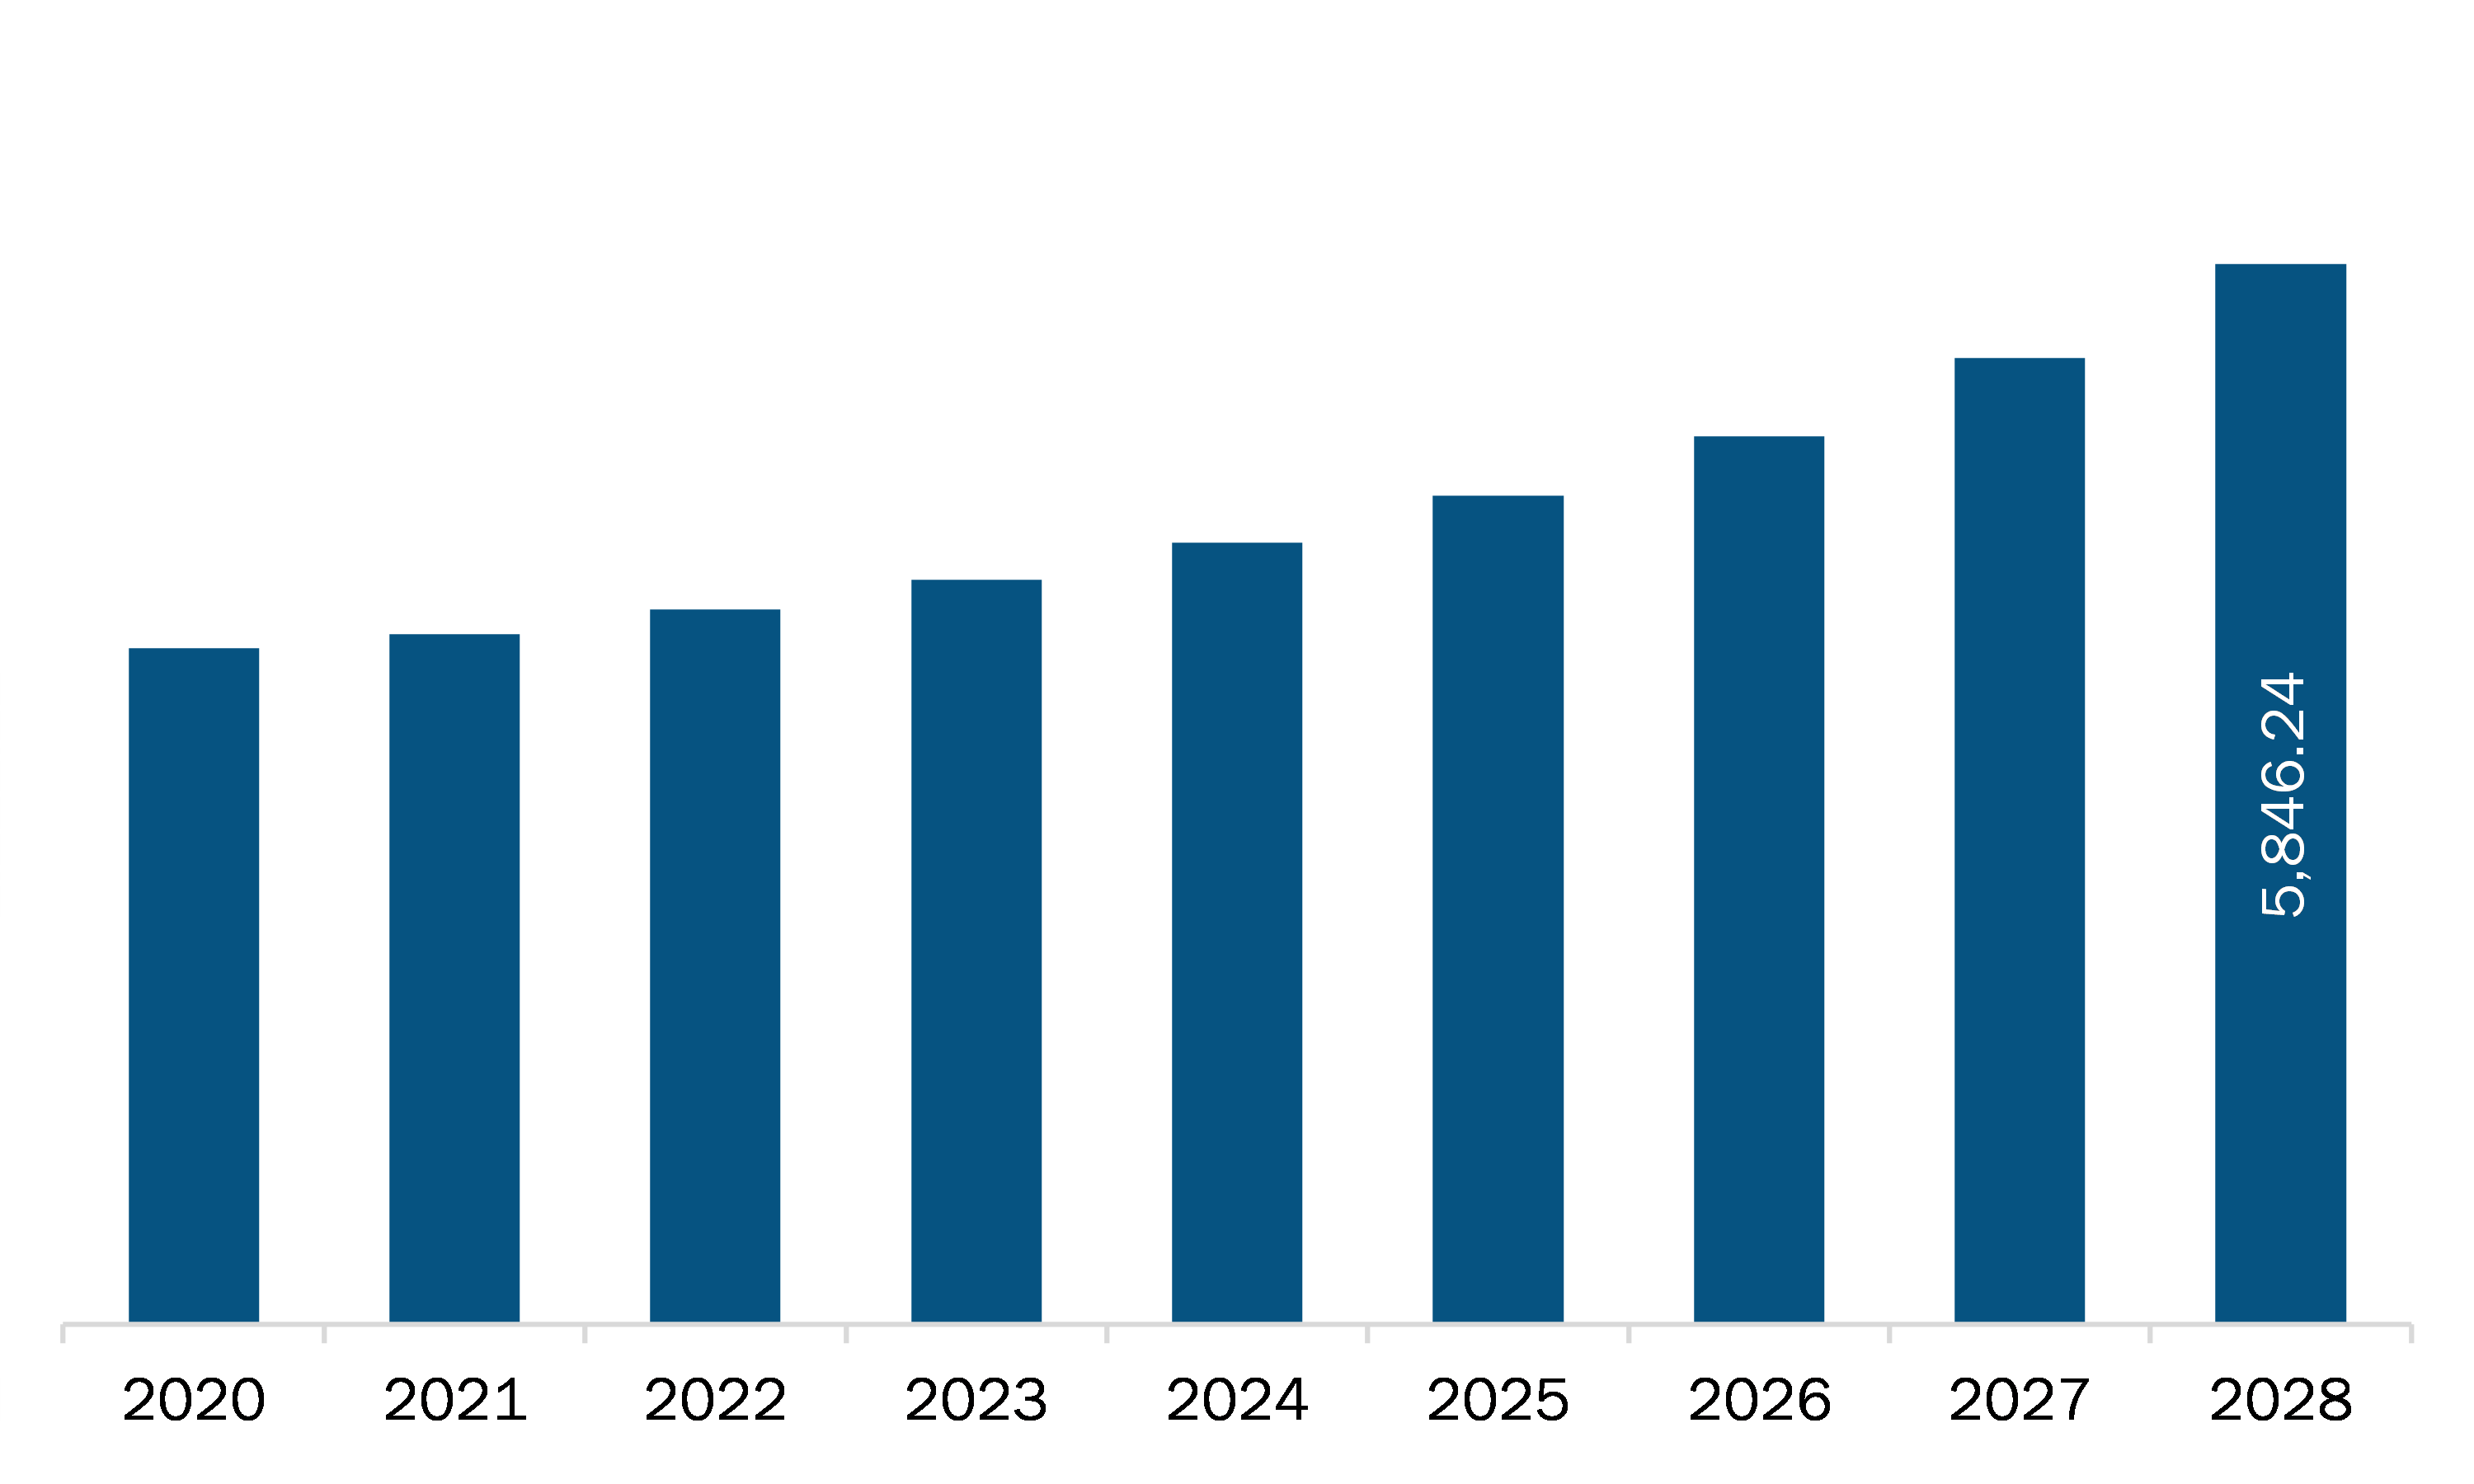
The North America soft tissue repair market is expected to grow from US$ 3,806.87 million in 2021 to US$ 5,846.24 million by 2028; it is estimated to grow at a CAGR of 6.3% from 2021 to 2028.
Playing sports benefits adolescents physiologically, psychologically, and socially. It helps improve health conditions, self-esteem, and social interactions, alongside decreasing the risk of depression. However, sports practice is inevitably linked with the occurrence of injuries. In the US, alone, 3.5 million youth under the age of 15 receive medical care every year for injuries caused during sports practice. In addition, two-thirds of these injuries required care in emergency units. According to estimates by Stanford Children’s Health, in 2019, ~30 million children participated in sports and other recreational activities in the US. Also, ~3.5 million injuries are reported in the country each year, and ~75,000 children of age 14 and below are treated for these injuries. This high participation rate of children in sports, coupled with an increase in injuries, is creating demand for sports medicines. Contact sports such as basketball and football, involving contact and collision, possess a higher rate of sports injuries. This leads to severe injuries to joints, bones, and tendons, and other soft tissues. Such injuries require emergency treatment or even surgical procedures. As per Spinal Cord, Inc., ~170,000 children with basketball-related injuries were treated in hospital emergency rooms. Thus, the rising prevalence of sports injuries is contributing to the soft tissue repair market growth.
In North America, the US and Mexico witnessed a spike in COVID-19 cases, which has compelled the governments to restrict business activities to prevent the spread of the virus. At present, all the efforts and resources are being put toward mitigating this crisis, which has slowed down other economic activities. The COVID-19 outbreak has had a significant impact on all aspects of orthopedic care and practice. The outbreak pandemic has negatively affected activities related to the outpatient clinic, emergency and elective surgery, rehabilitation, resident training, personnel management, personal protective equipment use, telemedicine, and all sub-specialties of orthopedics. Therefore, the crisis is restraining the growth of the soft tissue repair market in North America.
- Sample PDF showcases the content structure and the nature of the information with qualitative and quantitative analysis.
- Request discounts available for Start-Ups & Universities
North America Soft Tissue Repair Market Segmentation
North America Soft Tissue Repair Market – By Product
- Fixation Instruments
- Tissue Mesh/Patch
North America Soft Tissue Repair Market – By Application
- Orthopedic Repair
- Hernia Repair
- Breast Reconstruction
- Pelvic and Vaginal Prolapse Repair
- Skin Repair
- Dental Repair
- Dural Repair
- Others
North America Soft Tissue Repair Market – By Country
- US
- Canada
- Mexico

Report Coverage
Revenue forecast, Company Analysis, Industry landscape, Growth factors, and Trends

Segment Covered
This text is related
to segments covered.

Regional Scope
North America, Europe, Asia Pacific, Middle East & Africa, South & Central America

Country Scope
This text is related
to country scope.
TABLE OF CONTENTS
1. Introduction
1.1 Scope of the Study
1.2 The Insight Partners Research Report Guidance
1.3 Market Segmentation
1.3.1 North America Soft Tissue Repair Market – By Product
1.3.2 North America Soft Tissue Repair Market – By Application
1.3.3 North America Soft Tissue Repair Market – By Country
2. North America Soft Tissue Repair Market – Key Takeaways
3. Research Methodology
3.1 Coverage
3.2 Secondary Research
3.3 Primary Research
4. North America Soft Tissue Repair Market – Market Landscape
4.1 Overview
4.2 PEST Analysis
4.3 Experts Opinion
5. Soft Tissue Repair Market – Key Market Dynamics
5.1 Market Drivers
5.1.1 Rising Prevalence of Sports Injuries
5.1.2 Increase in Geriatric Population
5.2 Key Market Restraints
5.2.1 Lack of Awareness About Soft Tissue Injuries
5.3 Key Market Opportunities
5.3.1 Surge in Focus on Sports Medicine and Soft Tissue Injuries
5.3.2 Proliferation of the Healthcare Sector
5.4 Future Trends
5.4.1 Technological Developments and Product Innovations
5.5 Impact Analysis
6. Soft Tissue Repair Market – North America Analysis
6.1 North America Soft Tissue Repair Market Revenue Forecast and Analysis
7. North America Soft Tissue Repair Market Analysis– By Product
7.1 overview
7.2 North America Soft Tissue Repair Market share, by product (2021 and 2028)
7.3 Fixation Instruments market
7.3.1 Overview
7.3.2 North America Fixation Instruments Market Revenue and Forecasts To 2028 (US$ Mn)
7.3.2.1 Suture Anchors Market
7.3.2.1.1 Overview
7.3.2.1.2 North America Suture Anchors Market Revenue and Forecasts To 2028 (US$ Mn)
7.3.2.2 Interference Screws Market
7.3.2.2.1 Overview
7.3.2.2.2 North America Interference Screws Market Revenue and Forecasts To 2028 (US$ Mn)
7.3.2.3 Sutures Market
7.3.2.3.1 Overview
7.3.2.3.2 North America Sutures Market Revenue and Forecasts To 2028 (US$ Mn)
7.3.2.4 Other Fixation Instruments Market
7.3.2.4.1 Overview
7.3.2.4.2 North America Other Fixation Instruments Market Revenue and Forecasts To 2028 (US$ Mn)
7.4 Tissue Mesh/Patch market
7.4.1 Overview
7.4.2 North America Tissue Mesh/Patch Market Revenue and Forecasts To 2028 (US$ Mn)
7.4.2.1 Synthetic Mesh Market
7.4.2.1.1 Overview
7.4.2.1.2 North America Synthetic Mesh Market Revenue and Forecasts To 2028 (US$ Mn)
7.4.2.2 Biological Mesh Market
7.4.2.2.1 Overview
7.4.2.2.2 North America Biological Mesh Market Revenue and Forecasts To 2028 (US$ Mn)
7.4.2.2.3 Allograft Market
7.4.2.2.3.1 Overview
7.4.2.2.3.2 North America Allograft Market Revenue and Forecasts To 2028 (US$ Mn)
7.4.2.2.4 Xenograft Market
7.4.2.2.4.1 Overview
7.4.2.2.4.2 North America Xenograft Market Revenue and Forecasts To 2028 (US$ Mn)
8. North America Soft Tissue Repair Market analysis– by Application
8.1 overview
8.2 North America Soft Tissue Repair Market share, by Application (2021 and 2028)
8.3 Orthopedic Repair market
8.3.1 Overview
8.3.2 North America Orthopedic Repair Market Revenue and Forecasts To 2028 (US$ Mn)
8.4 Hernia Repair market
8.4.1 Overview
8.4.2 North America Hernia Repair Market Revenue and Forecasts To 2028 (US$ Mn)
8.5 Breast Reconstruction market
8.5.1 Overview
8.5.2 North America Breast Reconstruction Market Revenue and Forecasts To 2028 (US$ Mn)
8.6 Pelvic and Vaginal Prolapse Repair market
8.6.1 Overview
8.6.2 North America Pelvic and Vaginal Prolapse Repair Market Revenue and Forecasts To 2028 (US$ Mn)
8.7 Skin Repair market
8.7.1 Overview
8.7.2 North America Skin Repair Market Revenue and Forecasts To 2028 (US$ Mn)
8.8 Dental Repair market
8.8.1 Overview
8.8.2 North America Dental Repair Market Revenue and Forecasts To 2028 (US$ Mn)
8.9 Dural Repair market
8.9.1 Overview
8.9.2 North America Dural Repair Market Revenue and Forecasts To 2028 (US$ Mn)
8.10 Other Applications market
8.10.1 Overview
8.10.2 North America Other Applications Market Revenue and Forecasts To 2028 (US$ Mn)
9. North America Soft Tissue Repair Market – Country Analysis
9.1 North America: Soft Tissue Repair Market
9.1.1 Overview
9.1.3 North America: Soft Tissue Repair Market, by Country, 2021 & 2028 (%)
9.1.3.1 US: Soft Tissue Repair Market – Revenue and Forecast to 2028 (USD Million)
9.1.3.1.1 US: Soft Tissue Repair Market – Revenue and Forecast to 2028 (USD Million)
9.1.3.1.2 US Soft Tissue Repair Market, by Product – Revenue and Forecast to 2028 (USD Million)
9.1.3.1.2.1 US Soft Tissue Repair Market, by Fixation Instruments – Revenue and Forecast to 2028 (USD Million)
9.1.3.1.2.2 US Soft Tissue Repair Market, by Tissue Mesh/Patch – Revenue and Forecast to 2028 (USD Million)
9.1.3.1.2.3 US Soft Tissue Repair Market, by Biological Mesh – Revenue and Forecast to 2028 (USD Million)
9.1.3.1.3 US: Soft Tissue Repair Market, by Application – Revenue and Forecast to 2028 (USD Million)
9.1.3.2 Canada: Soft Tissue Repair Market – Revenue and Forecast to 2028 (USD Million)
9.1.3.2.1 Canada: Soft Tissue Repair Market – Revenue and Forecast to 2028 (USD Million)
9.1.3.2.2 Canada Soft Tissue Repair Market, by Product – Revenue and Forecast to 2028 (USD Million)
9.1.3.2.2.1 Canada Soft Tissue Repair Market, by Fixation Instruments – Revenue and Forecast to 2028 (USD Million)
9.1.3.2.2.2 Canada Soft Tissue Repair Market, by Tissue Mesh/Patch – Revenue and Forecast to 2028 (USD Million)
9.1.3.2.2.3 Canada Soft Tissue Repair Market, by Biological Mesh – Revenue and Forecast to 2028 (USD Million)
9.1.3.2.3 Canada: Soft Tissue Repair Market, by Application – Revenue and Forecast to 2028 (USD Million)
9.1.3.3 Mexico: Soft Tissue Repair Market – Revenue and Forecast to 2028 (USD Million)
9.1.3.3.1 Mexico: Soft Tissue Repair Market – Revenue and Forecast to 2028 (USD Million)
9.1.3.3.2 Mexico Soft Tissue Repair Market, by Product – Revenue and Forecast to 2028 (USD Million)
9.1.3.3.2.1 Mexico Soft Tissue Repair Market, by Fixation Instruments – Revenue and Forecast to 2028 (USD Million)
9.1.3.3.2.2 Mexico Soft Tissue Repair Market, by Tissue Mesh/Patch – Revenue and Forecast to 2028 (USD Million)
9.1.3.3.2.3 Mexico Soft Tissue Repair Market, by Biological Mesh – Revenue and Forecast to 2028 (USD Million)
9.1.3.3.3 Mexico: Soft Tissue Repair Market, by Application – Revenue and Forecast to 2028 (USD Million)
10. Impact of COVID-19 Pandemic on North America Soft Tissue Repair Market
10.1 North America: Impact Assessment of COVID-19 Pandemic
11. North America Soft Tissue Repair Market – Industry Landscape
11.1 Overview
11.2 Growth Strategies Done by the Companies in the Market, (%)
11.3 Organic Developments
11.3.1 Overview
11.4 Inorganic Developments
11.4.1 Overview
12. Company Profiles
12.1 Smith & Nephew
12.1.1 Key Facts
12.1.2 Business Description
12.1.3 Products and Services
12.1.4 Financial Overview
12.1.5 SWOT Analysis
12.1.6 Key Developments
12.2 DePuy Synthes
12.2.1 Key Facts
12.2.2 Business Description
12.2.3 Products and Services
12.2.4 Financial Overview
12.2.5 SWOT Analysis
12.2.6 Key Developments
12.3 Arthrex, Inc.
12.3.1 Key Facts
12.3.2 Business Description
12.3.3 Products and Services
12.3.4 Financial Overview
12.3.5 SWOT Analysis
12.3.6 Key Developments
12.4 Medtronic
12.4.1 Key Facts
12.4.2 Business Description
12.4.3 Products and Services
12.4.4 Financial Overview
12.4.5 SWOT Analysis
12.4.6 Key Developments
12.5 Integra Life Sciences Corporation
12.5.1 Key Facts
12.5.2 Business Description
12.5.3 Products and Services
12.5.4 Financial Overview
12.5.5 SWOT Analysis
12.5.6 Key Developments
12.6 Stryker Corporation
12.6.1 Key Facts
12.6.2 Business Description
12.6.3 Products and Services
12.6.4 Financial Overview
12.6.5 SWOT Analysis
12.6.6 Key Developments
12.7 BD
12.7.1 Key Facts
12.7.2 Business Description
12.7.3 Products and Services
12.7.4 Financial Overview
12.7.5 SWOT Analysis
12.7.6 Key Developments
12.8 Organogenesis Inc.
12.8.1 Key Facts
12.8.2 Business Description
12.8.3 Products and Services
12.8.4 Financial Overview
12.8.5 SWOT Analysis
12.8.6 Key Developments
12.9 Allergan Plc.
12.9.1 Key Facts
12.9.2 Business Description
12.9.3 Products and Services
12.9.4 Financial Overview
12.9.5 SWOT Analysis
12.9.6 Key Developments
12.10 W. L. Gore and Associates, Inc.
12.10.1 Key Facts
12.10.2 Business Description
12.10.3 Products and Services
12.10.4 Financial Overview
12.10.5 SWOT Analysis
12.10.6 Key Developments
12.11 Cook Medical LLC
12.11.1 Key Facts
12.11.2 Business Description
12.11.3 Products and Services
12.11.4 Financial Overview
12.11.5 SWOT Analysis
12.11.6 Key Developments
12.12 B. Braun Melsungen AG
12.12.1 Key Facts
12.12.2 Business Description
12.12.3 Products and Services
12.12.4 Financial Overview
12.12.5 SWOT Analysis
12.12.6 Key Developments
12.13 DSM
12.13.1 Key Facts
12.13.2 Business Description
12.13.3 Products and Services
12.13.4 Financial Overview
12.13.5 SWOT Analysis
12.13.6 Key Developments
12.14 Baxter International Inc.
12.14.1 Key Facts
12.14.2 Business Description
12.14.3 Products and Services
12.14.4 Financial Overview
12.14.5 SWOT Analysis
12.14.6 Key Developments
13. Appendix
13.1 About the Insight Partners
13.2 Glossary of TermsLIST OF TABLES
Table 1. North America Soft Tissue Repair Market –Revenue and Forecast to 2028 (US$ Mn)
Table 2. US Soft Tissue Repair Market, by Product – Revenue and Forecast to 2028 (USD Million)
Table 3. US Soft Tissue Repair Market, by Fixation Instruments – Revenue and Forecast to 2028 (USD Million)
Table 4. US Soft Tissue Repair Market, by Tissue Mesh/Patch – Revenue and Forecast to 2028 (USD Million)
Table 5. US Soft Tissue Repair Market, by Biological Mesh – Revenue and Forecast to 2028 (USD Million)
Table 6. US Soft Tissue Repair Market, by Application - Revenue and Forecast to 2028 (USD Million)
Table 7. Canada Soft Tissue Repair Market, by Product – Revenue and Forecast to 2028 (USD Million)
Table 8. Canada Soft Tissue Repair Market, by Fixation Instruments – Revenue and Forecast to 2028 (USD Million)
Table 9. Canada Soft Tissue Repair Market, by Tissue Mesh/Patch – Revenue and Forecast to 2028 (USD Million)
Table 10. Canada Soft Tissue Repair Market, by Biological Mesh – Revenue and Forecast to 2028 (USD Million)
Table 11. Canada Soft Tissue Repair Market, by Application - Revenue and Forecast to 2028 (USD Million)
Table 12. Mexico Soft Tissue Repair Market, by Product – Revenue and Forecast to 2028 (USD Million)
Table 13. Mexico Soft Tissue Repair Market, by Fixation Instruments – Revenue and Forecast to 2028 (USD Million)
Table 14. Mexico Soft Tissue Repair Market, by Tissue Mesh/Patch – Revenue and Forecast to 2028 (USD Million)
Table 15. Mexico Soft Tissue Repair Market, by Biological Mesh – Revenue and Forecast to 2028 (USD Million)
Table 16. Mexico Soft Tissue Repair Market, by Application - Revenue and Forecast to 2028 (USD Million)
Table 17. Organic Developments Done By Companies
Table 18. Inorganic Developments Done By Companies
Table 19. Glossary of Terms, Soft Tissue Repair MarketLIST OF FIGURES
Figure 1. Soft Tissue Repair Market Segmentation
Figure 2. Soft Tissue Repair Market Segmentation, By Country
Figure 3. North America Soft Tissue Repair Market Overview
Figure 4. Tissue Mesh/Patch Segment Held the Largest Share of the Product Segment in Soft Tissue Repair Market
Figure 5. US to Show Significant Growth During Forecast Period
Figure 7. North America Soft Tissue Repair Market, Industry Landscape
Figure 8. North America PEST Analysis
Figure 9. Soft Tissue Repair Market Impact Analysis of Driver and Restraints
Figure 10. North America Soft Tissue Repair Market – Revenue Forecast and Analysis – 2020- 2028
Figure 11. North America Soft Tissue Repair Market share, by product (2021 and 2028)
Figure 12. North America Fixation Instruments Market Revenue and Forecasts To 2028 (US$ Mn)
Figure 13. North America Suture Anchors Market Revenue and Forecasts To 2028 (US$ Mn)
Figure 14. North America Interference Screws Market Revenue and Forecasts To 2028 (US$ Mn)
Figure 15. North America Sutures Market Revenue and Forecasts To 2028 (US$ Mn)
Figure 16. North America Other Fixation Instruments Market Revenue and Forecasts To 2028 (US$ Mn)
Figure 17. North America Tissue Mesh/Patch Market Revenue and Forecasts To 2028 (US$ Mn)
Figure 18. North America Synthetic Mesh Market Revenue and Forecasts To 2028 (US$ Mn)
Figure 19. North America Biological Mesh Market Revenue and Forecasts To 2028 (US$ Mn)
Figure 20. North America Allograft Market Revenue and Forecasts To 2028 (US$ Mn)
Figure 21. North America Xenograft Market Revenue and Forecasts To 2028 (US$ Mn)
Figure 22. North America Soft Tissue Repair Market, by Application (2021 and 2028)
Figure 23. North America Orthopedic Repair Market Revenue and Forecasts to 2028 (US$ Mn)
Figure 24. North America Hernia Repair Market Revenue and Forecasts to 2028 (US$ Mn)
Figure 25. North America Breast Reconstruction Market Revenue and Forecasts to 2028 (US$ Mn)
Figure 26. North America Pelvic and Vaginal Prolapse Repair Market Revenue and Forecasts to 2028 (US$ Mn)
Figure 27. North America Skin Repair Market Revenue and Forecasts to 2028 (US$ Mn)
Figure 28. North America Dental Repair Market Revenue and Forecasts to 2028 (US$ Mn)
Figure 29. North America Dural Repair Market Revenue and Forecasts to 2028 (US$ Mn)
Figure 30. North America Other applications Market Revenue and Forecasts to 2028 (US$ Mn)
Figure 31. North America: Soft Tissue Repair Market, by Key Country – Revenue (2021) (USD Million)
Figure 32. North America: Soft Tissue Repair Market, by Country, 2021 & 2028 (%)
Figure 33. US: Soft Tissue Repair Market – Revenue and Forecast to 2028 (USD Million)
Figure 34. Canada: Soft Tissue Repair Market – Revenue and Forecast to 2028 (USD Million)
Figure 35. Mexico: Soft Tissue Repair Market – Revenue and Forecast to 2028 (USD Million)
Figure 36. Impact of COVID-19 Pandemic in North American Country Markets
Figure 37. Growth Strategies Done by the Companies in the Market, (%)Yes! We provide a free sample of the report, which includes Report Scope (Table of Contents), report structure, and selected insights to help you assess the value of the full report. Please click on the "Download Sample" button or contact us to receive your copy.
Absolutely - analyst assistance is part of the package. You can connect with our analyst post-purchase to clarify report insights, methodology or discuss how the findings apply to your business needs.
Once your order is successfully placed, you will receive a confirmation email along with your invoice.
• For published reports: You'll receive access to the report within 4-6 working hours via a secured email sent to your email.
• For upcoming reports: Your order will be recorded as a pre-booking. Our team will share the estimated release date and keep you informed of any updates. As soon as the report is published, it will be delivered to your registered email.
We offer customization options to align the report with your specific objectives. Whether you need deeper insights into a particular region, industry segment, competitor analysis, or data cut, our research team can tailor the report accordingly. Please share your requirements with us, and we'll be happy to provide a customized proposal or scope.
The report is available in either PDF format or as an Excel dataset, depending on the license you choose.
The PDF version provides the full analysis and visuals in a ready-to-read format. The Excel dataset includes all underlying data tables for easy manipulation and further analysis.
Please review the license options at checkout or contact us to confirm which formats are included with your purchase.
Our payment process is fully secure and PCI-DSS compliant.
We use trusted and encrypted payment gateways to ensure that all transactions are protected with industry-standard SSL encryption. Your payment details are never stored on our servers and are handled securely by certified third-party processors.
You can make your purchase with confidence, knowing your personal and financial information is safe with us.
Yes, we do offer special pricing for bulk purchases.
If you're interested in purchasing multiple reports, we're happy to provide a customized bundle offer or volume-based discount tailored to your needs. Please contact our sales team with the list of reports you're considering, and we'll share a personalized quote.
Yes, absolutely.
Our team is available to help you make an informed decision. Whether you have questions about the report's scope, methodology, customization options, or which license suits you best, we're here to assist. Please reach out to us at sales@theinsightpartners.com, and one of our representatives will get in touch promptly.
Yes, a billing invoice will be automatically generated and sent to your registered email upon successful completion of your purchase.
If you need the invoice in a specific format or require additional details (such as company name, GST, or VAT information), feel free to contact us, and we'll be happy to assist.
Yes, certainly.
If you encounter any difficulties accessing or receiving your report, our support team is ready to assist you. Simply reach out to us via email or live chat with your order information, and we'll ensure the issue is resolved quickly so you can access your report without interruption.
The Insight Partners performs research in 4 major stages: Data Collection & Secondary Research, Primary Research, Data Analysis and Data Triangulation & Final Review.
- Data Collection and Secondary Research:
As a market research and consulting firm operating from a decade, we have published many reports and advised several clients across the globe. First step for any study will start with an assessment of currently available data and insights from existing reports. Further, historical and current market information is collected from Investor Presentations, Annual Reports, SEC Filings, etc., and other information related to company’s performance and market positioning are gathered from Paid Databases (Factiva, Hoovers, and Reuters) and various other publications available in public domain.
Several associations trade associates, technical forums, institutes, societies and organizations are accessed to gain technical as well as market related insights through their publications such as research papers, blogs and press releases related to the studies are referred to get cues about the market. Further, white papers, journals, magazines, and other news articles published in the last 3 years are scrutinized and analyzed to understand the current market trends.
- Primary Research:
The primarily interview analysis comprise of data obtained from industry participants interview and answers to survey questions gathered by in-house primary team.
For primary research, interviews are conducted with industry experts/CEOs/Marketing Managers/Sales Managers/VPs/Subject Matter Experts from both demand and supply side to get a 360-degree view of the market. The primary team conducts several interviews based on the complexity of the markets to understand the various market trends and dynamics which makes research more credible and precise.
A typical research interview fulfils the following functions:
- Provides first-hand information on the market size, market trends, growth trends, competitive landscape, and outlook
- Validates and strengthens in-house secondary research findings
- Develops the analysis team’s expertise and market understanding
Primary research involves email interactions and telephone interviews for each market, category, segment, and sub-segment across geographies. The participants who typically take part in such a process include, but are not limited to:
- Industry participants: VPs, business development managers, market intelligence managers and national sales managers
- Outside experts: Valuation experts, research analysts and key opinion leaders specializing in the electronics and semiconductor industry.
Below is the breakup of our primary respondents by company, designation, and region:

Once we receive the confirmation from primary research sources or primary respondents, we finalize the base year market estimation and forecast the data as per the macroeconomic and microeconomic factors assessed during data collection.
- Data Analysis:
Once data is validated through both secondary as well as primary respondents, we finalize the market estimations by hypothesis formulation and factor analysis at regional and country level.
- 3.1 Macro-Economic Factor Analysis:
We analyse macroeconomic indicators such the gross domestic product (GDP), increase in the demand for goods and services across industries, technological advancement, regional economic growth, governmental policies, the influence of COVID-19, PEST analysis, and other aspects. This analysis aids in setting benchmarks for various nations/regions and approximating market splits. Additionally, the general trend of the aforementioned components aid in determining the market's development possibilities.
- 3.2 Country Level Data:
Various factors that are especially aligned to the country are taken into account to determine the market size for a certain area and country, including the presence of vendors, such as headquarters and offices, the country's GDP, demand patterns, and industry growth. To comprehend the market dynamics for the nation, a number of growth variables, inhibitors, application areas, and current market trends are researched. The aforementioned elements aid in determining the country's overall market's growth potential.
- 3.3 Company Profile:
The “Table of Contents” is formulated by listing and analyzing more than 25 - 30 companies operating in the market ecosystem across geographies. However, we profile only 10 companies as a standard practice in our syndicate reports. These 10 companies comprise leading, emerging, and regional players. Nonetheless, our analysis is not restricted to the 10 listed companies, we also analyze other companies present in the market to develop a holistic view and understand the prevailing trends. The “Company Profiles” section in the report covers key facts, business description, products & services, financial information, SWOT analysis, and key developments. The financial information presented is extracted from the annual reports and official documents of the publicly listed companies. Upon collecting the information for the sections of respective companies, we verify them via various primary sources and then compile the data in respective company profiles. The company level information helps us in deriving the base number as well as in forecasting the market size.
- 3.4 Developing Base Number:
Aggregation of sales statistics (2020-2022) and macro-economic factor, and other secondary and primary research insights are utilized to arrive at base number and related market shares for 2022. The data gaps are identified in this step and relevant market data is analyzed, collected from paid primary interviews or databases. On finalizing the base year market size, forecasts are developed on the basis of macro-economic, industry and market growth factors and company level analysis.
- Data Triangulation and Final Review:
The market findings and base year market size calculations are validated from supply as well as demand side. Demand side validations are based on macro-economic factor analysis and benchmarks for respective regions and countries. In case of supply side validations, revenues of major companies are estimated (in case not available) based on industry benchmark, approximate number of employees, product portfolio, and primary interviews revenues are gathered. Further revenue from target product/service segment is assessed to avoid overshooting of market statistics. In case of heavy deviations between supply and demand side values, all thes steps are repeated to achieve synchronization.
We follow an iterative model, wherein we share our research findings with Subject Matter Experts (SME’s) and Key Opinion Leaders (KOLs) until consensus view of the market is not formulated – this model negates any drastic deviation in the opinions of experts. Only validated and universally acceptable research findings are quoted in our reports.
We have important check points that we use to validate our research findings – which we call – data triangulation, where we validate the information, we generate from secondary sources with primary interviews and then we re-validate with our internal data bases and Subject matter experts. This comprehensive model enables us to deliver high quality, reliable data in shortest possible time.

Nov 2021
Anesthesia Machines Market
Size and Forecast (2021 - 2034), Global and Regional Share, Trend, and Growth Opportunity Analysis Report Coverage: By Product (Advanced Anesthesia Machines, Basic Anesthesia Machines, and Consumables), Customer (Small Hospitals & Nursing Home, Standalone Hospitals, Tertiary Care Hospitals, and Hospital Chain), End User (Anaesthesiologists, Critical Care Specialists, and Others), and Geography (North America, Europe, Asia Pacific, Middle East and Africa, and South and Central America)
Nov 2021
Hospital at Home Market
Size and Forecast (2021 - 2034), Global and Regional Share, Trend, and Growth Opportunity Analysis Report Coverage: By Component (Equipment & Devices and Software & Services), Service Type (Acute Care at Home, Chronic Disease Management at Home, Post Acute or Transitional Care, Palliative Care and Hospice Care, and Rehabilitation Services), Delivery Mode (Remote Monitoring and Telehealth, In-person Home Visits, and Hybrid Models), Patient Demographic ( Adult Patients and Pediatric Patients), Indication (Cardiovascular Conditions, Respiratory Diseases, Orthopedic and Post-Surgical Recovery, Infectious Diseases, Neurological Rehabilitation, and Others), Care Provider (Hospitals and Health Systems, Home Health Agencies, Primary Care or Physician Groups, and Private HaH Providers), and Geography (North America, Europe, Asia Pacific, Middle East and Africa, and South and Central America)
Nov 2021
MRI-guided Focused Ultrasound Therapy Market
Size and Forecast (2021 - 2034), Global and Regional Share, Trend, and Growth Opportunity Analysis Report Coverage: By Application (Breast Cancer, Prostate Cancer, Liver Cancer, Pancreatic Cancer, Breast Lifting and Aesthetic Application, Nipple and Areola Preservation, Post Surgical Applications, and Others), End User (Healthcare Facilities, Diagnostic Imaging Centers, and Research Centers), and Geography (North America, Europe, Asia Pacific, Middle East and Africa, and South and Central America)
Nov 2021
Drug Delivery Devices Contract Manufacturing Market
Size and Forecast (2021 - 2034), Global and Regional Share, Trend, and Growth Opportunity Analysis Report Coverage: By Device Type (Infusion Devices and Administration Set, Syringes, Inhalers, Autoinjectors, and Pen Injectors), Service Type (Full-device Manufacturing, Sub-assembly and Components, and Materials-specific Services), and Geography (North America, Europe, Asia Pacific, Middle East and Africa, and South and Central America)
Nov 2021
IVD Devices Contract Manufacturing Market
Size and Forecast (2021 - 2034), Global and Regional Share, Trend, and Growth Opportunity Analysis Report Coverage: By Service Type (Full-device Manufacturing, Sub-assembly and Components, and Materials-specific Services), Device Type (IVD consumables, IVD equipment), and Geography (North America, Europe, Asia Pacific, Middle East and Africa, and South and Central America)
Nov 2021
Gene Therapy CDMO Market
Size and Forecast (2021 - 2034), Global and Regional Share, Trend, and Growth Opportunity Analysis Report Coverage: By Service Type (Drug Development and Manufacturing, Testing and Regulatory Services, and Other Service Types), End User (Pharmaceutical Companies, Biopharmaceutical Companies, and Other End Users), and Geography (North America, Europe, Asia Pacific, Middle East and Africa, and South and Central America)
Nov 2021
RT-PCR Market
Size and Forecast (2021 - 2031), Global and Regional Share, Trend, and Growth Opportunity Analysis Report Coverage: By Product (Reagents & Consumables, Instruments, and Software & Services), Application (Research Application, Clinical Application, and Forensic Application), End user (Hospitals and Diagnostic Centers, Pharmaceutical and Biotechnology Companies, Research Laboratories and Academic Institutes, Forensic Laboratories, and Clinical Research Organizations)
Nov 2021
dPCR Market
Size and Forecast (2021 - 2031), Global and Regional Share, Trend, and Growth Opportunity Analysis Report Coverage: By Product (Reagents & Consumables, Instruments, and Software & Services), Application (Research Application, Clinical Application, and Forensic Application), End user (Hospitals and Diagnostic Centers, Pharmaceutical and Biotechnology Companies, Research Laboratories and Academic Institutes, Forensic Laboratories, and Clinical Research Organizations)
 Get Free Sample For