
工业车辆市场增长、规模、份额、趋势、关键参与者分析及 2030 年预测
工业车辆市场规模和预测(2020 - 2030 年)、全球和区域份额、趋势和增长机会分析报告范围:按类型(叉车、过道卡车、牵引车、集装箱装卸机等)、驱动类型(内燃机、电池供电和燃气驱动)、自主级别(非/半自主和自主)、应用(制造、仓储等)和地理位置
- 状态 : 已发布
- 报告代码 : TIPRE00014078
- 类别 : 汽车和运输
- 页数 : 213
- 可用报告格式 :


- 最后更新日期 : June 14, 2024

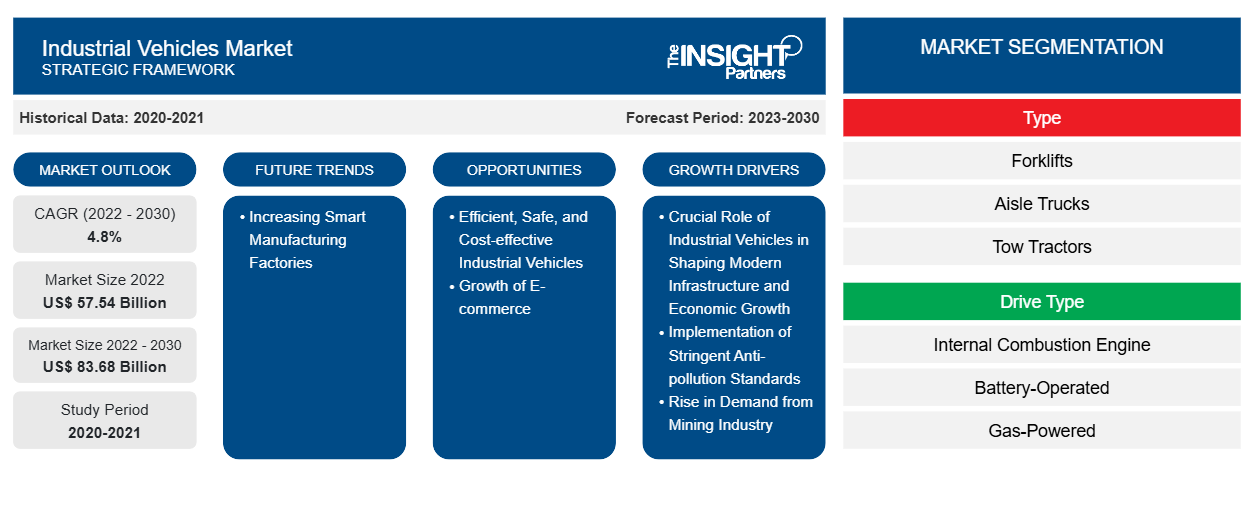
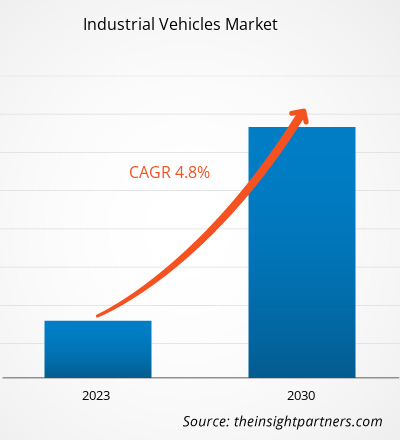
[研究报告] 2022 年工业车辆市场价值为 575.434 亿美元,预计到 2030 年将达到 836.776 亿美元;预计2022 年至 2030 年的复合年增长率为 4.8%。
分析师观点:
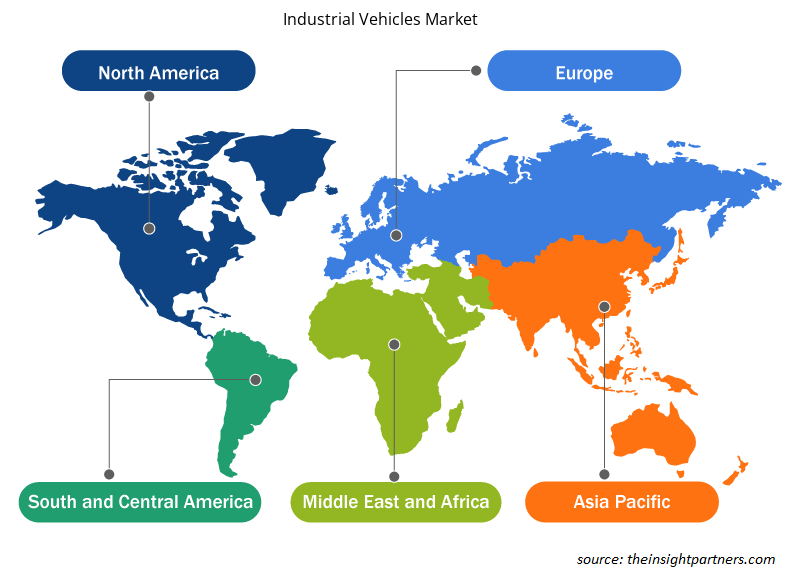
报告包括五大主要地区(北美、欧洲、亚太地区 ( APAC )、中东和非洲 ( MEA ) 和南美 (SAM))对全球工业车辆市场的预测。全球电子商务行业正在稳步发展,这鼓励企业借助多辆物料搬运车辆实现仓库自动化。电子商务行业是叉车和其他物料搬运设备需求不断增长的主要贡献者。根据联合国贸易和发展会议 ( UNCTAD )的数据,2022 年全球电子商务行业零售额达到 5.9 万亿美元,比 2021 年增长 9.26%。2022 年,每个人的平均电子商务支出约为 737.51 美元。中国是全球最大的电子商务市场。 2022 年,中国的电子商务销售额为 1.3 万亿美元,预计到 2025 年将达到 2 万亿美元。因此,电子商务行业的扩张为亚太地区工业车辆市场的增长创造了巨大的机会。
根据世界工业车辆统计协会 (WITS) 的数据,2021 年记录的物料搬运车辆和设备销量超过 234 万辆。与上一年(2020 年)相比,2021 年物料搬运行业的订单增长了 43.0%。在 234 万台物料搬运设备中,约 68.8% 或 161 万台被记录为电动叉车。随着消费者受欢迎程度的飙升,电动叉车的需求正在快速增长。随着订单数量的激增,对叉车、过道卡车和托盘车等工业车辆的需求也随之增加。因此,全球制造业对物料搬运设备和车辆的需求不断增长,推动了全球工业车辆市场的增长。
支撑北美工业车辆市场规模的关键因素包括物流和运输以及电子商务行业的扩张。近年来,美国的网上购物有所增加。2022 年,美国电子商务总销售额达到 1.03 万亿美元,高于 2018 年的 5185 亿美元。市场上的许多物流巨头,如 UPS、FedEx、USPS、XPO Logistics 和亚马逊,都意识到他们的仓库对工业车辆的需求日益增加。这些公司在仓库建立和物流运营自动化方面进行了大量投资。例如,2023 年 11 月,联合包裹服务公司在肯塔基州路易斯维尔开设了最大的仓库,占地约 20 英亩。该仓库用于存储和包裹处理,投资 7900 万美元用于建立 3,000 多台自动化机器人和工业车辆。这些机器人和工业车辆将处理多项仓库任务,例如将货物从一个地方吊起并运输到另一个地方,从而减少对人工的需求。
市场概况:
工业车辆市场涵盖了各种专用车辆,设计用于各种工业应用。这些车辆专为在工业环境中执行特定任务而设计,有助于提高不同行业的运营效率、生产力和安全性。该市场包括各种工业车辆,专门设计用于满足制造设施、仓库、建筑工地、物流运营和其他工业环境的特定需求。工业车辆的设计也侧重于解决特定的工业挑战。这包括针对物料搬运、重物起重、货物运输、挖掘和其他工业流程必不可少的专门功能等任务进行优化的车辆。
工业车辆市场正在见证技术和创新的进步,制造商不断改进叉车等车辆的功能和特性。这种对不断变化的行业需求和技术进步的适应性可以吸引寻求更高效、更先进的工业移动解决方案的企业,从而推动市场发展。各国政府都在投资欧洲制造业的自动化。例如,2021 年 7 月,英国政府宣布投资 5930 万美元( 5300 万英镑)推动数字化制造技术的发展。其中,2810 万美元( 2500 万英镑)将用于建立五个新的行业赞助研究中心,以支持开发尖端数字解决方案,从而改变制造业。剩余的金额将投资于数字供应链创新中心,并提供给 37 个独立项目,以数字化和改造制造业供应链。因此,预计政府对促进自动化的不断支持将在预测期内推动工业车辆市场的增长。
定制此报告以满足您的需求
您可以免费定制任何报告,包括本报告的部分内容、国家级分析、Excel 数据包,以及为初创企业和大学提供优惠和折扣
工业车辆市场:战略洞察
-
获取此报告的关键市场趋势。这个免费样品将包括数据分析,从市场趋势到估计和预测。
市场驱动因素:
实施严格的防污染标准推动工业车辆市场
全球范围内,工业车辆正实施严格的防污染标准,如欧洲(Stage V)和北美(Tier 4 Final)。这些标准于 2019 年 1 月 1 日开始实施,对非道路车辆(包括农业、建筑工地和工业环境中使用的车辆)的氮氧化物 (NOx) 和颗粒污染物排放施加了额外的限制。这些法规背后的驱动力是迫切需要解决公共卫生问题、改善空气质量并减轻车辆排放对气候变化的影响。应对这些环境挑战的显著措施之一是加速工业车辆的电气化。这种向电气化的转变是由满足这些严格标准设定的排放目标的迫切需要所驱动的。在建筑行业使用各种现场车辆(包括挖掘机、移动式起重机、挖掘机和推土机)以及拖拉机和联合收割机等农用车辆时,电动和混合动力替代品越来越受到青睐。
电动和混合动力工业车辆可帮助制造商和运营商遵守严格的排放标准。这些车辆产生的氮氧化物和颗粒污染物水平明显较低,符合欧洲第五阶段和北美第四阶段最终规定的法规。工业车辆有害排放的减少有助于改善空气质量,对公众健康产生积极影响。随着城市化进程的不断加快,部署更清洁、更可持续的工业车辆对于减轻车辆排放对人口稠密地区的影响至关重要。此外,人们对环境问题的认识不断提高,对可持续性的重视程度不断提高,推动了对更清洁、更高效的工业车辆的需求。优先考虑环保做法并遵守排放标准的公司可能会吸引更广泛的客户群并确保长期的市场生存能力。向电动和混合动力替代品的过渡不仅确保遵守法规,而且符合改善空气质量、应对气候变化和满足消费者对可持续做法偏好的更广泛目标。因此,实施与工业车辆相关的严格防污染标准推动了市场的发展。
节段分析:
根据车辆类型,工业车辆市场分析已考虑以下细分市场:叉车、通道卡车、牵引车、集装箱装卸机和其他(颗粒卡车、伸臂叉车、拣选机和堆垛机)。其中,由于物流和运输行业的快速增长,叉车细分市场占据了工业车辆市场份额的主导地位。根据全球物流协会的数据,2021 年,全球物流行业价值为 8.6 万亿美元,预计到 2027 年将达到 135 亿美元。2021 年,全球物流行业约 45% 集中在亚太地区。此外,2020 年北美物流业在全球的份额约为 24%,其次是欧洲。由于电子商务行业销售额的增长,亚太地区是工业车辆市场增长最快的地区。 2022 年,亚太地区的物流行业支出达到约 4.9 万亿美元,预计 2022 年至 2027 年的复合年增长率为 5.9%。中国在亚太地区的份额最大,占物流行业支出的 54.1%。这主要归功于制造业和汽车行业的经济增长。由于电子商务行业的发展以及政府的优惠政策和区域贸易举措,工业车辆被广泛用于物流行业,用于将物料从一个地方搬运到另一个地方。全球的电子商务物流行业也使用过道卡车、牵引车、集装箱搬运车、托盘车、伸臂叉车、订单拣选机和堆垛机。
区域分析:
工业车辆市场报告的范围主要集中在北美(美国、加拿大和墨西哥)、欧洲(西班牙、英国、德国、法国、意大利和欧洲其他地区)、亚太地区(韩国、中国、印度、日本、澳大利亚和亚太其他地区)、中东和非洲(南非、沙特阿拉伯、阿联酋和中东和非洲其他地区)以及南美洲和中美洲(巴西、阿根廷和南美洲和中美洲其他地区)。
就收入而言,亚太地区占据了工业车辆市场的主导地位。欧洲是全球工业车辆市场的第二大贡献者,其次是北美。北美工业车辆市场受到建筑活动增加和商用车销量上升的推动。根据美国汽车政策委员会 (AAPC) 的报告,菲亚特克莱斯勒汽车公司、福特汽车和通用汽车正在美国市场大力投资商用车制造。美国汽车制造业是全球第八大经济体,2021 年增加了约 2.64 万亿美元的价值。汽车及其零部件制造业占制造业总量的 6%。汽车行业每年为美国经济贡献超过 1.0 万亿美元,占 GDP 的 4.9%。
不断增长的建筑和施工投资,包括政府对基础设施建设的投资,正在推动北美对工业车辆的需求。例如,2021 年 8 月,美国交通和基础设施部为加拿大西部阿尔伯塔省和不列颠哥伦比亚省之间的公路扩建项目投资了约 8.37 亿美元。该项目包括修建桥梁和将两车道公路扩建为四车道公路。施工车辆帮助施工队更快、更高效地执行多项施工活动。这些车辆用于挖沟以使用不同的施工车辆运输石材或骨料等建筑材料。各种工业车辆专为特定任务而设计,可在施工现场执行多种功能。此类基础设施开发项目需要各种工业车辆,包括叉车、起重机、压路机和自卸卡车。因此,随着北美不同国家建设项目的增加,汽车行业正在扩张,从而推动了工业车辆市场的发展。
工业车辆市场区域洞察
Insight Partners 的分析师已详尽解释了预测期内影响工业车辆市场的区域趋势和因素。本节还讨论了北美、欧洲、亚太地区、中东和非洲以及南美和中美洲的工业车辆市场细分和地理位置。
- 获取工业车辆市场的区域特定数据
工业车辆市场报告范围
| 报告属性 | 细节 |
|---|---|
| 2022 年市场规模 | 575.4亿美元 |
| 2030 年市场规模 | 836.8亿美元 |
| 全球复合年增长率(2022 - 2030 年) | 4.8% |
| 史料 | 2020-2021 |
| 预测期 | 2023-2030 |
| 涵盖的领域 |
按类型
|
| 覆盖地区和国家 |
北美
|
| 市场领导者和主要公司简介 |
|
工业车辆市场参与者密度:了解其对业务动态的影响
工业车辆市场正在快速增长,这得益于终端用户需求的不断增长,而这些需求又源于消费者偏好的不断变化、技术进步以及对产品优势的认识不断提高等因素。随着需求的增加,企业正在扩大其产品范围,进行创新以满足消费者的需求,并利用新兴趋势,从而进一步推动市场增长。
市场参与者密度是指在特定市场或行业内运营的企业或公司的分布情况。它表明在给定市场空间中,相对于其规模或总市场价值,有多少竞争对手(市场参与者)存在。
在工业车辆市场运营的主要公司有:
- 凯傲集团
- 丰田自动织机公司
- 三菱重工业株式会社
- 小松制作所
- 科尼
免责声明:上面列出的公司没有按照任何特定顺序排列。
- 了解工业车辆市场顶级关键参与者概况
关键球员分析:
KION Group AG、丰田自动织机株式会社、三菱重工业株式会社、小松株式会社、科尼起重机、安徽合力股份有限公司、海斯特-耶鲁物料搬运股份有限公司、永恒力股份公司、Crown Equipment Corporation 和克拉克物料搬运公司是本报告中涉及的主要参与者。工业车辆市场报告。报告根据当前工业车辆市场趋势和影响市场的驱动因素,介绍了增长前景。
最新动态:
工业车辆市场中的公司广泛采用并购等无机和有机战略。市场主动性是公司为扩大其全球影响力并满足不断增长的客户需求而采取的战略。市场上的市场参与者主要专注于通过将先进的功能和技术集成到其产品中来增强产品和服务。以下列出了主要工业车辆市场参与者的一些最新发展:
年 |
消息 |
国家 |
|
2023 年 9 月 |
永恒力与三菱Logisnext Americas合作推出了Rocrich AGV解决方案,旨在通过该解决方案为北美市场的仓库和生产设施提供自动化解决方案。 |
北美 |
|
2023 年 7 月 |
印度最大的铝生产商韦丹塔铝业公司 (Vedanta Aluminium) 增加了其电动锂离子叉车车队,使其成为印度最大的车队。韦丹塔铝业公司在奥里萨邦和恰蒂斯加尔邦拥有 44 辆叉车,展现了其对可持续发展的承诺。 |
亚太地区 |

Naveen 是一位经验丰富的市场研究和咨询专业人士,在定制项目、联合项目和咨询项目方面拥有超过 9 年的专业经验。他目前担任副总裁,成功管理了项目价值链中的利益相关者,撰写了 100 多份研究报告和 30 多项咨询项目。他的工作涵盖工业和政府项目,为客户的成功和数据驱动的决策做出了重要贡献。
Naveen 拥有卡纳塔克邦 VTU 的电子与通信工程学位,以及马尼帕尔大学的市场营销与运营 MBA 学位。他已担任 IEEE 会员 9 年,积极参与各种会议、技术研讨会,并在分部和地区层面担任志愿者。在此之前,他曾担任 IndustryARC 的助理战略顾问和惠普(惠普全球)的工业服务器顾问。
- 全面的市场规模与预测分析
- 详细的细分市场分析
- 深入的市场动态评估
- 区域及国家级洞察
- 竞争格局与企业对标分析
- 战略性商业情报
客户评价
Insight Partners 的 SCADA 系统市场报告内容全面,对当前趋势和未来预测提供了宝贵的见解。该团队始终高度专业、响应迅速且乐于助人。我们非常满意,强烈推荐他们的服务。
兰·凯德姆 伙伴, Reali Technologies LTD我请求一份关于特定软件市场的报告,团队在几天内就完成了。报告信息非常相关,而且呈现得非常出色。之后,我请求对报告进行一些修改和补充。团队再次迅速响应,不到一周我就收到了最终报告。
让-埃尔韦·詹恩 主席, 未来分析公司我们与 Insight Partners 合作进行了一项重要的市场研究和预测。他们清晰地洞察了机遇和风险,帮助我们制定了计划。他们的研究简单易用,数据可靠,帮助我们做出了明智而自信的决策。我们强烈推荐他们。
皮尤什·纳格帕尔 高级副总裁, 远光全球Insight Partners 凭借其深厚的行业专业知识,提供了富有洞察力、结构合理的市场研究。他们的团队始终专业且响应迅速。用户友好的网站让访问行业报告变得顺畅无阻。我们强烈推荐他们可靠、高质量的研究服务。
安达幸彦 首席执行官, 深蓝有限责任公司这是我第一次从The Insight Partners购买市场报告。起初我有些犹豫,但访问了他们的网站后,我更放心地冒险购买市场报告。我对报告的质量和客户服务非常满意。我对最初的报告有一些疑问和意见,但在与他们的分析师通过电子邮件沟通了几次后,我相信这份报告可以作为我们战略规划流程的参考。非常感谢您抽出宝贵的时间,让这次体验如此愉快。我一定会向其他人推荐你们的服务,当我们需要更多市场数据时,你们将是我的首选。
约翰·铃木 总裁兼首席执行官、董事会董事, BK科技感谢您在处理我关于尼日利亚传染病体外诊断市场信息请求的过程中所展现的支持和专业精神。感谢您的耐心、指导,以及您愿意提供的折扣,最终促成了这笔交易。我期待未来与 Insight Partners 继续合作,这一切都要归功于您与我初次接触后留下的良好印象。
奇吉奥克博士 ONYIA 董事总经理, PineCrest 医疗保健有限公司购买理由
- 明智的决策
- 了解市场动态
- 竞争分析
- 客户洞察
- 市场预测
- 风险规避
- 战略规划
- 投资论证
- 识别新兴市场
- 优化营销策略
- 提升运营效率
- 顺应监管趋势


