北美燃气轮机市场战略、主要参与者、增长机会、2031 年分析和预测
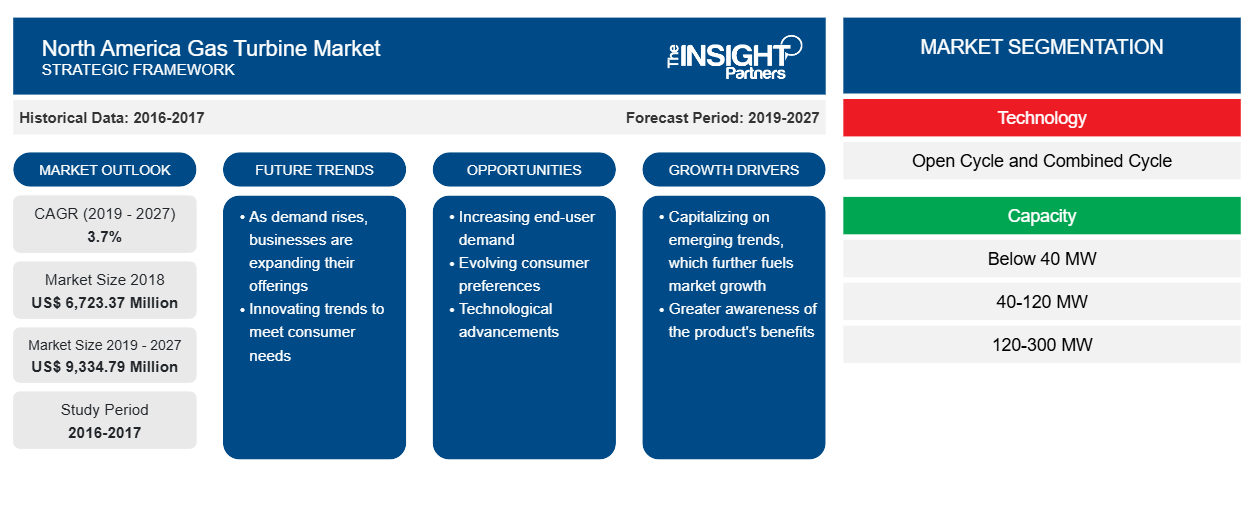
历史数据 : 2021-2023 | 基准年 : 2024 | 预测期 : 2025-2031北美燃气轮机市场规模及预测(2025 - 2031 年)、区域份额、趋势及增长机会分析报告涵盖范围:按技术(开式循环和联合循环)、容量(40 MW 以下、40-120 MW、120-300 MW 和 300 MW 以上)、应用(发电、石油和天然气以及工业)和地理区域划分
- 报告日期 : Jul 2025
- 报告代码 : TIPRE00012818
- 类别 : 能源和电力
- 状态 : 已发布
- 可用报告格式 :


- 页数 : 108
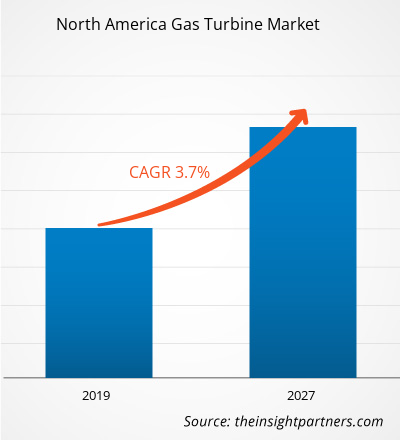
北美燃气轮机市场规模预计将从2024年的79.3804亿美元增至2031年的110.898亿美元。预计2025年至2031年期间,该市场的复合年增长率将达到5.02%。数字化和人工智能驱动的预测性维护可能会在未来几年为市场带来新的趋势。
北美燃气轮机市场分析
北美天然气储量丰富,主要集中在美国和加拿大。极具竞争力的天然气价格使燃气轮机成为发电和工业应用的经济可行的选择。此外,北美日益增长的工业活动和不断加快的城市化进程也推动了电力需求的增长。燃气轮机因其可靠性、效率以及能够使用天然气的优势,在工业领域得到了广泛的应用。
热电联产系统利用燃气轮机同时生产电力和热能,在北美发展势头迅猛。与传统发电方式相比,这类系统效率更高、排放更低。此外,预计未来几年氢燃料燃气轮机的发展将成为市场的一个强劲趋势。这些燃气轮机可以使用天然气和氢气的混合燃料,从而减少碳排放,并支持向氢能经济转型。
北美燃气轮机市场概况
北美燃气轮机市场在整个能源和工业格局中扮演着至关重要的角色。不断增长的能源需求、日益严格的环境法规以及涡轮机技术的不断进步推动着燃气轮机市场的增长。燃气轮机在发电、工业应用以及向清洁能源转型中发挥着关键作用。
北美严格的环境法规正推动公用事业和工业领域采用更清洁的能源解决方案。与燃煤电厂相比,燃气轮机的二氧化碳排放量更低,正成为发电的首选替代方案。这与全球脱碳和采用低碳能源技术的趋势相契合。
您可以免费定制任何报告,包括本报告的部分内容、国家级分析、Excel 数据包,以及为初创企业和大学提供优惠和折扣
北美燃气轮机市场:战略洞察
-
获取此报告的顶级关键市场趋势。此免费样品将包括数据分析,从市场趋势到估计和预测。
北美燃气轮机市场驱动因素和机遇
联合循环发电厂日益受到重视
联合循环和热电联产电厂因其低排放和高发电效率而被广泛采用。在联合循环电厂 (CCPP) 中,燃气轮机发电,产生的废热被回收用于生产蒸汽。这些蒸汽驱动传统的蒸汽轮机,产生额外的电力。该系统还使用余热回收蒸汽发生器 (HRSG) 来优化蒸汽生产。常规标准循环电厂的发电效率可达到约 25-40%,无需利用废热。而联合循环电厂的效率可达到约 60% 甚至更高。额外的燃烧可以进一步提高整个过程的整体效率,从而改善整体效益并降低整个生命周期的成本。
CCPP 具有显著的运营灵活性,并可根据不断发展的能源需求提供量身定制的解决方案。壳牌能源北美(美国)有限合伙公司(SENA)签署协议,将于 2024 年收购 RISEC Holdings, LLC(RISEC)100% 的股权,后者在美国罗德岛拥有一座 609 兆瓦(MW)的双机组联合循环燃气轮机发电厂。根据美国能源信息署(EIA)的数据,2022 年已有 8 座新的天然气联合循环电厂投入使用,为美国电网增加约 7,775 兆瓦的发电能力。开发商的目标是在 2025 年增加 1.6 吉瓦的联合循环燃气轮机,并计划到 2028 年为电网增加约 18.7 吉瓦的联合循环容量,其中 4.3 吉瓦已在建。因此,联合循环电厂的不断发展推动了北美燃气轮机市场的增长。
氢混燃气轮机和零碳燃气轮机日益普及
氢混零碳燃气轮机的日益普及是全球向脱碳能源系统转型的重要趋势。这些燃气轮机能够减少或消除发电产生的碳排放,特别是通过使用氢气作为燃料来源,无论是与天然气混合还是纯氢气。氢气作为零碳燃料,正成为经济脱碳的重要组成部分。它可以用作储能介质和发电设备的燃料。燃气轮机可以燃烧任何符合燃烧室要求的气体燃料。在没有技术进步的情况下,在运行中的燃气轮机燃烧室中燃烧100%的氢气(H2)非常复杂。
氢气应用是燃气轮机领域最新且前景光明的技术,旨在打造更清洁、更可持续的能源未来。通用电气 Vernova 等公司正在致力于将氢气应用于燃气轮机燃料。燃气轮机行业的公司正在强调天然气和氢气之间的差异,以及氢气作为燃气轮机主要燃料的安全使用。燃气轮机行业的不断创新和发展,推动了燃气轮机 100% 使用氢气,预计将在预测期内为燃气轮机市场带来丰厚的利润。
北美燃气轮机市场报告细分分析
有助于得出北美燃气轮机市场分析的关键部分是技术、产能和应用。
- 按技术划分,市场分为开式循环和联合循环。2024年,联合循环将占据市场主导地位。
- 根据容量划分,市场分为40兆瓦以下、40-120兆瓦、120-300兆瓦和300兆瓦以上。到2024年,120-300兆瓦的容量将占据市场主导地位。
- 从应用角度来看,市场细分为发电、石油天然气以及工业领域。2024年,发电领域占据市场主导地位。
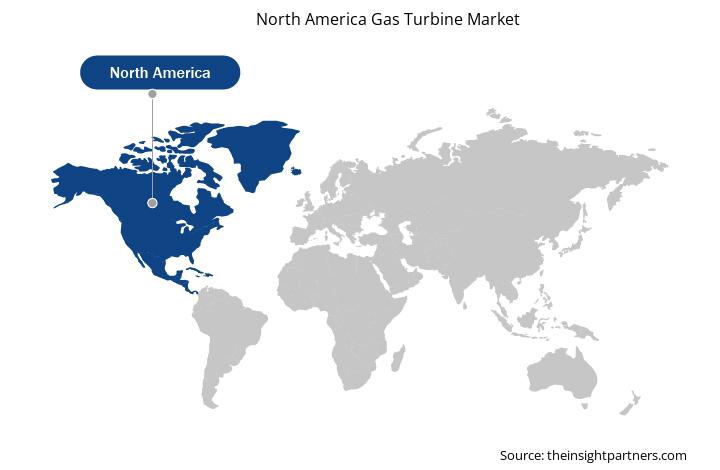
北美燃气轮机市场份额按地区分析
北美燃气轮机市场主要分为三个国家:美国、加拿大和墨西哥。2024年,美国占据市场主导地位,其次是加拿大和墨西哥。
受能源需求增长、燃气轮机技术进步以及日益重视向清洁能源转型的推动,北美燃气轮机市场有望实现大幅增长。北美正在经历从燃煤发电厂向清洁能源的转变,燃气轮机在这一转变中发挥着至关重要的作用。旨在降低碳排放的严格环境法规正在推动燃气轮机的普及,因为与燃煤电厂相比,燃气轮机的污染物排放量更少。由于对稳定高效发电的需求,电力行业在北美燃气轮机市场中占据了相当大的份额。该地区天然气的供应进一步推动了燃气轮机在工业领域的应用,包括制造业、石油和天然气以及化学加工。此外,燃气轮机凭借其高功率重量比和卓越的性能,也被广泛应用于航空领域,为飞机提供动力。以波音和洛克希德·马丁等公司为主导的北美航空航天业的蓬勃发展,是推动北美燃气轮机需求的重要驱动力。 5至40兆瓦容量的燃气轮机在中型发电厂和工业领域发展势头强劲。这些燃气轮机能够有效平衡可再生能源的间歇性。2025年4月,杜克能源和通用电气Vernova宣布建立重要的合作伙伴关系,共同开发天然气轮机及其他相关设备,以满足先进制造业、数据中心和人口增长日益增长的需求。两家公司之间的合作包括一项计划,将根据杜克能源的综合资源计划,推进多达11台7HA燃气轮机的具体项目。这将有助于杜克能源实现其业务战略,即提供可靠的能源,并尽可能降低客户成本,并应对未来最强劲的增长态势。制造商用于预测性维护的人工智能和机器学习等举措和新技术正在推动创新并扩大市场发展。
北美燃气轮机市场区域洞察
Insight Partners 的分析师已详尽阐述了预测期内影响北美燃气轮机市场的区域趋势和因素。本节还讨论了北美燃气轮机市场的各个细分市场及其地理分布,涵盖北美、欧洲、亚太地区、中东和非洲以及南美和中美洲。
- 获取北美燃气轮机市场的区域具体数据
北美燃气轮机市场报告范围
| 报告属性 | 细节 |
|---|---|
| 2024年的市场规模 | 79.3803亿美元 |
| 2031年的市场规模 | 110.8979亿美元 |
| 全球复合年增长率(2025-2031) | 5.02% |
| 史料 | 2021-2023 |
| 预测期 | 2025-2031 |
| 涵盖的领域 |
按技术
|
| 覆盖地区和国家 |
北美
|
| 市场领导者和主要公司简介 |
|
北美燃气轮机市场参与者密度:了解其对业务动态的影响
北美燃气轮机市场正在快速增长,这得益于终端用户需求的不断增长,而这些需求的驱动因素包括消费者偏好的转变、技术进步以及对产品优势的认知度的提升。随着需求的增长,企业正在扩展产品线,不断创新以满足消费者需求,并抓住新兴趋势,从而进一步推动市场增长。
市场参与者密度是指特定市场或行业内企业或公司的分布情况。它表明特定市场空间内竞争对手(市场参与者)的数量相对于其规模或总市值而言。
在北美燃气轮机市场运营的主要公司有:
- GE Vernova公司
- 西门子股份公司
- 三菱重工业有限公司
- 卡特彼勒公司
- 川崎重工业有限公司
- 贝克休斯公司
免责声明:以上列出的公司没有按照任何特定顺序排列。
- 获取北美燃气轮机市场主要参与者概览
北美燃气轮机市场新闻及最新发展
北美燃气轮机市场的评估是通过收集一手资料和二手资料后进行的定性和定量数据进行的,这些数据包括重要的企业出版物、协会数据和数据库。北美燃气轮机市场的主要发展情况如下:
- 石川岛播磨重工业株式会社(IHI)和通用电气 Vernova 公司(GE Vernova Inc.,GEV)宣布,位于日本兵库县石川岛播磨重工业株式会社相生工厂的全新大型燃烧测试设施(LCT)竣工。该设施预计将在提升下一代氨燃烧技术的性能方面发挥关键作用。新测试设施旨在测试通用电气 Vernova F 级燃气轮机的先进燃烧系统,测试工况包括压力、温度以及空气和燃料流量。(来源:通用电气 Vernova 公司,新闻稿,2025 年 6 月)
- GE Vernova宣布已获得Técnicas Reunidas和Orascom Construction(简称TR & ORASCOM CONSTRUCTION)的五台7H级燃气轮机订单,包括三台7HA.03和两台7HA.02。两家公司已签署了沙特阿拉伯东部省Qurayyah独立发电厂(IPP)扩建项目的工程、采购和施工(EPC)合同,双方各占50%股份。(来源:GE Vernova Inc,新闻稿,2025年5月)
北美燃气轮机市场报告覆盖范围和交付成果
《北美燃气轮机市场规模和预测(2025-2031)》对以下领域进行了详细的市场分析:
- 北美燃气轮机市场规模以及涵盖范围内所有主要市场领域的国家级预测
- 北美燃气轮机市场趋势以及市场动态,如驱动因素、限制因素和关键机遇
- 详细的 PEST 和 SWOT 分析
- 北美燃气轮机市场分析涵盖主要市场趋势、区域和国家框架、主要参与者、法规和最新市场发展
- 行业格局和竞争分析,涵盖市场集中度、热图分析、知名参与者以及北美燃气轮机市场的最新发展
- 详细的公司简介

Nivedita 是一位经验丰富的研究专业人士,在市场研究和商业咨询领域拥有超过 9 年的经验。她目前担任 The Insight Partners 的 ICT 领域项目经理,在管理和执行跨技术领域的联合研究、定制研究、订阅研究和咨询研究方面拥有深厚的专业知识。
Nivedita 在提供数据驱动的分析和切实可行的洞察方面拥有丰富的经验,并已成为多个关键项目的关键贡献者。她的工作涉及端到端的项目执行——从理解客户目标、分析市场趋势到制定战略建议。她与领先的 ICT 公司广泛合作,帮助他们识别市场机遇并引领行业变革。
Nivedita 拥有德拉敦 IMS 的管理学 MBA 学位。在加入 The Insight Partners 之前,她在浦那的 MarketsandMarkets 和 Future Market Insights 积累了宝贵的经验,担任过各种研究职位,并在行业分析和客户互动方面奠定了坚实的基础。
- 历史分析(2 年)、基准年、预测(7 年)及复合年增长率
- PEST和SWOT分析
- 市场规模、价值/数量 - 全球、区域、国家
- 行业和竞争格局
- Excel 数据集
近期报告
客户评价
Insight Partners 的 SCADA 系统市场报告内容全面,对当前趋势和未来预测提供了宝贵的见解。该团队始终高度专业、响应迅速且乐于助人。我们非常满意,强烈推荐他们的服务。
兰·凯德姆 伙伴, Reali Technologies LTD我请求一份关于特定软件市场的报告,团队在几天内就完成了。报告信息非常相关,而且呈现得非常出色。之后,我请求对报告进行一些修改和补充。团队再次迅速响应,不到一周我就收到了最终报告。
让-埃尔韦·詹恩 主席, 未来分析公司我们与 Insight Partners 合作进行了一项重要的市场研究和预测。他们清晰地洞察了机遇和风险,帮助我们制定了计划。他们的研究简单易用,数据可靠,帮助我们做出了明智而自信的决策。我们强烈推荐他们。
皮尤什·纳格帕尔 高级副总裁, 远光全球Insight Partners 凭借其深厚的行业专业知识,提供了富有洞察力、结构合理的市场研究。他们的团队始终专业且响应迅速。用户友好的网站让访问行业报告变得顺畅无阻。我们强烈推荐他们可靠、高质量的研究服务。
安达幸彦 首席执行官, 深蓝有限责任公司这是我第一次从The Insight Partners购买市场报告。起初我有些犹豫,但访问了他们的网站后,我更放心地冒险购买市场报告。我对报告的质量和客户服务非常满意。我对最初的报告有一些疑问和意见,但在与他们的分析师通过电子邮件沟通了几次后,我相信这份报告可以作为我们战略规划流程的参考。非常感谢您抽出宝贵的时间,让这次体验如此愉快。我一定会向其他人推荐你们的服务,当我们需要更多市场数据时,你们将是我的首选。
约翰·铃木 总裁兼首席执行官、董事会董事, BK科技感谢您在处理我关于尼日利亚传染病体外诊断市场信息请求的过程中所展现的支持和专业精神。感谢您的耐心、指导,以及您愿意提供的折扣,最终促成了这笔交易。我期待未来与 Insight Partners 继续合作,这一切都要归功于您与我初次接触后留下的良好印象。
奇吉奥克博士 ONYIA 董事总经理, PineCrest 医疗保健有限公司购买理由
- 明智的决策
- 了解市场动态
- 竞争分析
- 客户洞察
- 市场预测
- 风险规避
- 战略规划
- 投资论证
- 识别新兴市场
- 优化营销策略
- 提升运营效率
- 顺应监管趋势


 获取免费样品 - 北美燃气轮机市场