锐器容器市场战略、顶级参与者、增长机会、2030 年分析和预测
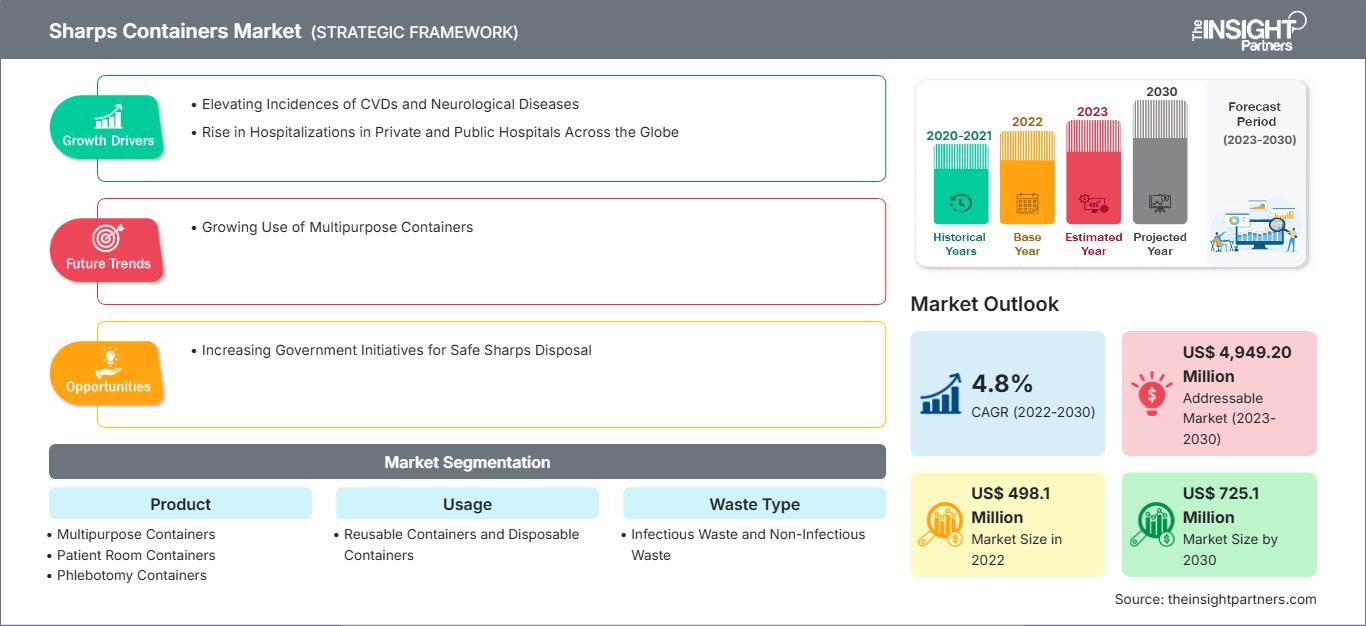
历史数据 : 2020-2021 | 基准年 : 2022 | 预测期 : 2023-20302030 年锐器容器市场预测 - 全球分析,按产品(多用途容器、病房容器和静脉切开容器)、用途(可重复使用容器和一次性容器)、废物类型(传染性废物和非传染性废物)、废物产生者(医院、制药公司、实验室、诊所和医生办公室等)、容器大小(1-3 加仑、4-6 加仑、7-8 加仑等)、分销渠道(医疗用品公司、药店、网上销售等)和地理位置划分
- 状态 : 已发布
- 报告代码 : TIPMD00002581
- 类别 : 生命科学
- 页数 : 213
- 可用报告格式 :


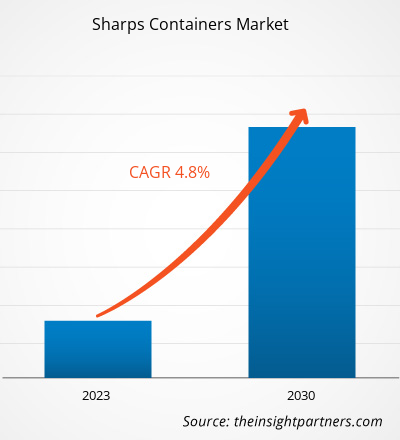
[研究报告] 2022年,锐器容器市场规模为4.981亿美元,预计到2030年将达到7.251亿美元;预计2022年至2030年的复合年增长率为4.8%。
市场洞察与分析师观点:
“锐器”是指具有尖锐尖端或边缘,可能刺破或割伤皮肤的物体,例如针头、注射器、碎玻璃、采血针、自动注射器、静脉输液器和连接针头。锐器容器专为处理用过的针头和其他锐器医疗废物而设计,旨在保护医院工作人员(包括锐器使用者和其他下游工作人员)免受因接触针头和其他锐器而造成的锐器伤害。锐器处理容器由坚硬的防刺穿塑料或金属制成,具有防漏的侧面和底部以及紧密贴合的防刺穿盖子,盖子上有一个用于存放锐器的开口。预计在预测期内,全球医疗废物产生的增加以及私立和公立医院住院人数的上升将推动锐器容器市场的增长。
增长动力和挑战:
医疗机构主要负责收集、分类和处置其产生的医疗、传染性和危险废物。传染病的流行率不断上升、医院就诊和入院人数的增加以及对诊断和临床检测需求的不断增长,导致产生了大量一次性废物。根据世界卫生组织的数据,全球每年使用1600万支注射器,但需要有适当的处置方案。在美国,尽管拥有先进的医疗设施,但接触针头和其他尖锐物体上的血源性病原体是一个严重的问题,每年发生38.5万起此类事件。在所有产生的医疗废物中,85% 属于一般无害废物,其余 15% 则为含有有害微生物的有害废物。因此,医疗废物处理刻不容缓,这也导致全球对锐器容器的需求不断增加。
根据 2020 年 9 月发表的题为《通过统计全民健康覆盖下城市社区的外科手术数量估算印度全国外科手术需求》的研究报告,全球约 11% 的疾病负担需要外科手术或麻醉护理或两者兼而有之,预计印度每年需要 3,646 例手术才能满足其外科手术需求,而全球平均每 10 万人需要进行 5,000 例手术。因此,慢性疾病负担的加重导致全球外科手术数量不断增加,而手术刀、针头、静脉注射等锐器等医疗器械被广泛使用。预计这将刺激对锐器容器的需求。
自定义此报告以满足您的要求
您将免费获得任何报告的定制,包括本报告的部分内容,或国家级分析、Excel 数据包,以及为初创企业和大学提供超值优惠和折扣
锐器容器市场: 战略洞察
-
获取本报告的主要市场趋势。这个免费样本将包括数据分析,从市场趋势到估计和预测。
然而,缺乏对锐器正确处置的认识阻碍了锐器容器市场的增长。在临床环境中,如果制定了标准,安全处置受污染材料会更容易。然而,在非医疗保健环境中,没有强制使用设计精良的锐器容器的标准。大多数糖尿病患者没有遵循锐器处置的最佳实践,即没有将锐器丢弃在指定的、上锁的废物容器中。储存舱缺乏合适的锐器隔间,导致废物收集后混杂在一起。根据世界卫生组织 (WHO) 的数据,与锐器和其他医疗废物安全处置相关的最常见问题是缺乏对其健康危害的认识。这是由于培训不足以及对适当的废物管理重视程度较低造成的。
报告细分和范围:
“全球锐器容器市场”根据产品、用途、废物类型、废物产生者、容器尺寸、分销渠道和地域进行细分。根据产品,锐器容器市场细分为多用途容器、病房容器和静脉采血容器。根据用途,锐器容器市场细分为可重复使用容器和一次性容器。根据废弃物类型,锐器容器市场分为传染性废弃物和非传染性废弃物。根据废弃物产生者,锐器容器市场细分为医院、制药公司、实验室、诊所和医生办公室等。根据容器大小,锐器容器市场细分为1-3加仑、4-6加仑、7-8加仑等。根据分销渠道,锐器容器市场细分为医疗用品公司、药店、在线销售等。根据地域划分,锐器容器市场分为北美(美国、加拿大和墨西哥)、欧洲(德国、法国、意大利、英国、西班牙和欧洲其他地区)、亚太地区(澳大利亚、中国、日本、印度、韩国和亚太其他地区)、中东和非洲(南非、沙特阿拉伯、阿联酋和中东和非洲其他地区)以及南美洲和中美洲(巴西、阿根廷和南美洲和中美洲其他地区)。
分部分析:
根据产品划分,锐器容器市场分为多用途容器、病房容器和静脉切开容器。多用途容器占据锐器容器市场的最大份额。预计在预测期内,该细分市场的复合年增长率最高,为 5.2%。多用途锐器容器可容纳各种尺寸的锐器,并配有临时和永久封闭机制。该产品专为容纳大型锐器而设计,并提供多种盖子选择,例如翻盖、滑动或旋转盖。多用途容器不受空间或功能限制;它们可在不同环境中轻松使用,易于组装且价格低廉。此外,它们还能为医护人员提供最大程度的安全保障,并且环保。因此,医疗废物量的不断增长、多次手术以及多用途容器优于其他类型容器的特性,预计将推动多用途容器的增长,从而推动锐器容器市场的发展。
根据用途,锐器容器市场分为可重复使用容器和一次性容器。2022年,可重复使用容器占据了更大的市场份额。然而,预计在预测期内,一次性容器市场的复合年增长率将达到5.4%。一次性容器也称为一次性锐器容器。一次性锐器容器方便在病房收集锐器废物。一般来说,锐器处置容器受美国食品药品监督管理局 (FDA) 监管,属于 II 类医疗器械,并需遵守上市前通知 [510(k)] 要求(21 CFR 880.5570;产品代码 MKK 和 FMI)。经 FDA 批准的锐器处置容器有多种尺寸可供选择,包括适合外出时使用的小型旅行装。上述因素预计将推动一次性容器市场的增长。
根据废弃物类型,锐器容器市场分为传染性废弃物和非传染性废弃物。2022 年,传染性废弃物占据了更大的市场份额,预计在预测期内,其复合年增长率将达到 5.0%。锐器废弃物属于传染性废弃物的一部分,包括注射器、针头、刺血针、碎玻璃以及任何其他能够穿透皮肤的物质。病原体污染加上其能够穿透皮肤屏障的特性,使其成为最危险的医疗废弃物之一。根据世界卫生组织 (WHO) 的数据,在每年 160 亿次注射中,绝大多数锐器和锐器废弃物是注射器。
根据废弃物产生者,锐器容器市场细分为医院、制药公司、实验室、诊所和医生办公室等。2022 年,医院占据了最大的市场份额,预计在预测期内,医院市场的复合年增长率最高,为 5.5%。医院是产生废弃物的重要场所。医院的每个科室都会产生废弃物,总体而言,废弃物种类繁多。这些物品可能致病并对环境有害。这些废弃物也称为危险医疗废弃物。医院是锐器废弃物容器的主要消费者。
根据容器大小,锐器容器市场细分为 1-3 加仑、4-6 加仑、7-8 加仑等。 2022年,1至3加仑的锐器容器占据了最大的市场份额,预计在预测期内,该容器的复合年增长率将达到5.2%,达到最高水平。锐器容器的容量在1至3加仑之间。这类锐器容器主要用于医疗保健行业。该产品可以壁挂或放置在工作台上。其宽大的水平开口方便处理。实验室、医生办公室、诊所、医院和外科中心等医疗机构是这类产品的主要消费者。此外,4加仑的锐器容器通常用于医院和制药公司,这些地方的废物量较大。这些容器主要用于处理生物危害材料,包括医院、研究实验室和诊断实验室产生的手术废物。
根据分销渠道,锐器容器市场细分为医疗用品公司、药店、在线销售和其他渠道。 2022 年,医疗用品公司占据了最大的市场份额。预计在预测期内,在线销售细分市场的复合年增长率最高,为 5.3%。
区域分析:
根据地域,利器容器市场分为五个主要区域:北美、欧洲、亚太地区、南美和中美以及中东和非洲。北美利器容器市场分析基于三个主要国家:美国、加拿大和墨西哥。预计在预测期内,美国将占据最大的利器容器市场份额。美国利器容器市场的增长归因于糖尿病和针刺伤病例的增加以及政府举措的不断增多。克罗恩病和糖尿病等可通过自我注射药物治疗的慢性病在美国的患病率正在上升。例如,根据 CDC 2022 年全国糖尿病统计报告估计,美国有超过 1.3 亿成年人患有糖尿病或糖尿病前期。由于注射器在给药和检查过程中的重要性,它们对于大多数治疗慢性病的诊断和治疗技术必不可少,这推动了对锐器容器的需求。
欧洲是锐器容器的第二大市场。预计在预测期内,德国将占据欧洲锐器容器市场的最大份额。德国和英国等高增长国家促进了该地区锐器容器市场的增长。法国和西班牙正在改善供应链并提高人们对废物管理的认识,这将成为该地区市场增长的主要驱动力。欧洲的监管机构正在采取措施,为环保且具有成本效益的可重复使用的锐器容器引入有利且严格的指导方针。此外,糖尿病等疾病的日益流行以及针对 COVID-19 的疫苗接种运动导致大量锐器和锐器废物需要妥善处理,从而促进了锐器容器市场的发展。然而,经济实力较弱的欧洲国家缺乏合规性以及一次性锐器容器的引入预计将阻碍该地区的增长。
COVID-19 的影响:
根据 2022 年 6 月发表在《病毒》杂志上的题为“科学家开发出适用于抗 SARS-CoV-2 药物筛选的人体细胞系”的研究,研究人员描述了一种合适的人体细胞系的创建,用于高通量测试针对导致严重急性呼吸综合征 (SARS-CoV-2) 的冠状病毒 2 的抗病毒药物。血管紧张素转换酶 2 (ACE2) 和跨膜丝氨酸蛋白酶 2 (TMPRSS2) 是病毒进入所必需的两种宿主蛋白,经过基因改造后,可在人肺癌细胞系 A549 中高水平表达。这导致开发出更多用于管理 COVID-19 的细胞系,这对疫情期间的锐器容器市场产生了重大影响。因此,疫情对锐器容器市场产生了积极影响。
锐器容器市场区域洞察
The Insight Partners 的分析师已详尽阐述了预测期内影响锐器容器市场的区域趋势和因素。本节还讨论了北美、欧洲、亚太地区、中东和非洲以及南美和中美洲的锐器容器市场细分和地域分布。
锐器容器市场报告范围
| 报告属性 | 细节 |
|---|---|
| 市场规模 2022 | US$ 498.1 Million |
| 市场规模 2030 | US$ 725.1 Million |
| 全球复合年增长率 (2022 - 2030) | 4.8% |
| 历史数据 | 2020-2021 |
| 预测期 | 2023-2030 |
| 涵盖的领域 |
By 产品
|
| 覆盖地区和国家 |
北美
|
| 市场领导者和主要公司简介 |
|
锐器容器市场参与者密度:了解其对业务动态的影响
锐器容器市场正在快速增长,这得益于终端用户需求的不断增长,而这些需求的驱动因素包括消费者偏好的不断变化、技术进步以及对产品优势的认知度不断提高。随着需求的增长,企业正在扩展产品线,不断创新以满足消费者需求,并抓住新兴趋势,从而进一步推动市场增长。
- 获取 锐器容器市场 主要参与者概述
竞争格局和主要公司:
全球锐器容器市场的知名企业包括Sanypick Plastic SA、Bondtech Corp、Mauser Group NV、EnviroTain LLC、Stericycle Inc、Dailymag Magnetic Technology Ltd、GPC Medical Ltd、Bemis Co Inc、Becton Dickinson and Co和The Harloff Co.。这些公司专注于新产品的推出和地域扩张,以满足全球日益增长的消费者需求,并扩大其专业产品组合的范围。它们拥有广泛的全球业务,这使得它们能够服务于大量客户,从而提高其锐器容器市场的份额。

Mrinal 是一位经验丰富的研究分析师,在生命科学市场情报和咨询领域拥有超过 8 年的经验。凭借战略思维和对卓越的不懈追求,她在医药预测、市场机遇评估和行业基准制定方面积累了深厚的专业知识。她的工作致力于提供切实可行的洞察,帮助客户做出明智的战略决策。
Mrinal 的核心优势在于将复杂的定量数据集转化为有意义的商业智能。她敏锐的分析能力有助于制定市场进入 (GTM) 战略,并发掘制药和医疗器械行业的增长机会。作为一名值得信赖的顾问,她始终致力于简化工作流程并建立最佳实践,从而为客户推动创新并提高运营效率。
- 历史分析(2 年)、基准年、预测(7 年)及复合年增长率
- PEST和SWOT分析
- 市场规模、价值/数量 - 全球、区域、国家
- 行业和竞争格局
- Excel 数据集
客户评价
Insight Partners 的 SCADA 系统市场报告内容全面,对当前趋势和未来预测提供了宝贵的见解。该团队始终高度专业、响应迅速且乐于助人。我们非常满意,强烈推荐他们的服务。
兰·凯德姆 伙伴, Reali Technologies LTD我请求一份关于特定软件市场的报告,团队在几天内就完成了。报告信息非常相关,而且呈现得非常出色。之后,我请求对报告进行一些修改和补充。团队再次迅速响应,不到一周我就收到了最终报告。
让-埃尔韦·詹恩 主席, 未来分析公司我们与 Insight Partners 合作进行了一项重要的市场研究和预测。他们清晰地洞察了机遇和风险,帮助我们制定了计划。他们的研究简单易用,数据可靠,帮助我们做出了明智而自信的决策。我们强烈推荐他们。
皮尤什·纳格帕尔 高级副总裁, 远光全球Insight Partners 凭借其深厚的行业专业知识,提供了富有洞察力、结构合理的市场研究。他们的团队始终专业且响应迅速。用户友好的网站让访问行业报告变得顺畅无阻。我们强烈推荐他们可靠、高质量的研究服务。
安达幸彦 首席执行官, 深蓝有限责任公司这是我第一次从The Insight Partners购买市场报告。起初我有些犹豫,但访问了他们的网站后,我更放心地冒险购买市场报告。我对报告的质量和客户服务非常满意。我对最初的报告有一些疑问和意见,但在与他们的分析师通过电子邮件沟通了几次后,我相信这份报告可以作为我们战略规划流程的参考。非常感谢您抽出宝贵的时间,让这次体验如此愉快。我一定会向其他人推荐你们的服务,当我们需要更多市场数据时,你们将是我的首选。
约翰·铃木 总裁兼首席执行官、董事会董事, BK科技感谢您在处理我关于尼日利亚传染病体外诊断市场信息请求的过程中所展现的支持和专业精神。感谢您的耐心、指导,以及您愿意提供的折扣,最终促成了这笔交易。我期待未来与 Insight Partners 继续合作,这一切都要归功于您与我初次接触后留下的良好印象。
奇吉奥克博士 ONYIA 董事总经理, PineCrest 医疗保健有限公司购买理由
- 明智的决策
- 了解市场动态
- 竞争分析
- 客户洞察
- 市场预测
- 风险规避
- 战略规划
- 投资论证
- 识别新兴市场
- 优化营销策略
- 提升运营效率
- 顺应监管趋势


 获取免费样品 - 锐器容器市场