海事分析市场分析及预测(按规模、份额、增长和趋势)2025

  • Report Code : TIPRE00003041
  • Category : Technology, Media and Telecommunications
  • Status : Published
  • No. of Pages : 227
立即购买

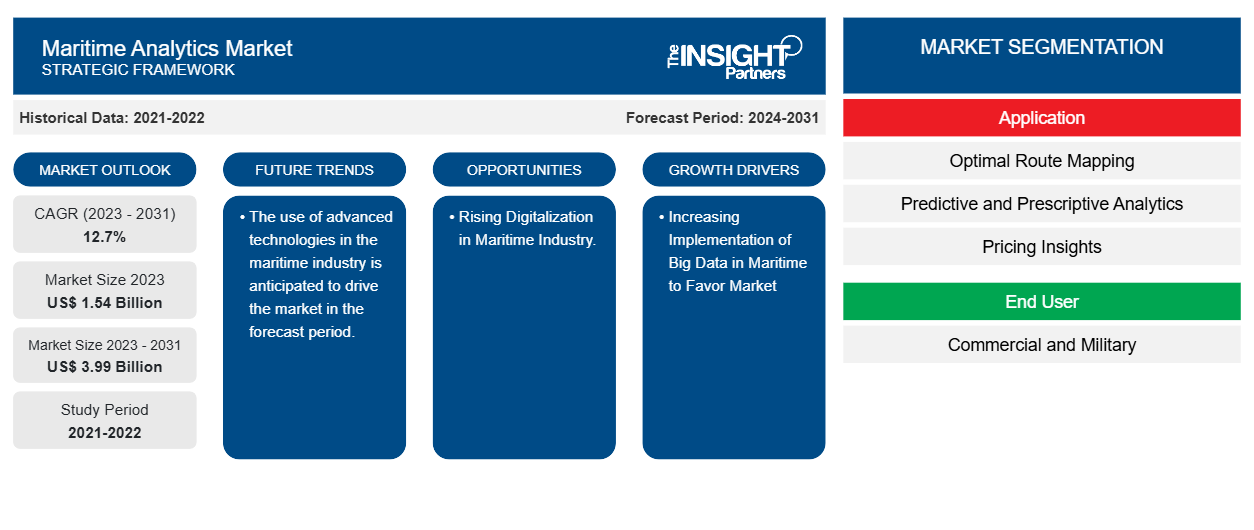
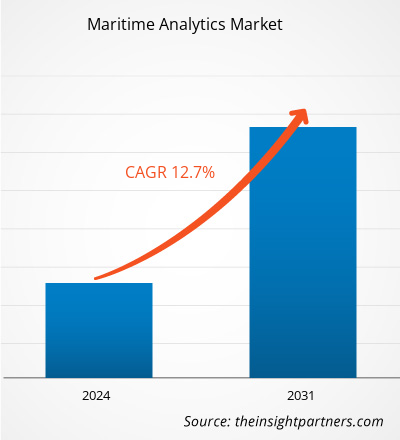
2024 年海事分析市场规模价值 12.7 亿美元,预计到 2031 年将达到 25.6 亿美元;预计 2025 年至 2031 年的复合年增长率为 10.6%。人工智能和机器学习与海事分析软件的集成可能仍将是一个关键的市场趋势。

海事分析市场分析

海事分析的主要优势之一是它能够帮助公司遵守严格的环境法规。它可以帮助监测排放、优化燃料使用,并确保遵守国际环境标准,例如国际海事组织 (IMO) 的碳排放法规。推动采用海事分析的主要驱动力之一是运营优化的需求。它可以帮助公司简化船队管理、航线优化、燃料消耗和维护计划等流程。通过利用实时数据,企业可以做出数据驱动的决策,以减少燃料使用、提高船队性能和降低运营成本,从而实现更高效、更有利可图的运营。人工智能 (AI)、机器学习 (ML)、物联网 ( IoT ) 和云计算的快速发展推动了海事分析市场的增长。这些技术能够收集、处理和分析来自船舶、港口和供应链的大量数据,为企业提供改进决策、预测趋势和提高整体运营绩效的工具。

海事分析市场概览

海事分析是指利用先进的数据分析、人工智能和机器学习技术来优化和加强海运业的运营。该过程涉及收集、处理和分析船舶、港口和其他海事资产产生的大量数据,以改进决策、简化流程并提高效率。海事分析为航运公司、物流供应商和港务局提供可行的见解,从而降低运营成本、提高安全性并提高整体效率。这些分析工具可以跟踪船舶性能、监控燃料消耗、优化航线、预测维护需求并加强船员管理。通过利用实时数据,海事分析使公司能够主动解决设备故障、航线效率低下或安全风险等潜在问题,从而减少停机时间并提高盈利能力。

定制此报告以满足您的要求

您可以免费定制任何报告,包括本报告的部分内容、国家级分析、Excel 数据包,以及为初创企业和大学提供优惠和折扣

海事分析市场:

Maritime Analytics Market
  • 获取此报告的顶级关键市场趋势。
    此免费样品将包括数据分析,从市场趋势到估计和预测。

海事分析市场驱动因素和机遇

加强海上物流和数字化

随着国际贸易的持续增长,航运业面临着越来越高的效率、可持续性和实时运营可视性需求。海事分析在满足这些需求方面发挥着至关重要的作用,它通过提供数据驱动的洞察来优化航运运营、改善船队管理并降低成本。根据联合国贸易和发展会议 ( UNCTAD ) 的数据,2023 年全球海上贸易增长 2.4%,达到 123 亿吨,从 2022 年的萎缩中反弹。预计到 2029 年,该行业将以年均 2.4% 的速度增长,从 2024 年的 2% 增长到 2029 年的 2.4%。为了扩大海上运输、物流和供应链能力,主要公司正在进行投资。2025 年 3 月,全球领先的海、陆、空和物流解决方案提供商、美国旗舰航空公司美国总统轮船 ( APL )的所有者达飞海运集团宣布 投资200 亿美元,用于加强美国海运经济并支持未来四年美国国内供应链的转型。此次公告进一步巩固了集团在美国35年的发展历史。该集团目前在美国40个州开展业务,在全美拥有15,000名员工。作为美国贸易的重要合作伙伴,飞集团每年往返美国运输超过500万个集装箱。

数字技术和数据驱动的解决方案正在改变海运业,提高效率,改善决策,并优化行业各个方面的整体绩效。数字技术的应用增强了船舶管理和维护,提高了可靠性,延长了使用寿命,并降低了成本。海运业正在加速向数字化和自动化转变。数字技术和解决方案正被用于增强竞争力和提高运营效率。这些创新正在推动行业的脱碳努力,目标是到本世纪中叶实现国际航运的零排放。2025年3月,印度和新加坡签署了一份意向书(LoI),将在海运数字化脱碳项目上进行合作,包括确定可以为这项工作做出贡献的相关利益相关者,并通过新加坡-印度绿色和数字航运走廊( GDSC )的谅解备忘录努力使伙伴关系正式化。因此,数字化的日益增长以及海上物流的不断扩张正在推动海事分析市场的增长。

监管合规和可持续发展举措

监管机构已采取积极措施减少海上运输对环境的影响。例如,国际海事组织 (IMO) 推出了能源效率现有船舶指数 (EEXI) 和碳强度指标 (CII),以执行更严格的环境标准。这些举措将于 2023 年 1 月 1 日起生效,目标是到 2050 年将船舶温室气体 (GHG) 排放量在 2008 年水平的基础上减少 50%。EEXI 和 CII 设定了基准,以衡量每海里运输每吨货物的二氧化碳排放量(IMO,2021a、2021b)。此外,欧盟的“Fit for 55”计划的目标是到 2030 年将温室气体排放量在 1990 年水平上减少 55%(欧盟委员会,2021a;欧盟委员会,2021b)。

随着各国政府和国际组织实施严格的减排目标和可持续发展法规,航运公司纷纷转向先进的分析解决方案以确保合规。这些分析工具使公司能够监测和管理其环境影响、追踪排放水平、优化燃料使用并提升船队的可持续性。通过采用这些解决方案,公司可以满足当前和未来的法规要求,同时推进其企业社会责任 (CSR) 目标。随着航运公司专注于提高运营效率并减少环境足迹,对可持续性和合规性驱动解决方案的需求日益增长,这为海事分析技术提供商创造了巨大的市场机遇。

海事分析市场报告细分分析

有助于得出海事分析市场分析的关键部分是组件、部署模式、应用程序和最终用户。

  • 根据组件,市场分为软件和服务。软件领域在2024年占据市场主导地位。
  • 根据部署模式,市场分为本地部署和云端部署。2024年,云端部署将占据市场主导地位。
  • 根据应用,市场分为最佳航线规划、预测和规范分析、定价洞察、船舶安全保障等。预测和规范分析领域在2024年占据市场主导地位。
  • 根据最终用户,市场分为商用和军用。2024年,商用市场占据主导地位。

海事分析市场份额(按地区)分析

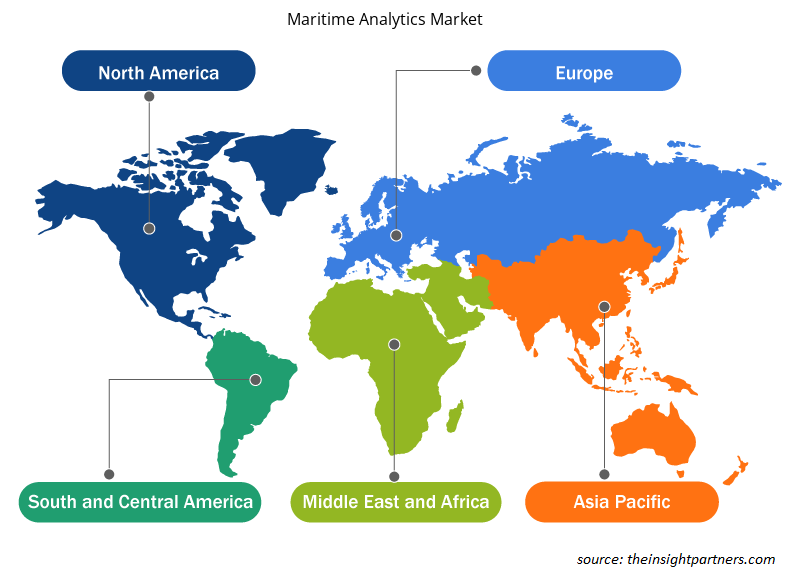
  • 海事分析市场分为五大区域:北美、欧洲、亚太地区 (APAC)、中东和非洲 (MEA) 以及南美和中美。2023 年,亚太地区占据了市场主导地位,其次是欧洲和北美。
  • 在北美地区,美国以其先进的港口基础设施和强劲的海运业而闻名,这很大程度上得益于该国对进口商品行业的依赖。根据2023年美国海运进出口贸易数据,美国的贸易总额为5.21万亿美元,贸易逆差为1.19万亿美元。制造业和生产外包给亚洲经济体加剧了这种依赖。美国海运业依赖专业的技术解决方案和服务来确保其基础设施的高效运行、维护和增长。资金支持的可用性,加上先进技术解决方案的早期采用,加速了美国企业对海事分析软件的采用。这种转变导致海运领域广泛采用专注于预测性维护、航线优化、安全和风险管理的现代工具,为市场参与者创造了机会。 2024年11月,海运贸易情报数据和分析平台Kpler签署协议,从Spire Global手中收购Spire Maritime,后者是一家提供实时全球船舶跟踪的卫星数据供应商。该交易价值2.41亿美元,其中包括2.335亿美元的收购款,以及交易完成后12个月内750万美元的额外服务费。此次收购凸显了该地区对海事分析日益增长的需求。


海事分析市场区域洞察

Insight Partners 的分析师已详尽阐述了预测期内影响海事分析市场的区域趋势和因素。本节还讨论了北美、欧洲、亚太地区、中东和非洲以及南美和中美洲的海事分析市场细分和地理分布。

Maritime Analytics Market
  • 获取海事分析市场的区域特定数据

海事分析市场报告范围

报告属性细节
2024年的市场规模12.7亿美元
2031年的市场规模25.6亿美元
全球复合年增长率(2025-2031)10.6%
史料2021-2023
预测期2025-2031
涵盖的领域按组件
  • 软件
  • 服务
按部署
  • 本地
按应用
  • 预测和规范分析
  • 最佳路线规划
  • 定价洞察
  • 船舶安全与保障
按最终用户
  • 商业的
  • 军队
覆盖地区和国家北美
  • 我们
  • 加拿大
  • 墨西哥
欧洲
  • 英国
  • 德国
  • 法国
  • 俄罗斯
  • 意大利
  • 欧洲其他地区
亚太
  • 中国
  • 印度
  • 日本
  • 澳大利亚
  • 亚太其他地区
南美洲和中美洲
  • 巴西
  • 阿根廷
  • 南美洲和中美洲其他地区
中东和非洲
  • 南非
  • 沙特阿拉伯
  • 阿联酋
  • 中东和非洲其他地区
市场领导者和主要公司简介
  • ABB
  • 零北公司
  • 独石作品
  • 迎风有限公司
  • 克普勒
  • OrbitMI公司
  • 船舶网
  • 六角AB
  • 国际海事卫星组织 GHL
  • 马里泰克


海事分析市场参与者密度:了解其对业务动态的影响

海事分析市场正在快速增长,这得益于终端用户需求的不断增长,而这些需求的驱动因素包括消费者偏好的不断变化、技术进步以及对产品优势的认知度不断提高。随着需求的增长,企业正在扩展其产品线,不断创新以满足消费者需求,并利用新兴趋势,从而进一步推动市场增长。

市场参与者密度是指特定市场或行业内企业或公司的分布情况。它表明特定市场空间内竞争对手(市场参与者)的数量相对于其规模或总市值而言。

在海事分析市场运营的主要公司有:

  1. ABB
  2. 零北公司
  3. 独石作品
  4. 迎风有限公司
  5. 克普勒
  6. OrbitMI公司

免责声明以上列出的公司没有按照任何特定顺序排列。


Maritime Analytics Market


  • 获取海事分析市场顶级关键参与者概览

海事分析市场新闻和最新发展

海事分析市场评估是通过收集一手和二手研究后的定性和定量数据进行的,这些数据包括重要的公司出版物、协会数据和数据库。以下列出了海事分析市场的一些发展情况:

  • Maritech Holdings Limited旗下品牌Sea已将所有新收购的Chinsay和MarDocs客户迁移至Sea合同管理解决方案。此举标志着Sea在其打造一个用于管理和签订合同及租船合同的综合平台的宏伟目标上迈出了重要的一步,使全球海上贸易生态系统的所有参与者受益。

(来源:Maritech Holdings Limited,新闻稿,2025 年 6 月)

  • Windward 发布了其突破性的关键海事基础设施保护解决方案。这项由人工智能驱动的创新技术旨在保护包括电缆、管道和钻井平台在内的关键全球海事基础设施,使其免受日益升级的安全威胁。

(来源:Windward,新闻稿,2025 年 2 月)

海事分析市场报告覆盖范围和交付成果

《海事分析市场规模和预测(2021-2031)》对以下领域进行了详细的市场分析:

  • 范围内涵盖的所有主要细分市场的全球、区域和国家层面的海事分析市场规模和预测
  • 海事分析市场趋势以及市场动态,例如驱动因素、限制因素和关键机遇
  • 详细的 PEST 和 SWOT 分析
  • 海事分析市场分析涵盖主要市场趋势、全球和区域框架、主要参与者、法规和最新市场发展
  • 行业格局和竞争分析,涵盖市场集中度、热图分析、知名参与者以及海事分析市场的最新发展
  • 详细的公司简介
  • 历史分析(2 年)、基准年、预测(7 年)及复合年增长率
  • PEST 和 SWOT 分析
  • 市场规模价值/数量 - 全球、区域、国家
  • 行业和竞争格局
  • Excel 数据集
maritime-analytics-market-report-deliverables-img1
maritime-analytics-market-report-deliverables-img2
Report Coverage
Report Coverage

Revenue forecast, Company Analysis, Industry landscape, Growth factors, and Trends

Segment Covered
Segment Covered

This text is related
to segments covered.

Regional Scope
Regional Scope

North America, Europe, Asia Pacific, Middle East & Africa, South & Central America

Country Scope
Country Scope

This text is related
to country scope.

常见问题


Which region is holding the major market share of maritime analytics market?

The Asia Pacific held the largest market share in 2024, followed by Europe.

What is the estimated global market size for the maritime analytics market in 2024?

The maritime analytics market was valued at US$ 1.27 billion in 2024 and is projected to reach US$ 2.56 billion by 2031; it is expected to grow at a CAGR of 10.6% during 2025–2031.

What are the future trends of the maritime analytics market?

Integration of AI and ML with maritime analytics software are the future trends of the maritime analytics market.

What are the driving factors impacting the maritime analytics market?

Increasing maritime logistics and digitization, rising need for maritime vessel management, and growth in maritime infrastructure and smart ports are the driving factors impacting the maritime analytics market.

What will be the maritime analytics market size by 2031?

The maritime analytics market is expected to reach US$ 2.56 billion in the year 2031.

Which are the key players holding the major market share of maritime analytics market?

The key players, holding majority shares, in maritime analytics market includes Wärtsilä, Inmarsat Global Limited, ABB, ZeroNorth A/S, and Hexagon AB.

Trends and growth analysis reports related to Technology, Media and Telecommunications : READ MORE..   
Your data will never be shared with third parties, however, we may send you information from time to time about our products that may be of interest to you. By submitting your details, you agree to be contacted by us. You may contact us at any time to opt-out.

The List of Companies - Maritime Analytics Market

  1. Maritech Holdings Limited
  2. ShipNet
  3. Windward Ltd 
  4. Kpler
  5. OrbitMI, Inc.
  6. ZeroNorth A/S
  7. SOLITWORK A/S
  8.  Viasat Inc
  9. Hexagon AB
  10. ABB Ltd
maritime-analytics-market-cagr

The Insight Partners performs research in 4 major stages: Data Collection & Secondary Research, Primary Research, Data Analysis and Data Triangulation & Final Review.

  1. Data Collection and Secondary Research:

As a market research and consulting firm operating from a decade, we have published and advised several client across the globe. First step for any study will start with an assessment of currently available data and insights from existing reports. Further, historical and current market information is collected from Investor Presentations, Annual Reports, SEC Filings, etc., and other information related to company’s performance and market positioning are gathered from Paid Databases (Factiva, Hoovers, and Reuters) and various other publications available in public domain.

Several associations trade associates, technical forums, institutes, societies and organization are accessed to gain technical as well as market related insights through their publications such as research papers, blogs and press releases related to the studies are referred to get cues about the market. Further, white papers, journals, magazines, and other news articles published in last 3 years are scrutinized and analyzed to understand the current market trends.

  1. Primary Research:

The primarily interview analysis comprise of data obtained from industry participants interview and answers to survey questions gathered by in-house primary team.

For primary research, interviews are conducted with industry experts/CEOs/Marketing Managers/VPs/Subject Matter Experts from both demand and supply side to get a 360-degree view of the market. The primary team conducts several interviews based on the complexity of the markets to understand the various market trends and dynamics which makes research more credible and precise.

A typical research interview fulfils the following functions:

  • Provides first-hand information on the market size, market trends, growth trends, competitive landscape, and outlook
  • Validates and strengthens in-house secondary research findings
  • Develops the analysis team’s expertise and market understanding

Primary research involves email interactions and telephone interviews for each market, category, segment, and sub-segment across geographies. The participants who typically take part in such a process include, but are not limited to:

  • Industry participants: VPs, business development managers, market intelligence managers and national sales managers
  • Outside experts: Valuation experts, research analysts and key opinion leaders specializing in the electronics and semiconductor industry.

Below is the breakup of our primary respondents by company, designation, and region:

Research Methodology

Once we receive the confirmation from primary research sources or primary respondents, we finalize the base year market estimation and forecast the data as per the macroeconomic and microeconomic factors assessed during data collection.

  1. Data Analysis:

Once data is validated through both secondary as well as primary respondents, we finalize the market estimations by hypothesis formulation and factor analysis at regional and country level.

  • Macro-Economic Factor Analysis:

We analyse macroeconomic indicators such the gross domestic product (GDP), increase in the demand for goods and services across industries, technological advancement, regional economic growth, governmental policies, the influence of COVID-19, PEST analysis, and other aspects. This analysis aids in setting benchmarks for various nations/regions and approximating market splits. Additionally, the general trend of the aforementioned components aid in determining the market's development possibilities.

  • Country Level Data:

Various factors that are especially aligned to the country are taken into account to determine the market size for a certain area and country, including the presence of vendors, such as headquarters and offices, the country's GDP, demand patterns, and industry growth. To comprehend the market dynamics for the nation, a number of growth variables, inhibitors, application areas, and current market trends are researched. The aforementioned elements aid in determining the country's overall market's growth potential.

  • Company Profile:

The “Table of Contents” is formulated by listing and analyzing more than 25 - 30 companies operating in the market ecosystem across geographies. However, we profile only 10 companies as a standard practice in our syndicate reports. These 10 companies comprise leading, emerging, and regional players. Nonetheless, our analysis is not restricted to the 10 listed companies, we also analyze other companies present in the market to develop a holistic view and understand the prevailing trends. The “Company Profiles” section in the report covers key facts, business description, products & services, financial information, SWOT analysis, and key developments. The financial information presented is extracted from the annual reports and official documents of the publicly listed companies. Upon collecting the information for the sections of respective companies, we verify them via various primary sources and then compile the data in respective company profiles. The company level information helps us in deriving the base number as well as in forecasting the market size.

  • Developing Base Number:

Aggregation of sales statistics (2020-2022) and macro-economic factor, and other secondary and primary research insights are utilized to arrive at base number and related market shares for 2022. The data gaps are identified in this step and relevant market data is analyzed, collected from paid primary interviews or databases. On finalizing the base year market size, forecasts are developed on the basis of macro-economic, industry and market growth factors and company level analysis.

  1. Data Triangulation and Final Review:

The market findings and base year market size calculations are validated from supply as well as demand side. Demand side validations are based on macro-economic factor analysis and benchmarks for respective regions and countries. In case of supply side validations, revenues of major companies are estimated (in case not available) based on industry benchmark, approximate number of employees, product portfolio, and primary interviews revenues are gathered. Further revenue from target product/service segment is assessed to avoid overshooting of market statistics. In case of heavy deviations between supply and demand side values, all thes steps are repeated to achieve synchronization.

We follow an iterative model, wherein we share our research findings with Subject Matter Experts (SME’s) and Key Opinion Leaders (KOLs) until consensus view of the market is not formulated – this model negates any drastic deviation in the opinions of experts. Only validated and universally acceptable research findings are quoted in our reports.

We have important check points that we use to validate our research findings – which we call – data triangulation, where we validate the information, we generate from secondary sources with primary interviews and then we re-validate with our internal data bases and Subject matter experts. This comprehensive model enables us to deliver high quality, reliable data in shortest possible time.