Data Fabric-Marktgröße, Trends, Anteile und Prognose – 2030
Historische Daten : 2021-2022 | Basisjahr : 2023 | Prognosezeitraum : 2024-2031Marktgröße und -prognose für Data Fabric (2021 – 2031), Bericht über globale und regionale Anteile, Trends und Wachstumschancenanalysen: Nach Bereitstellung (vor Ort und in der Cloud), Komponente (Software und Dienste), Lösung (Datenermittlung, Datenaufnahme, Datenorchestrierung, Fabric-Datenzugriff, Datenverwaltung und Fabric-Verwaltung) und Endbenutzer (BFSI, IT und Telekommunikation, Einzelhandel, Gesundheitswesen und Pharmazeutik und andere) und Geografie (Nordamerika, Europa, Asien-Pazifik sowie Süd- und Mittelamerika)
- Status : Veröffentlichte Daten
- Berichtscode : TIPTE100000792
- Kategorie : Technologie, Medien und Telekommunikation
- Anzahl der Seiten : 150
- Verfügbare Berichtsformate :


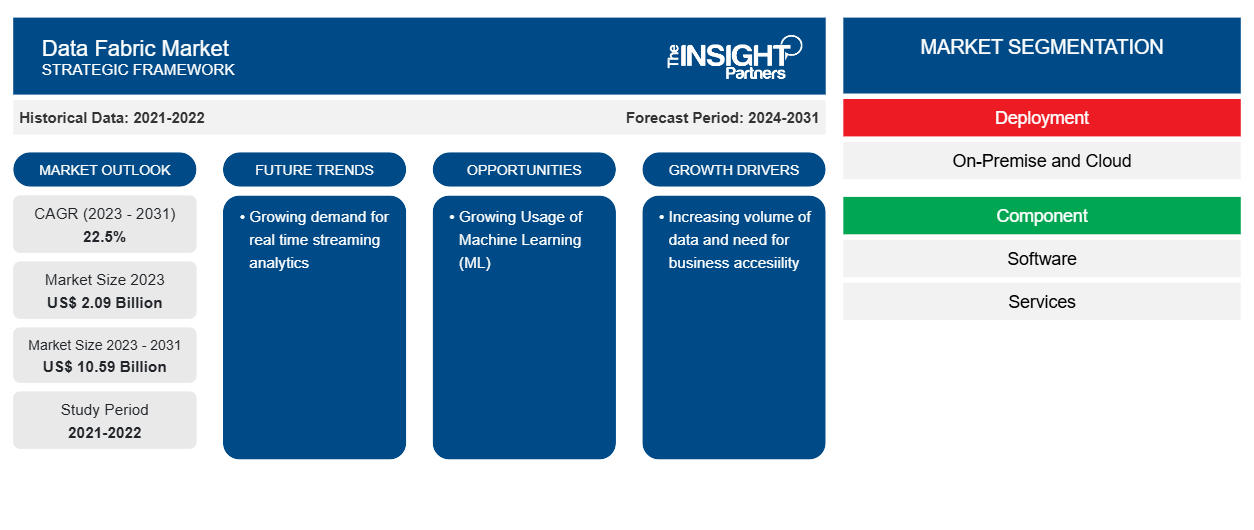
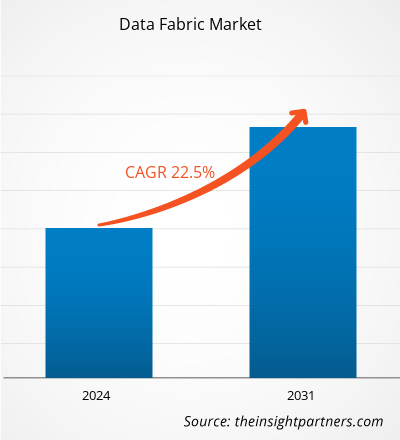
Der Data Fabric-Markt soll von 2,09 Milliarden US-Dollar im Jahr 2023 auf 10,59 Milliarden US-Dollar im Jahr 2031 wachsen; von 2023 bis 2031 wird eine durchschnittliche jährliche Wachstumsrate von 22,5 % erwartet. Die steigende Nachfrage nach Echtzeit-Streaming-Analysen dürfte ein wichtiger Trend auf dem Markt sein.
Data Fabric-Marktanalyse
Das Data Fabric bietet Datenvirtualisierung, sodass Unternehmen nahtlosen Datenzugriff implementieren und diese gleichzeitig für alle zugänglich machen können. Durch die Implementierung des Data Fabric können Geschäftsbenutzer mit minimaler IT-Beteiligung auf Daten zugreifen, was zu einer schnelleren und einfacheren Umgebung für den Datenzugriff und -austausch führt. Ein gut konzipiertes logisches Data Fabric zentralisiert die grundlegende Sicherheit und Datenverwaltung. Daher wird erwartet, dass der Data Fabric-Markt im Prognosezeitraum wachsen wird.
Branchenübersicht zum Data Fabric-Markt
Data Fabric ist ein umfassendes Datenintegrations- und -verwaltungssystem, das Architektur , Datenverwaltungs- und Integrationstools sowie gemeinsam genutzte Daten umfasst, um Unternehmen bei der Verwaltung ihrer Daten zu unterstützen. Ein Data Fabric bietet eine einheitliche, konsistente Benutzererfahrung und Echtzeit-Datenzugriff für jedes Mitglied des globalen Netzwerks einer Organisation. Data Fabric soll Unternehmen bei der Lösung komplexer Datenprobleme und Anwendungsfälle unterstützen, indem es Daten über eine Vielzahl von Anwendungen, Plattformen und Standorten hinweg verwaltet. Data Fabric bietet reibungslosen Zugriff und Datenfreigabe in einer verteilten Datenumgebung.
Passen Sie diesen Bericht Ihren Anforderungen an
Sie erhalten kostenlos individuelle Anpassungen an jedem Bericht, einschließlich Teilen dieses Berichts oder einer Analyse auf Länderebene, eines Excel-Datenpakets sowie tolle Angebote und Rabatte für Start-ups und Universitäten.
Data Fabric-Markt: Strategische Einblicke
-
Holen Sie sich die wichtigsten Markttrends aus diesem Bericht.Dieses KOSTENLOSE Beispiel umfasst eine Datenanalyse von Markttrends bis hin zu Schätzungen und Prognosen.
Treiber und Chancen auf dem Data Fabric-Markt
Steigendes Datenvolumen fördert Marktwachstum
Jede datenzentrierte Organisation erfordert einen umfassenden Ansatz, der Zeit, Raum, verschiedene Softwaretypen und Datenstandorte berücksichtigt. Daten müssen für diejenigen verfügbar sein, die sie benötigen, und dürfen nicht hinter Firewalls versteckt oder über mehrere Orte verstreut sein. Unternehmen benötigen eine sichere, effiziente, konsistente und zukunftssichere Datenlösung, um ihre Betriebseffizienz zu verbessern. Daher wird erwartet, dass die Nachfrage nach Datenstrukturen im Prognosezeitraum steigen wird.
Zunehmende Nutzung von maschinellem Lernen (ML)
ML-Algorithmen können Datenpipelines überwachen und relevante Verknüpfungen und Integrationen vorschlagen . Diese Algorithmen extrahieren Informationen aus Daten, wenn sie mit der Datenstruktur verknüpft sind, überprüfen alle Geschäftsdaten und finden relevante Verknüpfungen und Korrelationen. Die Bereitstellung von Daten ist einer der zeitaufwändigsten Aspekte beim Trainieren eines ML-Modells. Das Data Fabric-Design macht ML-Modelle effizienter, indem es die Datenaufbereitungszeit verkürzt. Es verbessert auch die Nutzbarkeit aufbereiteter Daten in verschiedenen Anwendungen und Modellen. Unternehmen verteilen Daten vor Ort, in der Cloud und im IoT . Die Datenstruktur ermöglicht eingeschränkten Zugriff auf sichere Daten und verbessert ML-Prozesse. Daher wird erwartet, dass die Anwendung von ML in Data Fabric das Marktwachstum im Prognosezeitraum ankurbeln wird.
Datenstruktur
Marktbericht-Segmentierungsanalyse
Die wichtigsten Segmente, die zur Ableitung der Data Fabric-Marktanalyse beigetragen haben, sind die Abdeckung nach Bereitstellung, Komponente, Lösung und Endbenutzer.
- Nach Bereitstellung wird der Markt in On-Premise und Cloud unterteilt. Das Cloud-Segment führte den Markt im Jahr 2023 an.
- Basierend auf den Komponenten ist der Markt in Software und Dienstleistungen unterteilt
- Basierend auf der Lösung ist der Markt in Datenermittlung, Datenaufnahme, Datenorchestrierung, Fabric-Datenzugriff, Datenmanagement und Fabric-Management unterteilt und
- Auf der Grundlage der Endverbraucher ist der Markt in BFSI, IT und Telekommunikation, Einzelhandel, Gesundheitswesen und Pharmazeutika und andere unterteilt
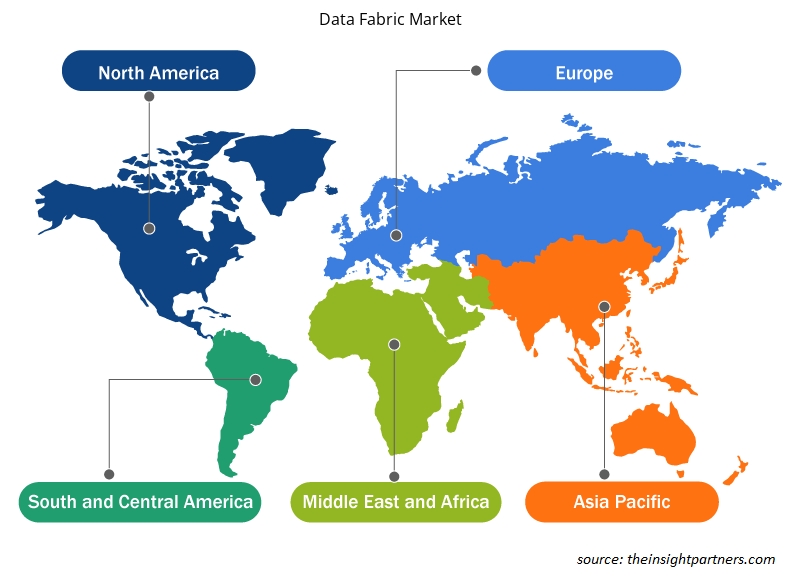
Data Fabric-Marktanteilsanalyse nach geografischer Lage
Regional ist der Markt in Nordamerika, Europa, Asien-Pazifik, Naher Osten und Afrika sowie Süd- und Mittelamerika segmentiert.
Die nordamerikanische Region hatte im Jahr 2023 einen bedeutenden Anteil am Datenstrukturmarkt und wird im Prognosezeitraum voraussichtlich mit einer beträchtlichen durchschnittlichen jährlichen Wachstumsrate wachsen. Dieses Wachstum ist auf die Präsenz zahlreicher Marktteilnehmer und die frühzeitige Einführung technologischer Neuerungen zurückzuführen. Darüber hinaus wird erwartet, dass die Region Asien-Pazifik im Prognosezeitraum mit der höchsten durchschnittlichen jährlichen Wachstumsrate wächst. Dieses Wachstum ist auf die zunehmende Anzahl von Rechenzentren und die zunehmende Digitalisierung zurückzuführen.
Regionale Einblicke in den Data Fabric-Markt
Die regionalen Trends und Faktoren, die den Data Fabric-Markt im Prognosezeitraum beeinflussen, wurden von den Analysten von Insight Partners ausführlich erläutert. In diesem Abschnitt werden auch die Segmente und Geografien des Data Fabric-Marktes in Nordamerika, Europa, im asiatisch-pazifischen Raum, im Nahen Osten und Afrika sowie in Süd- und Mittelamerika erörtert.
- Erhalten Sie regionale Daten zum Data Fabric-Markt
Umfang des Data Fabric-Marktberichts
| Berichtsattribut | Details |
|---|---|
| Marktgröße im Jahr 2023 | 2,09 Milliarden US-Dollar |
| Marktgröße bis 2031 | 10,59 Milliarden US-Dollar |
| Globale CAGR (2023 - 2031) | 22,5 % |
| Historische Daten | 2021-2022 |
| Prognosezeitraum | 2024–2031 |
| Abgedeckte Segmente |
Nach Bereitstellung
|
| Abgedeckte Regionen und Länder |
Nordamerika
|
| Marktführer und wichtige Unternehmensprofile |
|
Marktteilnehmerdichte: Der Einfluss auf die Geschäftsdynamik
Der Data Fabric-Markt wächst rasant, angetrieben durch die steigende Nachfrage der Endnutzer aufgrund von Faktoren wie sich entwickelnden Verbraucherpräferenzen, technologischen Fortschritten und einem größeren Bewusstsein für die Vorteile des Produkts. Mit steigender Nachfrage erweitern Unternehmen ihr Angebot, entwickeln Innovationen, um die Bedürfnisse der Verbraucher zu erfüllen, und nutzen neue Trends, was das Marktwachstum weiter ankurbelt.
Die Marktteilnehmerdichte bezieht sich auf die Verteilung von Firmen oder Unternehmen, die in einem bestimmten Markt oder einer bestimmten Branche tätig sind. Sie gibt an, wie viele Wettbewerber (Marktteilnehmer) in einem bestimmten Marktraum im Verhältnis zu seiner Größe oder seinem gesamten Marktwert präsent sind.
Die wichtigsten auf dem Data Fabric-Markt tätigen Unternehmen sind:
- Denodo Technologies
- IBM Corporation
- Informatica Corporation
- K2Ansicht
- NetApp, Inc.
- Oracle Corporation
Haftungsausschluss : Die oben aufgeführten Unternehmen sind nicht in einer bestimmten Reihenfolge aufgeführt.
- Überblick über die wichtigsten Akteure auf dem Data Fabric-Markt
Neuigkeiten und aktuelle Entwicklungen zum Data Fabric-Markt
Der Data Fabric-Markt wird durch die Erhebung qualitativer und quantitativer Daten nach Primär- und Sekundärforschung bewertet, die wichtige Unternehmenspublikationen, Verbandsdaten und Datenbanken umfasst. Einige der Entwicklungen auf dem Data Fabric-Markt sind unten aufgeführt:
- LigaData, ein führender Anbieter im Bereich der Telekommunikationstechnologie, revolutioniert die Telekommunikations-Datenanalysebranche mit der Einführung seiner neuen Apps LigaData Telecom Data Fabric 4.0 und LigaData Telecom AI. Diese neuen Produkte unterstützen Telekommunikations- und Kommunikationsdienstleister bei ihren Initiativen, ihre Unternehmen von traditionellen Telekommunikationsunternehmen in agile, daten- und KI-gesteuerte Technologieunternehmen umzuwandeln und gleichzeitig das Umsatzwachstum voranzutreiben, Marktanteile zu halten und das Kundenerlebnis zu verbessern. (Quelle: LigaData, Pressemitteilung, Februar 2024)
Abdeckung und Ergebnisse des Data Fabric-Marktberichts
Die Data Fabric-Marktprognose wird auf der Grundlage verschiedener sekundärer und primärer Forschungsergebnisse geschätzt, wie z. B. wichtiger Unternehmensveröffentlichungen, Verbandsdaten und Datenbanken. Der Marktbericht „Data Fabric-Marktgröße und -prognose (2021–2031)“ bietet eine detaillierte Analyse des Marktes, die die folgenden Bereiche abdeckt:
- Data Fabric-Marktgröße und -prognose auf globaler, regionaler und Länderebene für alle wichtigen Marktsegmente, die im Rahmen des Berichts abgedeckt sind
- Data Fabric-Markttrends sowie Marktdynamik wie Treiber, Einschränkungen und wichtige Chancen
- Detaillierte PEST/Porters Five Forces- und SWOT-Analyse
- Data Fabric-Marktanalyse mit wichtigen Markttrends, globalen und regionalen Rahmenbedingungen, wichtigen Akteuren, Vorschriften und aktuellen Marktentwicklungen
- Branchenlandschaft und Wettbewerbsanalyse, die die Marktkonzentration, Heatmap-Analyse, prominente Akteure und aktuelle Entwicklungen auf dem Data Fabric-Markt umfasst
- Detaillierte Firmenprofile.

Ankita ist eine dynamische Marktforschungs- und Beratungsexpertin mit über 8 Jahren Erfahrung in den Bereichen Technologie, Medien, IKT sowie Elektronik und Halbleiter. Sie hat über 100 Beratungs- und Forschungsaufträge für globale Kunden wie Microsoft, Oracle, NEC Corporation, SAP, KPMG und Expeditors International erfolgreich geleitet und durchgeführt. Zu ihren Kernkompetenzen gehören Marktbewertung, Datenanalyse, Prognose, Strategieformulierung, Wettbewerbsbeobachtung und das Verfassen von Berichten. Ankita ist versiert in der Abwicklung kompletter Projektzyklen – von der Angebotserstellung vor dem Verkauf und Kundengesprächen bis hin zur Bereitstellung umsetzbarer Erkenntnisse nach dem Verkauf. Sie ist versiert in der Leitung funktionsübergreifender Teams, der Strukturierung komplexer Forschungsmodule und der Ausrichtung von Lösungen an kundenspezifischen Geschäftszielen. Ihre ausgezeichneten Kommunikationsfähigkeiten, Führungsqualitäten und Präsentationsfähigkeiten haben es ihr ermöglicht, in einem schnelllebigen und sich entwickelnden Marktumfeld stets wertorientierte Ergebnisse zu liefern.
- Historische Analyse (2 Jahre), Basisjahr, Prognose (7 Jahre) mit CAGR
- PEST- und SWOT-Analyse
- Marktgröße Wert/Volumen – Global, Regional, Land
- Branchen- und Wettbewerbslandschaft
- Excel-Datensatz
Erfahrungsberichte
Der SCADA-Systemmarktbericht von Insight Partners ist umfassend und bietet wertvolle Einblicke in aktuelle Trends und Zukunftsprognosen. Das Team war durchweg hochprofessionell, reaktionsschnell und hilfsbereit. Wir sind sehr zufrieden und können die Dienstleistungen wärmstens empfehlen.
RAN KEDEM Partner, Reali Technologies LTDsIch habe einen Bericht über einen sehr spezifischen Softwaremarkt angefordert, und das Team hat ihn innerhalb weniger Tage erstellt. Die Informationen waren sehr relevant und gut präsentiert. Anschließend habe ich einige Änderungen und Ergänzungen zum Bericht angefordert. Das Team reagierte erneut sehr schnell, und ich erhielt den Abschlussbericht in weniger als einer Woche.
JEAN-HERVE JENN Vorsitzende, Future AnalyticaWir haben mit The Insight Partners für eine wichtige Marktstudie und Prognose zusammengearbeitet. Sie gaben uns klare Einblicke in Chancen und Risiken, die uns bei der Gestaltung unserer Pläne halfen. Ihre Recherchen waren benutzerfreundlich und basierten auf soliden Daten. Sie halfen uns, kluge und sichere Entscheidungen zu treffen. Wir können sie wärmstens empfehlen.
PIYUSH NAGPAL Sr. Vizepräsident, Fernlicht GlobalDie Insight Partners lieferten aufschlussreiche, gut strukturierte Marktforschung mit fundierter Fachkompetenz. Ihr Team war durchweg professionell und reaktionsschnell. Die benutzerfreundliche Website ermöglichte den Zugriff auf Branchenberichte. Wir empfehlen sie wärmstens für zuverlässige und hochwertige Forschungsdienstleistungen.
YUKIHIKO ADACHI Geschäftsführer, Deep Blue, LLC.Dies ist das erste Mal, dass ich einen Marktbericht von The Insight Partners erworben habe. Obwohl ich zunächst unsicher war, besuchte ich die Website und fühlte mich dann sicherer, das Risiko einzugehen und einen Marktbericht zu kaufen. Ich bin mit der Qualität des Berichts und dem Kundenservice rundum zufrieden. Ich hatte einige Fragen und Anmerkungen zum ersten Bericht, aber nach einigen E-Mail-Gesprächen mit dem Analysten bin ich überzeugt, dass ich einen Bericht habe, den ich als Input für unseren strategischen Planungsprozess verwenden kann. Vielen Dank, dass Sie sich die Zeit genommen und dies zu einer positiven Erfahrung gemacht haben. Ich werde Ihren Service auf jeden Fall weiterempfehlen und Sie werden meine erste Anlaufstelle sein, wenn wir weitere Marktdaten benötigen.
JOHN SUZUKI Präsident und Chief Executive Officer, Vorstandsmitglied, BK TechnologiesIch möchte mich für Ihre Unterstützung und die Professionalität bedanken, die Sie bei der Bearbeitung meiner Informationsanfrage zum IVD-Markt für Infektionskrankheiten in Nigeria gezeigt haben. Ich schätze Ihre Geduld, Ihre Beratung und die Tatsache, dass Sie bereit waren, einen Rabatt anzubieten, der uns schließlich den Abschluss eines Geschäfts ermöglichte. Ich freue mich darauf, The Insight Partners in Zukunft wieder zu beauftragen, dank des Eindrucks, den Sie bei dieser ersten Begegnung bei mir hinterlassen haben.
DR. CHIJIOKE ONYIA GESCHÄFTSFÜHRERIN, PineCrest Healthcare Ltd.Grund zum Kauf
- Fundierte Entscheidungsfindung
- Marktdynamik verstehen
- Wettbewerbsanalyse
- Kundeneinblicke
- Marktprognosen
- Risikominimierung
- Strategische Planung
- Investitionsbegründung
- Identifizierung neuer Märkte
- Verbesserung von Marketingstrategien
- Steigerung der Betriebseffizienz
- Anpassung an regulatorische Trends


Exklusive Berichtsrabatte freischalten
Jetzt anfragen


 Kostenlose Probe anfordern für - Data Fabric-Markt