
Marktübersicht, Wachstum, Trends, Analyse, Forschungsbericht zur G Suite-Geschäftssoftware (2023-2031)
Marktgröße und Prognose für G Suite-Unternehmenssoftware (2021 – 2031), Bericht über globale und regionale Anteile, Trends und Wachstumschancenanalyse: Nach Typ (Verwaltungssoftware, ERP-Software, Finanzsoftware, HR-Software, Sonstige); Endbenutzer (Einzelperson, Unternehmen, Sonstige) und Geografie
- Status : Veröffentlichte Daten
- Berichtscode : TIPRE00013586
- Kategorie : Technologie, Medien und Telekommunikation
- Anzahl der Seiten : 150
- Verfügbare Berichtsformate :


- Datum der letzten Aktualisierung : August 21, 2024

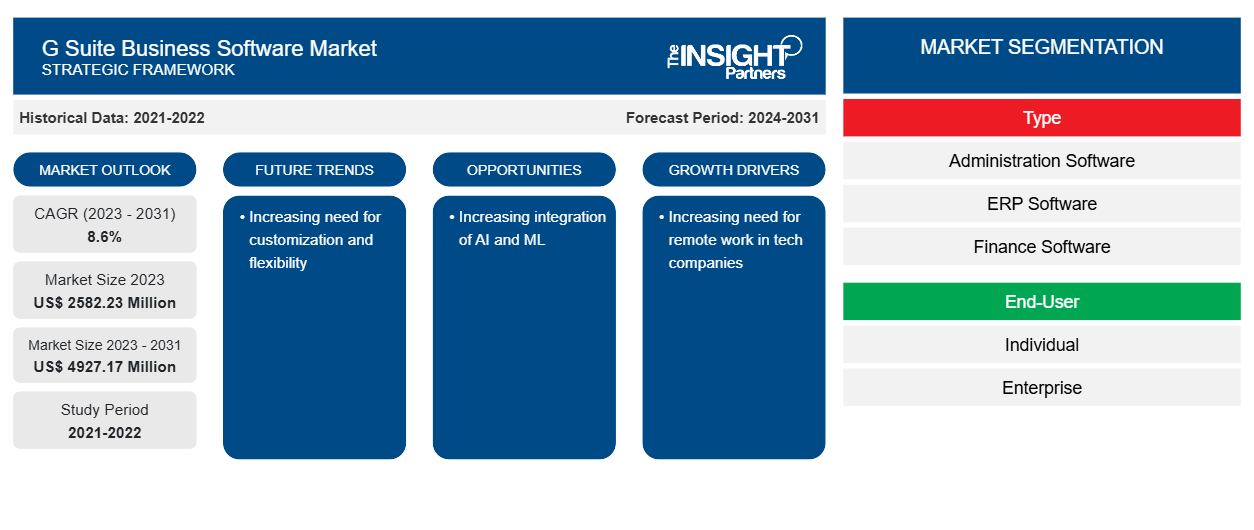
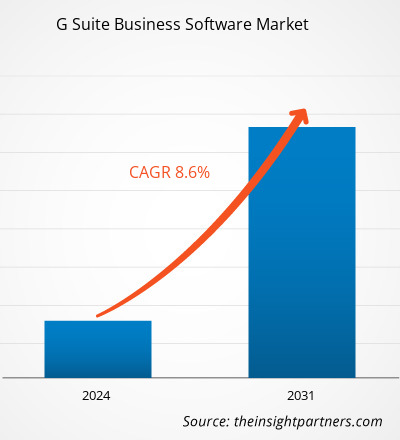
Der Markt für G Suite-Geschäftssoftware soll von 2582,23 Millionen US-Dollar im Jahr 2023 auf 4927,17 Millionen US-Dollar im Jahr 2031 anwachsen. Der Markt soll zwischen 2023 und 2031 eine durchschnittliche jährliche Wachstumsrate (CAGR) von 8,6 % verzeichnen. Der zunehmende Bedarf an Anpassung und Flexibilität dürfte ein wichtiger Trend auf dem Markt bleiben.
Marktanalyse für G Suite-Unternehmenssoftware
Mit G Suite können Unternehmen und Organisationen Googles Suite mit cloudbasierten Produktivitäts- und Kollaborationstools am Ende ihrer Geschäftsprozesse nutzen. Verschiedene Drittanbieter und Lösungsanbieter bieten überlegene Governance und Verwaltung von G Suite-Lösungen basierend auf den Anforderungen der Unternehmen. Calendly bietet eine Lösung für die G Suite, die nahtlos mit Google Kalender zusammenarbeitet, um alle Buchungen und terminbezogenen Aktivitäten zu verwalten. Mixmax bietet Kalenderlösungen und eine E-Mail-Produktivitätsplattform für Vertrieb, Kundenerfolg, Personalbeschaffung, Vertriebsabläufe, Führung und Unternehmer. Drittanbieter bieten zusätzliche Tools für die G Suite, die die Produktivität und Verwaltbarkeit von Unternehmen verbessern und Kunden maßgeschneiderte Anforderungen bieten.
Marktübersicht zur G Suite-Geschäftssoftware
G Suite ist eine von Google entwickelte und betriebene Software-as-a-Service-Suite (SaaS). Diese Cloud-basierten Apps konzentrieren sich auf verschiedene Bereiche wie Business, Zusammenarbeit, Produktivität und Bildung. Gmail, Docs, Sheets, Drive, Kalender, Google+, Präsentationen, Formulare, Sites, Hangouts und Keep sind die wichtigsten von Google verfügbaren G-Suite-Tools. G Suite ist eine wertvolle Ressource für Unternehmen und Privatpersonen weltweit.
Passen Sie diesen Bericht Ihren Anforderungen an
Sie erhalten kostenlos individuelle Anpassungen an jedem Bericht, einschließlich Teilen dieses Berichts oder einer Analyse auf Länderebene, eines Excel-Datenpakets sowie tolle Angebote und Rabatte für Start-ups und Universitäten.
Markt für G Suite-Unternehmenssoftware: Strategische Einblicke
-
Holen Sie sich die wichtigsten Markttrends aus diesem Bericht.Dieses KOSTENLOSE Beispiel umfasst eine Datenanalyse von Markttrends bis hin zu Schätzungen und Prognosen.
Treiber und Chancen auf dem Markt für G Suite-Unternehmenssoftware
Steigender Bedarf an Remote-Arbeit in Technologieunternehmen
Arbeitgeber interessieren sich zunehmend für Stellen bei Unternehmen, die Remote- oder Hybrid-Arbeitsmodelle anbieten, und immer mehr Arbeitgeber erkennen diesen Trend. Ein Bericht der Jobbörse FlexJobs.com ergab, dass die Zahl der Stellenausschreibungen für Remote-Arbeitsplätze zwischen 2021 und 2022 von 12 % im Vorjahr auf 12 % gestiegen ist. Die Popularität der Remote-Arbeit ist zu einem wichtigen Faktor geworden und wird wahrscheinlich weiter steigen, da die Arbeitgeber ihre Beschäftigungsrichtlinien für die Arbeit von zu Hause aus verfeinern. Daher treibt der steigende Bedarf an Remote-Arbeit in Technologieunternehmen den Markt für G Suite-Geschäftssoftware an.FlexJobs.com revealed that listings for remote positions rose from 12% the previous year to 12%. The popularity of remote work has become a major factor and is likely to rise as employers refine their employment policies on working from home. Therefore, the increasing pen need for remote work in tech companies is driving the G suite business software market.
Zunehmende Integration von KI
Mithilfe von KI und ML fügt G Suite Sicherheitstools hinzu. Verschiedene Unternehmen setzen G Suite-Geschäftssoftware mit KI- und ML-Technologien ein. So kündigte der Suchgigant im Jahr 2020 mehrere Updates für G Suite unter Verwendung von KI an, dessen App-Set Google Docs und Sheets ähnelt, aber auf das Büro zugeschnitten ist. Das Unternehmen kündigte dies während seiner jährlichen Google Cloud Next-Konferenz in San Francisco an. Daher schafft die zunehmende Integration von KI in die G Suite-Geschäftssoftware mehr Möglichkeiten für den Markt.deployoing G suite business software with AI and ML technologies. For instance, in 2020, the search giant announced several updates to G Suite by using AI, its set of apps that resemble Google Docs and Sheets but are tailored for the office. The company announced this during its annual Google Cloud Next conference in San Francisco. Therefore, the increasing integration of AI with G Suite business software is creating more opportunities for the market.
Marktbericht zur G Suite-Geschäftssoftware – Segmentierungsanalyse
Schlüsselsegmente, die zur Ableitung der Marktanalyse der G-Suite-Geschäftssoftware beigetragen haben, sind Typ und Endbenutzer.
- Basierend auf dem Typ ist der Markt für G-Suite-Geschäftssoftware in Verwaltungssoftware, ERP-Software, Finanzsoftware, HR-Software und andere unterteilt. Das kundenspezifische Segment hatte im Jahr 2023 einen größeren Marktanteil.ERP software, finance software, HR software, and others. The customized segment held a larger market share in 2023.
- Nach Endbenutzern ist der Markt in Einzelpersonen, Unternehmen und Sonstige segmentiert.
Marktanteilsanalyse für die G Suite-Geschäftssoftware nach geografischer Lage
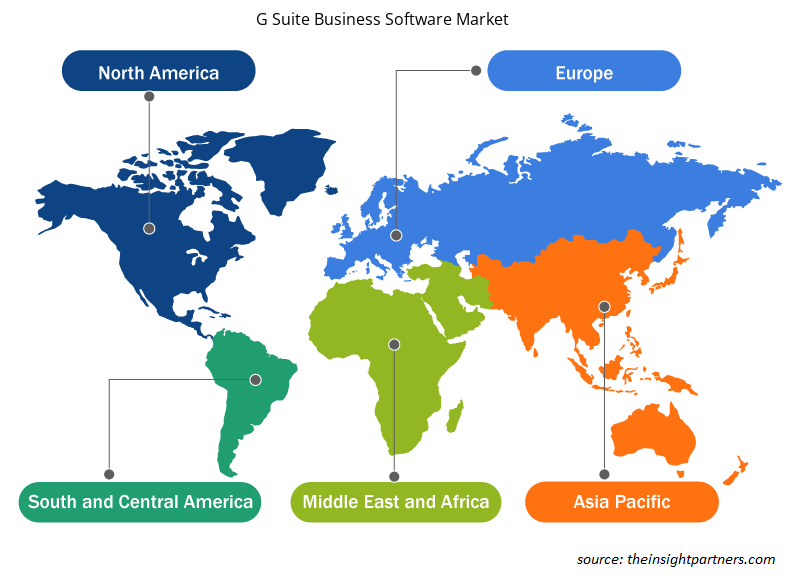
Der geografische Umfang des Marktberichts zur G-Suite-Geschäftssoftware ist hauptsächlich in fünf Regionen unterteilt: Nordamerika, Asien-Pazifik, Europa, Naher Osten und Afrika sowie Süd- und Mittelamerika.
APAC dominiert den Markt für G Suite-Geschäftssoftware. Der Markt für G Suite-Geschäftssoftware in dieser Region wächst aufgrund verschiedener Faktoren, wie z. B. zunehmender Initiativen von Organisationen zur Verbesserung ihrer Sicherheit und der Präsenz etablierter Anbieter von G Suite- dominates the G Suite business software market. The G suite business software market in this region is growing due to various factors, such as increasing organizations' initiatives to improve their security and the presence of well-established G suite business Geschäftssoftware .
Regionale Einblicke in den Markt für G Suite-Unternehmenssoftware
Die regionalen Trends und Faktoren, die den Markt für G Suite-Geschäftssoftware im Prognosezeitraum beeinflussen, wurden von den Analysten von Insight Partners ausführlich erläutert. In diesem Abschnitt werden auch die Marktsegmente und die Geografie der G Suite-Geschäftssoftware in Nordamerika, Europa, im asiatisch-pazifischen Raum, im Nahen Osten und Afrika sowie in Süd- und Mittelamerika erörtert.
- Regionalspezifische Daten zum Markt für G Suite-Unternehmenssoftware abrufen
Umfang des Marktberichts zur G Suite-Geschäftssoftware
| Berichtsattribut | Details |
|---|---|
| Marktgröße im Jahr 2023 | 2582,23 Millionen US-Dollar |
| Marktgröße bis 2031 | 4927,17 Millionen US-Dollar |
| Globale CAGR (2023 - 2031) | 8,6 % |
| Historische Daten | 2021-2022 |
| Prognosezeitraum | 2024–2031 |
| Abgedeckte Segmente |
Nach Typ
|
| Abgedeckte Regionen und Länder |
Nordamerika
|
| Marktführer und wichtige Unternehmensprofile |
|
Dichte der Marktteilnehmer für G Suite-Unternehmenssoftware: Die Auswirkungen auf die Geschäftsdynamik verstehen
Der Markt für G Suite-Geschäftssoftware wächst rasant. Dies wird durch die steigende Nachfrage der Endnutzer aufgrund von Faktoren wie sich entwickelnden Verbraucherpräferenzen, technologischen Fortschritten und einem größeren Bewusstsein für die Vorteile des Produkts vorangetrieben. Mit der steigenden Nachfrage erweitern Unternehmen ihr Angebot, entwickeln Innovationen, um die Bedürfnisse der Verbraucher zu erfüllen, und nutzen neue Trends, was das Marktwachstum weiter ankurbelt.
Die Marktteilnehmerdichte bezieht sich auf die Verteilung von Firmen oder Unternehmen, die in einem bestimmten Markt oder einer bestimmten Branche tätig sind. Sie gibt an, wie viele Wettbewerber (Marktteilnehmer) in einem bestimmten Marktraum im Verhältnis zu seiner Größe oder seinem gesamten Marktwert präsent sind.
Die wichtigsten Unternehmen auf dem Markt für G Suite-Unternehmenssoftware sind:
- RILLE
- MAILTRACK.IO
- Calendly
- NetHunt Inc.
- Mixmax
- Salesforce.com Inc.
Haftungsausschluss : Die oben aufgeführten Unternehmen sind nicht in einer bestimmten Reihenfolge aufgeführt.
- Überblick über die wichtigsten Akteure auf dem Markt für G Suite-Unternehmenssoftware
Neuigkeiten und aktuelle Entwicklungen zum Markt für G Suite-Unternehmenssoftware
Der Markt für G-Suite-Geschäftssoftware wird durch die Erfassung qualitativer und quantitativer Daten nach Primär- und Sekundärforschung bewertet, die wichtige Unternehmenspublikationen, Verbandsdaten und Datenbanken umfasst. Nachfolgend sind einige der Entwicklungen auf dem Markt für G-Suite-Geschäftssoftware aufgeführt:
- Google hat die G Suite umbenannt. Dabei handelt es sich um eine Reihe von Online-Produktivitäts- und Kollaborationstools für Unternehmen, zu denen unter anderem Gmail, Drive, Docs und Meet gehören. Der neue Name lautet Google Workspace, ein Name, den das Unternehmen bereits angedeutet hat, als es Anfang des Jahres erstmals eine Reihe neuer Kollaborationstools und Google Meet-Integrationen für den Dienst vorstellte. (Quelle: Google, Pressemitteilung, Oktober 2020)
- Googles G Suite hat neue KI- und Sicherheitstools hinzugefügt. Der Suchriese kündigte mehrere Updates für die G Suite an, seine App-Reihe, die Google Docs und Sheets ähnelt, aber auf das Büro zugeschnitten ist. (Quelle: Tungsram Group, Pressemitteilung, Juli 2021)
Marktbericht zur Unternehmenssoftware G Suite – Abdeckung und Ergebnisse
Der Bericht „Marktgröße und Prognose für G Suite-Unternehmenssoftware (2021–2031)“ bietet eine detaillierte Analyse des Marktes, die die folgenden Bereiche abdeckt:
- Marktgröße und Prognose für G Suite-Geschäftssoftware auf globaler, regionaler und Länderebene für alle wichtigen Marktsegmente, die im Rahmen des Berichts abgedeckt sind
- Markttrends für G Suite-Geschäftssoftware sowie Marktdynamik wie Treiber, Einschränkungen und wichtige Chancen
- Detaillierte PEST/Porters Five Forces- und SWOT-Analyse
- Marktanalyse für G Suite-Geschäftssoftware mit wichtigen Markttrends, globalen und regionalen Rahmenbedingungen, wichtigen Akteuren, Vorschriften und aktuellen Marktentwicklungen
- Branchenlandschaft und Wettbewerbsanalyse, einschließlich Marktkonzentration, Heatmap-Analyse, prominenten Akteuren und aktuellen Entwicklungen für den Markt für G-Suite-Geschäftssoftware
- Detaillierte Firmenprofile

Ankita ist eine dynamische Marktforschungs- und Beratungsexpertin mit über 8 Jahren Erfahrung in den Bereichen Technologie, Medien, IKT sowie Elektronik und Halbleiter. Sie hat über 100 Beratungs- und Forschungsaufträge für globale Kunden wie Microsoft, Oracle, NEC Corporation, SAP, KPMG und Expeditors International erfolgreich geleitet und durchgeführt. Zu ihren Kernkompetenzen gehören Marktbewertung, Datenanalyse, Prognose, Strategieformulierung, Wettbewerbsbeobachtung und das Verfassen von Berichten. Ankita ist versiert in der Abwicklung kompletter Projektzyklen – von der Angebotserstellung vor dem Verkauf und Kundengesprächen bis hin zur Bereitstellung umsetzbarer Erkenntnisse nach dem Verkauf. Sie ist versiert in der Leitung funktionsübergreifender Teams, der Strukturierung komplexer Forschungsmodule und der Ausrichtung von Lösungen an kundenspezifischen Geschäftszielen. Ihre ausgezeichneten Kommunikationsfähigkeiten, Führungsqualitäten und Präsentationsfähigkeiten haben es ihr ermöglicht, in einem schnelllebigen und sich entwickelnden Marktumfeld stets wertorientierte Ergebnisse zu liefern.
- Umfassende Analyse der Marktgröße und Prognosen
- Detaillierte Segmentierungsanalyse
- Tiefgehende Bewertung der Marktdynamik
- Einblicke auf regionaler und nationaler Ebene
- Wettbewerbslandschaft und Unternehmens-Benchmarking
- Strategische Business Intelligence
Erfahrungsberichte
Der SCADA-Systemmarktbericht von Insight Partners ist umfassend und bietet wertvolle Einblicke in aktuelle Trends und Zukunftsprognosen. Das Team war durchweg hochprofessionell, reaktionsschnell und hilfsbereit. Wir sind sehr zufrieden und können die Dienstleistungen wärmstens empfehlen.
RAN KEDEM Partner, Reali Technologies LTDsIch habe einen Bericht über einen sehr spezifischen Softwaremarkt angefordert, und das Team hat ihn innerhalb weniger Tage erstellt. Die Informationen waren sehr relevant und gut präsentiert. Anschließend habe ich einige Änderungen und Ergänzungen zum Bericht angefordert. Das Team reagierte erneut sehr schnell, und ich erhielt den Abschlussbericht in weniger als einer Woche.
JEAN-HERVE JENN Vorsitzende, Future AnalyticaWir haben mit The Insight Partners für eine wichtige Marktstudie und Prognose zusammengearbeitet. Sie gaben uns klare Einblicke in Chancen und Risiken, die uns bei der Gestaltung unserer Pläne halfen. Ihre Recherchen waren benutzerfreundlich und basierten auf soliden Daten. Sie halfen uns, kluge und sichere Entscheidungen zu treffen. Wir können sie wärmstens empfehlen.
PIYUSH NAGPAL Sr. Vizepräsident, Fernlicht GlobalDie Insight Partners lieferten aufschlussreiche, gut strukturierte Marktforschung mit fundierter Fachkompetenz. Ihr Team war durchweg professionell und reaktionsschnell. Die benutzerfreundliche Website ermöglichte den Zugriff auf Branchenberichte. Wir empfehlen sie wärmstens für zuverlässige und hochwertige Forschungsdienstleistungen.
YUKIHIKO ADACHI Geschäftsführer, Deep Blue, LLC.Dies ist das erste Mal, dass ich einen Marktbericht von The Insight Partners erworben habe. Obwohl ich zunächst unsicher war, besuchte ich die Website und fühlte mich dann sicherer, das Risiko einzugehen und einen Marktbericht zu kaufen. Ich bin mit der Qualität des Berichts und dem Kundenservice rundum zufrieden. Ich hatte einige Fragen und Anmerkungen zum ersten Bericht, aber nach einigen E-Mail-Gesprächen mit dem Analysten bin ich überzeugt, dass ich einen Bericht habe, den ich als Input für unseren strategischen Planungsprozess verwenden kann. Vielen Dank, dass Sie sich die Zeit genommen und dies zu einer positiven Erfahrung gemacht haben. Ich werde Ihren Service auf jeden Fall weiterempfehlen und Sie werden meine erste Anlaufstelle sein, wenn wir weitere Marktdaten benötigen.
JOHN SUZUKI Präsident und Chief Executive Officer, Vorstandsmitglied, BK TechnologiesIch möchte mich für Ihre Unterstützung und die Professionalität bedanken, die Sie bei der Bearbeitung meiner Informationsanfrage zum IVD-Markt für Infektionskrankheiten in Nigeria gezeigt haben. Ich schätze Ihre Geduld, Ihre Beratung und die Tatsache, dass Sie bereit waren, einen Rabatt anzubieten, der uns schließlich den Abschluss eines Geschäfts ermöglichte. Ich freue mich darauf, The Insight Partners in Zukunft wieder zu beauftragen, dank des Eindrucks, den Sie bei dieser ersten Begegnung bei mir hinterlassen haben.
DR. CHIJIOKE ONYIA GESCHÄFTSFÜHRERIN, PineCrest Healthcare Ltd.Grund zum Kauf
- Fundierte Entscheidungsfindung
- Marktdynamik verstehen
- Wettbewerbsanalyse
- Kundeneinblicke
- Marktprognosen
- Risikominimierung
- Strategische Planung
- Investitionsbegründung
- Identifizierung neuer Märkte
- Verbesserung von Marketingstrategien
- Steigerung der Betriebseffizienz
- Anpassung an regulatorische Trends


