Marktwachstum, Größe, Anteil, Trends, Analyse der wichtigsten Akteure und Prognose für Stromqualitätsgeräte bis 2031
Historische Daten : 2021-2022 | Basisjahr : 2023 | Prognosezeitraum : 2024-2031Marktgröße und Prognose für Stromqualitätsgeräte (2021 – 2031), Berichtsabdeckung für globale und regionale Anteils-, Trend- und Wachstumschancenanalyse: Nach Geräten (unterbrechungsfreie Stromversorgung (USV), Oberschwingungsfilter, statischer Blindleistungskompensator, Stromqualitätsmessgeräte, Sonstiges), Phase (einphasig, dreiphasig), Endbenutzer (Industrie und Fertigung, Gewerbe und Sonstiges) und Geografie
- Status : Veröffentlichte Daten
- Berichtscode : TIPRE00023328
- Kategorie : Elektronik und Halbleiter
- Anzahl der Seiten : 150
- Verfügbare Berichtsformate :


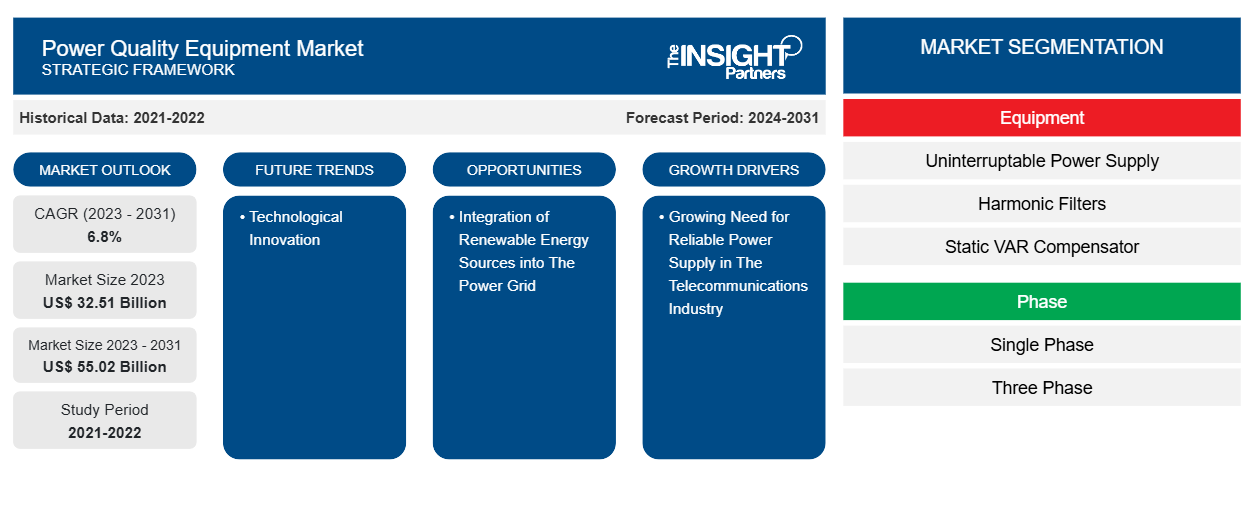
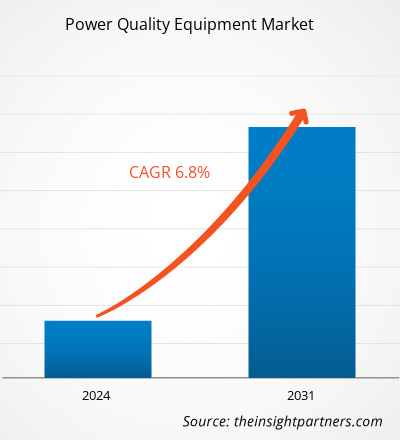
Der Markt für Stromqualitätsausrüstungen soll von 32,51 Milliarden US-Dollar im Jahr 2023 auf 55,02 Milliarden US-Dollar im Jahr 2031 anwachsen. Der Markt wird zwischen 2023 und 2031 voraussichtlich eine durchschnittliche jährliche Wachstumsrate (CAGR) von 6,8 % verzeichnen. Technologische Innovationen werden voraussichtlich weiterhin ein wichtiger Trend auf dem Markt bleiben.
Marktanalyse für Stromqualitätsgeräte
Der weltweite Strombedarf steigt aufgrund des rasanten Wachstums der verarbeitenden und produzierenden Industrie. Der Anstieg des Stromverbrauchs wird auch durch die Branchen Transport, Gesundheitswesen, Wirtschaft und Wohnen vorangetrieben. Das Bevölkerungswachstum, höhere verfügbare Einkommen und die zunehmende Digitalisierung im asiatisch-pazifischen Raum führen dazu, dass Verbraucher zunehmend lieber online kaufen und bezahlen.
Marktübersicht für Stromqualitätsgeräte
Verschiedene Regierungen in der Region fördern die Entwicklung ihrer Fertigungssektoren. So hat die indische Regierung beispielsweise das Programm „Make in India“ ins Leben gerufen, um sowohl nationale als auch internationale Unternehmen zu ermutigen, ihre Fertigungsanlagen in Indien zu errichten und die Fertigungsinfrastruktur des Landes zu verbessern. Auf die gleiche Weise hat die chinesische Regierung den Plan „Made in China 2025“ umgesetzt, um die Fertigungsindustrie des Landes zu verbessern und sich als weltweit führender Markt zu positionieren. Die genannten Trends führen zu einer zunehmenden Verwendung von Geräten zur Stromqualität, um eine stabile Stromversorgung in der Industrie aufrechtzuerhalten und die Hardware letztendlich vor Schäden durch Stromschwankungen zu schützen. Darüber hinaus wird die steigende Nachfrage nach Geräten zur Stromqualität durch das kontinuierliche Wachstum der verarbeitenden Industrie gestärkt, das durch den erhöhten Bedarf an schnelldrehenden Konsumgütern angetrieben wird.
Passen Sie diesen Bericht Ihren Anforderungen an
Sie erhalten kostenlos individuelle Anpassungen an jedem Bericht, einschließlich Teilen dieses Berichts oder einer Analyse auf Länderebene, eines Excel-Datenpakets sowie tolle Angebote und Rabatte für Start-ups und Universitäten.
Markt für Stromqualitätsgeräte: Strategische Einblicke
-
Holen Sie sich die wichtigsten Markttrends aus diesem Bericht.Dieses KOSTENLOSE Beispiel umfasst eine Datenanalyse von Markttrends bis hin zu Schätzungen und Prognosen.
Treiber und Chancen auf dem Markt für Stromqualitätsausrüstung
Wachsender Bedarf an zuverlässiger Stromversorgung in der Telekommunikationsbranche treibt das Marktwachstum voran
Die Telekommunikationsinfrastruktur hat sich in den letzten Jahren rasant entwickelt. Diese moderne Telekommunikationsinfrastruktur umfasst verbesserte Systeme wie Rechenzentren, Server und internetbezogene Infrastruktur sowie Geräte zur effizienten Bereitstellung von Sprach- und Datenübertragungsdiensten. Dennoch sind moderne Kommunikationssysteme anfälliger für Stromprobleme, da die für die Datenübertragung verwendeten elektronischen Komponenten anfälliger für Spannungseinbrüche, Spannungsspitzen, Transienten und Oberwellen sind. Ein Telekommunikationsgerät kann durch Stromschwankungen aufgrund plötzlicher Lastanstiege gestört werden, wie z. B. Spannungseinbrüche und -spitzen, die durch Kurzschlüsse, lose Verbindungen, Fehler und das Starten von Motoren verursacht werden. Diese Szenarien führen zu Kommunikationsstörungen und finanziellen Verlusten für Telekommunikationsunternehmen sowie zu potenziellen Gerätestörungen und -ausfällen. Um dieses Hindernis zu überwinden, implementieren Telekommunikationsunternehmen Geräte zur Stromqualität, um eine konstante Spannungsversorgung innerhalb eines bestimmten Bereichs aufrechtzuerhalten.
Einbindung erneuerbarer Energiequellen in das Stromnetz
Die erfolgreiche Integration erneuerbarer Energien hängt in hohem Maße von der Aufrechterhaltung einer hohen Stromqualität ab. Eine zentrale Herausforderung in diesem Zusammenhang ist das Auftreten von Spannungs- und Frequenzschwankungen, die sich aus der Unberechenbarkeit erneuerbarer Energiequellen ergeben . Der Einsatz von Leistungselektronikgeräten bei der Erzeugung erneuerbarer Energien trägt ebenfalls zu Problemen mit der Stromqualität bei, einschließlich der Entstehung von Oberschwingungen. Daher bestehen optimistische Aussichten für die Expansion des Marktes für Stromqualitätsgeräte, da diese eine wichtige Rolle bei der Vermeidung von Fehlfunktionen elektrischer Geräte aufgrund von Lastungleichgewichten spielen. Darüber hinaus hat die Lebensmittel- und Getränkeindustrie in den letzten Jahren ein erhebliches Wachstum verzeichnet. Faktoren wie zunehmende Gesundheitsbedenken, Urbanisierung und globale Regierungsinitiativen haben die wachsende Beliebtheit von sowohl verpackten Lebensmitteln als auch Milchprodukten vorangetrieben.
Marktbericht zur Stromqualitätsausrüstung – Segmentierungsanalyse
Wichtige Segmente, die zur Ableitung der Marktanalyse für Stromqualitätsgeräte beigetragen haben, sind Ausrüstung, Phase und Endbenutzer.
- Basierend auf der Ausrüstung ist der Markt in unterbrechungsfreie Stromversorgung (USV), Oberwellenfilter, statische VAR-Kompensatoren, Stromqualitätsmessgeräte und andere segmentiert. Das Segment der unterbrechungsfreien Stromversorgung (USV) hatte im Jahr 2023 einen bedeutenden Marktanteil.uninterruptable power supply (UPS), harmonic filters, static VAR compensators, power quality meters, and others. The uninterruptable power supply (UPS) segment held a significant market share in 2023.
- In Bezug auf die Phasen ist der Markt in einen einphasigen und einen dreiphasigen Markt unterteilt. Das einphasige Segment hielt im Jahr 2023 einen erheblichen Marktanteil.
- Basierend auf den Endverbrauchern ist der Markt in Industrie und Fertigung, Gewerbe und Sonstiges segmentiert. Das Segment Industrie und Fertigung hielt im Jahr 2023 einen bedeutenden Marktanteil.
Marktanteilsanalyse für Stromqualitätsgeräte nach geografischer Lage
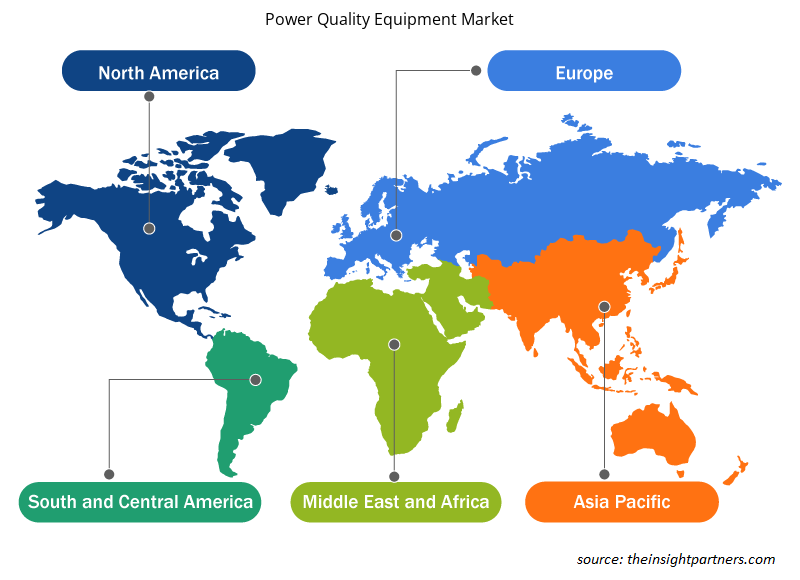
Der geografische Umfang des Marktberichts zu Stromqualitätsgeräten ist in fünf Regionen unterteilt: Nordamerika, Asien-Pazifik, Europa, Naher Osten und Afrika sowie Süd- und Mittelamerika.
Im asiatisch-pazifischen Raum ist die Fertigungsindustrie für die Ankurbelung der Wirtschaft vieler Länder von entscheidender Bedeutung, wobei China den größten Beitrag zur weltweiten Fertigungsproduktion leistet. Japan, Indien, Südkorea und Indonesien leisten ebenfalls einen bedeutenden Beitrag zur Region. Gleichzeitig wird erwartet, dass Vietnam, Malaysia und Singapur ihre Marktpräsenz in dieser Branche in den kommenden Jahren ausbauen werden. Dies unterstreicht die Vielfalt der Fertigungsaktivitäten im asiatisch-pazifischen Raum und beeinflusst den Bedarf an Stromqualitätsgeräten.
Regionale Einblicke in den Markt für Stromqualitätsgeräte
Die regionalen Trends und Faktoren, die den Markt für Stromqualitätsausrüstung während des gesamten Prognosezeitraums beeinflussen, wurden von den Analysten von Insight Partners ausführlich erläutert. In diesem Abschnitt werden auch Marktsegmente und Geografien für Stromqualitätsausrüstung in Nordamerika, Europa, im asiatisch-pazifischen Raum, im Nahen Osten und Afrika sowie in Süd- und Mittelamerika erörtert.
- Erhalten Sie regionale Daten zum Markt für Stromqualitätsgeräte
Umfang des Marktberichts zu Stromqualitätsgeräten
| Berichtsattribut | Details |
|---|---|
| Marktgröße im Jahr 2023 | 32,51 Milliarden US-Dollar |
| Marktgröße bis 2031 | 55,02 Milliarden US-Dollar |
| Globale CAGR (2023 - 2031) | 6,8 % |
| Historische Daten | 2021-2022 |
| Prognosezeitraum | 2024–2031 |
| Abgedeckte Segmente |
Nach Ausrüstung
|
| Abgedeckte Regionen und Länder |
Nordamerika
|
| Marktführer und wichtige Unternehmensprofile |
|
Dichte der Marktteilnehmer für Stromqualitätsausrüstung: Verständnis ihrer Auswirkungen auf die Geschäftsdynamik
Der Markt für Stromqualitätsausrüstung wächst rasant, angetrieben durch die steigende Nachfrage der Endnutzer aufgrund von Faktoren wie sich entwickelnden Verbraucherpräferenzen, technologischen Fortschritten und einem größeren Bewusstsein für die Vorteile des Produkts. Mit steigender Nachfrage erweitern Unternehmen ihr Angebot, entwickeln Innovationen, um die Bedürfnisse der Verbraucher zu erfüllen, und nutzen neue Trends, was das Marktwachstum weiter ankurbelt.
Die Marktteilnehmerdichte bezieht sich auf die Verteilung der Firmen oder Unternehmen, die in einem bestimmten Markt oder einer bestimmten Branche tätig sind. Sie gibt an, wie viele Wettbewerber (Marktteilnehmer) in einem bestimmten Marktraum im Verhältnis zu seiner Größe oder seinem gesamten Marktwert präsent sind.
Die wichtigsten auf dem Markt für Stromqualitätsgeräte tätigen Unternehmen sind:
- Akumentrik
- Emerson Electric Co.
- AMETEK Inc.
- Eaton
- Allgemeine Elektrizit?tsgesellschaft
- Schneider Electric SE
Haftungsausschluss : Die oben aufgeführten Unternehmen sind nicht in einer bestimmten Reihenfolge aufgeführt.
- Überblick über die wichtigsten Akteure auf dem Markt für Stromqualitätsausrüstung
Neuigkeiten und aktuelle Entwicklungen zum Markt für Stromqualitätsausrüstung
Der Markt für Stromqualitätsgeräte wird durch die Erhebung qualitativer und quantitativer Daten aus Primär- und Sekundärforschung bewertet, die wichtige Unternehmensveröffentlichungen, Verbandsdaten und Datenbanken umfasst. Nachfolgend sind einige der Entwicklungen auf dem Markt für Stromqualitätsgeräte aufgeführt:
- Das Energiemanagementunternehmen Eaton (NYSE: ETN) gab heute bekannt, dass es die Übernahme von Tripp Lite abgeschlossen hat. Tripp Lite mit Sitz in Chicago, Illinois, ist ein führender Anbieter von Stromqualitätsprodukten und Konnektivitätslösungen, darunter einphasige unterbrechungsfreie Stromversorgungssysteme, Rack-Stromverteilungseinheiten, Überspannungsschutz und Gehäuse für Rechenzentren sowie die Industrie-, Medizin- und Kommunikationsmärkte in Nord- und Südamerika.
(Quelle: Eaton, Pressemitteilung, März 2021)
Marktbericht zu Stromqualitätsausrüstung – Abdeckung und Ergebnisse
Der Bericht „Marktgröße und Prognose für Stromqualitätsgeräte (2021–2031)“ bietet eine detaillierte Analyse des Marktes, die die folgenden Bereiche abdeckt:
- Marktgröße und Prognose für Stromqualitätsgeräte auf globaler, regionaler und Länderebene für alle wichtigen Marktsegmente, die im Rahmen des Berichts abgedeckt sind
- Markttrends und Marktdynamiken für Stromqualitätsgeräte wie Treiber, Einschränkungen und wichtige Chancen
- Detaillierte PEST/Porters Five Forces- und SWOT-Analyse
- Marktanalyse für Netzqualitätsausrüstung, die wichtige Markttrends, globale und regionale Rahmenbedingungen, wichtige Akteure, Vorschriften und aktuelle Marktentwicklungen umfasst
- Branchenlandschaft und Wettbewerbsanalyse, die die Marktkonzentration, Heatmap-Analyse, prominente Akteure und aktuelle Entwicklungen auf dem Markt für Stromqualitätsgeräte umfasst
- Detaillierte Firmenprofile

Naveen ist ein erfahrener Marktforschungs- und Beratungsexperte mit über 9 Jahren Erfahrung in kundenspezifischen, syndizierten und Beratungsprojekten. In seiner aktuellen Funktion als Associate Vice President hat er erfolgreich Stakeholder entlang der gesamten Projektwertschöpfungskette gemanagt und ist Autor von über 100 Forschungsberichten und über 30 Beratungsaufträgen. Seine Arbeit erstreckt sich auf Industrie- und Regierungsprojekte und trägt maßgeblich zum Kundenerfolg und zur datengesteuerten Entscheidungsfindung bei.
Naveen hat einen Ingenieursabschluss in Elektronik und Kommunikation von der VTU, Karnataka, und einen MBA in Marketing und Operations von der Manipal University. Er ist seit 9 Jahren aktives IEEE-Mitglied und nimmt an Konferenzen und technischen Symposien teil und engagiert sich ehrenamtlich auf Sektions- und regionaler Ebene. Vor seiner aktuellen Position arbeitete er als Associate Strategic Consultant bei IndustryARC und als Industrial Server Consultant bei Hewlett Packard (HP Global).
- Historische Analyse (2 Jahre), Basisjahr, Prognose (7 Jahre) mit CAGR
- PEST- und SWOT-Analyse
- Marktgröße Wert/Volumen – Global, Regional, Land
- Branchen- und Wettbewerbslandschaft
- Excel-Datensatz
Erfahrungsberichte
Der SCADA-Systemmarktbericht von Insight Partners ist umfassend und bietet wertvolle Einblicke in aktuelle Trends und Zukunftsprognosen. Das Team war durchweg hochprofessionell, reaktionsschnell und hilfsbereit. Wir sind sehr zufrieden und können die Dienstleistungen wärmstens empfehlen.
RAN KEDEM Partner, Reali Technologies LTDsIch habe einen Bericht über einen sehr spezifischen Softwaremarkt angefordert, und das Team hat ihn innerhalb weniger Tage erstellt. Die Informationen waren sehr relevant und gut präsentiert. Anschließend habe ich einige Änderungen und Ergänzungen zum Bericht angefordert. Das Team reagierte erneut sehr schnell, und ich erhielt den Abschlussbericht in weniger als einer Woche.
JEAN-HERVE JENN Vorsitzende, Future AnalyticaWir haben mit The Insight Partners für eine wichtige Marktstudie und Prognose zusammengearbeitet. Sie gaben uns klare Einblicke in Chancen und Risiken, die uns bei der Gestaltung unserer Pläne halfen. Ihre Recherchen waren benutzerfreundlich und basierten auf soliden Daten. Sie halfen uns, kluge und sichere Entscheidungen zu treffen. Wir können sie wärmstens empfehlen.
PIYUSH NAGPAL Sr. Vizepräsident, Fernlicht GlobalDie Insight Partners lieferten aufschlussreiche, gut strukturierte Marktforschung mit fundierter Fachkompetenz. Ihr Team war durchweg professionell und reaktionsschnell. Die benutzerfreundliche Website ermöglichte den Zugriff auf Branchenberichte. Wir empfehlen sie wärmstens für zuverlässige und hochwertige Forschungsdienstleistungen.
YUKIHIKO ADACHI Geschäftsführer, Deep Blue, LLC.Dies ist das erste Mal, dass ich einen Marktbericht von The Insight Partners erworben habe. Obwohl ich zunächst unsicher war, besuchte ich die Website und fühlte mich dann sicherer, das Risiko einzugehen und einen Marktbericht zu kaufen. Ich bin mit der Qualität des Berichts und dem Kundenservice rundum zufrieden. Ich hatte einige Fragen und Anmerkungen zum ersten Bericht, aber nach einigen E-Mail-Gesprächen mit dem Analysten bin ich überzeugt, dass ich einen Bericht habe, den ich als Input für unseren strategischen Planungsprozess verwenden kann. Vielen Dank, dass Sie sich die Zeit genommen und dies zu einer positiven Erfahrung gemacht haben. Ich werde Ihren Service auf jeden Fall weiterempfehlen und Sie werden meine erste Anlaufstelle sein, wenn wir weitere Marktdaten benötigen.
JOHN SUZUKI Präsident und Chief Executive Officer, Vorstandsmitglied, BK TechnologiesIch möchte mich für Ihre Unterstützung und die Professionalität bedanken, die Sie bei der Bearbeitung meiner Informationsanfrage zum IVD-Markt für Infektionskrankheiten in Nigeria gezeigt haben. Ich schätze Ihre Geduld, Ihre Beratung und die Tatsache, dass Sie bereit waren, einen Rabatt anzubieten, der uns schließlich den Abschluss eines Geschäfts ermöglichte. Ich freue mich darauf, The Insight Partners in Zukunft wieder zu beauftragen, dank des Eindrucks, den Sie bei dieser ersten Begegnung bei mir hinterlassen haben.
DR. CHIJIOKE ONYIA GESCHÄFTSFÜHRERIN, PineCrest Healthcare Ltd.Grund zum Kauf
- Fundierte Entscheidungsfindung
- Marktdynamik verstehen
- Wettbewerbsanalyse
- Kundeneinblicke
- Marktprognosen
- Risikominimierung
- Strategische Planung
- Investitionsbegründung
- Identifizierung neuer Märkte
- Verbesserung von Marketingstrategien
- Steigerung der Betriebseffizienz
- Anpassung an regulatorische Trends


Exklusive Berichtsrabatte freischalten
Jetzt anfragen


 Kostenlose Probe anfordern für - Markt für Stromqualitätsgeräte