
Estrategias de mercado de facturación electrónica, principales actores, oportunidades de crecimiento, análisis y pronóstico para 2031
Informe de análisis de tamaño y pronóstico del mercado de facturación electrónica (2021-2031), participación global y regional, tendencias y oportunidades de crecimiento. Cobertura: por implementación (local, en la nube), usuario final (minorista y comercio electrónico, gobierno, TI y telecomunicaciones, BFSI, otros), aplicación (B2B, B2C, B2G), tipo (facturas sin orden de compra, facturas con orden de compra) y geografía (Norteamérica, Europa, Asia Pacífico, Oriente Medio y África, Sudamérica y Centroamérica).
- Estado : Publicada
- Código de informe : TIPRE00009392
- Categoría : Tecnología, medios y telecomunicaciones
- Número de páginas : 179
- Formatos de informe disponibles :


- Fecha de última actualización : June 19, 2025

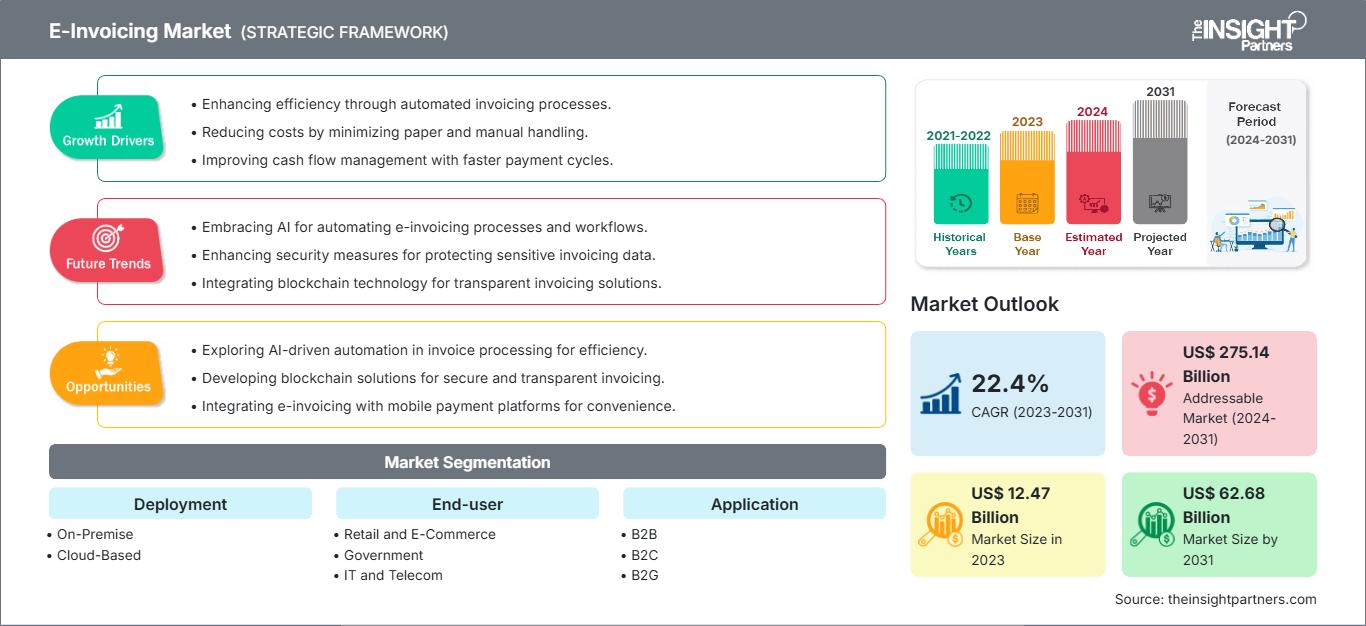
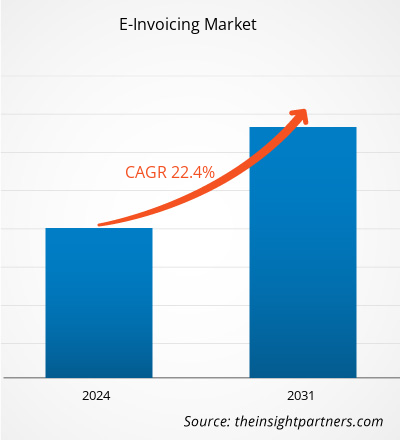
Se proyecta que el tamaño del mercado de facturación electrónica alcance los 62.680 millones de dólares estadounidenses en 2031, desde los 12.470 millones de dólares estadounidenses en 2023. Se espera que el mercado registre una CAGR del 22,4% durante el período 2023-2031.
El informe incluye perspectivas de crecimiento a la luz de las tendencias actuales del mercado de facturación electrónica y los factores impulsores que influyen en el crecimiento del mercado.
Análisis del mercado de la facturación electrónica.
La creciente demanda de soluciones digitales para combatir la evasión fiscal y el fraude financiero entre las organizaciones gubernamentales y las autoridades fiscales está impulsando el crecimiento de los mandatos de facturación electrónica en varios países. Diversas iniciativas de apoyo adoptadas por organizaciones gubernamentales y asociaciones, como la Asociación Europea de Proveedores de Servicios de Facturación Electrónica (EESPA), CEN, CEFACT/ONU, OpenPEPPOL y GS1, desempeñan un papel crucial en el desarrollo de estándares, marcos y formatos de facturación electrónica, así como en su adopción en todos los países. En cuanto a la adopción de la facturación electrónica, Brasil, Chile y México son los líderes del mercado, seguidos de países como Italia, que la exigió en 2019. La exitosa implementación de la facturación electrónica en estos países y sus beneficios están impulsando a otros países, como Bolivia, Francia, Colombia, Guatemala, China, India, Kirguistán, Uzbekistán, Vietnam, Croacia, Estonia, Serbia y Portugal, a implementar mandatos de facturación electrónica.
Visión general del mercado de la facturación electrónica
La facturación electrónica es un mercado en crecimiento con una creciente adopción en diversos segmentos, como empresa a empresa (B2B), empresa a cliente (B2C) y empresa a gobierno (B2G). La facturación electrónica se refiere exclusivamente al intercambio de facturas electrónicas entre compradores y proveedores. Cada país define la facturación electrónica de forma diferente según las regulaciones y la naturaleza de los negocios predominantes en cada país. Para el intercambio de facturas electrónicas, se utilizan diversos modelos en diferentes industrias, como el modelo directo del proveedor, el modelo directo del comprador, el modelo SaaS/PaaS, el modelo de red, el modelo de cuatro esquinas, el modelo multinube y el modelo de nube híbrida. Las organizaciones de todo el mundo intercambian facturas electrónicas directamente con sus clientes o utilizan proveedores de servicios externos. La creciente tendencia a digitalizar diversos documentos para un procesamiento eficiente y los requisitos de cumplimiento está impulsando la transición de las facturas manuales en papel a las facturas electrónicas a escala global.
Personalice este informe según sus necesidades
Obtendrá personalización en cualquier informe, sin carga, incluidas partes de este informe o análisis a nivel de país, paquete de datos de Excel, así como también grandes ofertas y descuentos para empresas emergentes y universidades.
Mercado de facturación electrónica: Perspectivas estratégicas
-
Obtenga las principales tendencias clave del mercado de este informe.Esta muestra GRATUITA incluye análisis de datos, desde tendencias del mercado hasta estimaciones y pronósticos.
Factores impulsores y oportunidades del mercado de facturación electrónica
Transformación digital en diferentes industrias para favorecer el mercado
El entorno empresarial global está experimentando una profunda transformación a medida que las organizaciones aprovechan cada vez más las tecnologías digitales para mejorar la productividad, optimizar las operaciones y reducir costos. Esta evolución digital no se limita a las grandes corporaciones; las pequeñas y medianas empresas (PYME) también están adoptando un amplio espectro de tecnologías, incluyendo plataformas web, infraestructura en la nube, inteligencia artificial (IA), Internet de las Cosas (IoT), análisis de big data y modelos predictivos. La transformación digital se está convirtiendo rápidamente en un imperativo estratégico, permitiendo a las organizaciones no solo automatizar funciones esenciales, sino también ofrecer mejores experiencias al cliente, tomar decisiones basadas en datos y generar nuevas fuentes de ingresos. Los gobiernos de todo el mundo desempeñan un papel catalizador en esta evolución. Marcos de políticas como Digital India, la Estrategia de Gobierno Digital de EE. UU. y la Estrategia Digital 2025 de Alemania están acelerando la adopción digital mediante la inversión en infraestructura, innovación y desarrollo de habilidades. Estas iniciativas están fomentando un ecosistema más conectado e impulsado por la tecnología, animando a los actores del mercado de todos los sectores a digitalizar sus operaciones para aumentar la eficiencia y la escalabilidad. Uno de los ámbitos críticos que experimenta una rápida digitalización es la facturación. Tradicionalmente, la facturación en transacciones B2B, B2C y B2G se ha basado en procesos manuales en papel que consumen mucho tiempo y recursos. A nivel mundial, se emiten millas de millones de facturas al diario, pero solo un pequeño porcentaje se procesa electrónicamente. Esto revela una brecha de mercado considerable y presenta una sólida trayectoria de crecimiento para el segmento de la facturación electrónica. El manual de facturación suele ser propensa a errores, retrasos e ineficiencias, lo que en última instancia afecta el rendimiento empresarial. Por el contrario, los sistemas de facturación electrónica automatizan la generación, transmisión y conciliación de facturas, lo que genera múltiples beneficios operativos y financieros. Estos incluyen reducción de costos, mayor precisión, ciclos de pago más rápidos, mejor cumplimiento de la normativa fiscal y una gestión más eficaz del flujo de caja. Además, la transición del papel al formato digital apoya los objetivos de sostenibilidad corporativa al reducir el consumo de papel y la huella de carbono asociada. Más allá del ahorro de costos, la facturación electrónica también mejora la transparencia y la gobernanza en los flujos de trabajo financieros. Al integrarse fluidamente con los sistemas de planificación de recursos empresariales (ERP) y contabilidad, las empresas pueden obtener visibilidad en tiempo real de sus cuentas por pagar y por cobrar, optimizando así la toma de decisiones estratégicas.Tanto para proveedores como para compradores, esto se traduce en interacciones más ágiles, menos disputas y una mayor eficiencia del capital circulante. A medida que la transformación digital continúa acelerándose a nivel mundial, la facturación electrónica se perfila como un elemento fundamental del ecosistema financiero digital. Las organizaciones que invierten proactivamente en soluciones de facturación electrónica escalables y seguras probablemente obtendrán una ventaja competitiva en un mercado cada vez más automatizado e impulsado por los datos.
Aumento de la demanda de soluciones basadas en la nube
La computación en la nube se está convirtiendo en el motor de la transformación digital en todas las industrias. La demanda de soluciones basadas en la nube en las empresas está creciendo a un ritmo sin precedentes debido a las ventajas que ofrecen estas soluciones sobre la implementación local. Las principales ventajas de las soluciones basadas en la nube incluyen la facilidad de implementación, la interoperabilidad, el ahorro de costos, la alta eficiencia y las funciones bajo demanda. Servicios como Infraestructura como Servicio (IaaS) y Software como Servicio (SaaS) están creciendo rápidamente. Sin embargo, la adopción de soluciones basadas en la nube varía según la geografía y las empresas, dependiendo de factores como el entorno regulatorio y los escenarios competitivos. La demanda de soluciones basadas en la nube es alta en las pequeñas y medianas empresas debido a los beneficios de costos relacionados con estas soluciones. La mayoría de las grandes organizaciones aún utilizan soluciones locales, ya que implementar nuevos procesos en las grandes organizaciones y sus redes es una tarea compleja que requiere cambios en las prácticas laborales tradicionales.
Análisis de segmentación del informe de mercado de facturación electrónica.
Los segmentos claves que contribuyeron a la derivación del análisis del mercado de facturación electrónica son la implementación, el usuario final, la aplicación y el tipo.
- Según el modelo de implementación, el mercado de la facturación electrónica se segmenta en la nube y en instalaciones locales. En 2023, el segmento de la nube contaba con una mayor cuota de mercado gracias a ventajas como la facilidad de implementación, el ahorro de costes y la flexibilidad operativa.
- Según el usuario final, el mercado se segmenta en comercio minorista y comercio electrónico, gobierno, TI y telecomunicaciones, BFSI, entre otros. El segmento gubernamental tuvo la mayor cuota de mercado de facturación electrónica en 2023.
- Según el tipo, el mercado de la facturación electrónica se segmenta en facturas con orden de compra y facturas sin orden de compra. En 2023, el segmento de facturas sin orden de compra dominó el mercado con una mayor cuota de mercado y se espera que registre una tasa de crecimiento anual compuesta (TCAC) más alta durante el período de pronósticos.
- Según su aplicación, el mercado de la facturación electrónica se clasifica en B2B, B2C y B2G. El segmento B2G representó la mayor participación en el mercado global de facturación electrónica, y se prevé que el segmento B2B sea el de mayor crecimiento durante el período de pronóstico.
Análisis de la cuota de mercado de la facturación electrónica por geografía
El mercado de la facturación electrónica se segmenta en cinco regiones principales: Norteamérica, Europa, Asia Pacífico (APAC), Oriente Medio y África (MEA) y Sudamérica y Centroamérica. Norteamérica tuvo la mayor cuota de mercado en 2023. En términos de cuota de mercado, Europa, Sudamérica y Centroamérica, y APAC ocuparon el segundo, tercer y cuarto lugar, respectivamente, en 2023. Europa es otro mercado crucial para la facturación electrónica. Recientemente, Italia se ha convertido en el primer país europeo en exigir la facturación electrónica para combatir el fraude y la evasión fiscal, así como para aumentar la eficiencia del sistema fiscal. Se espera que otros países europeos sigan el ejemplo de Italia y adopten la facturación electrónica, impulsando positivamente el mercado.
Perspectivas regionales del mercado de la facturación electrónica.
Los analistas de The Insight Partners han explicado detalladamente las tendencias regionales y los factores que influyen en el mercado de la facturación electrónica durante el período de pronóstico. Esta sección también analiza los segmentos y la geografía del mercado de la facturación electrónica en Norteamérica, Europa, Asia Pacífico, Oriente Medio y África, y Sudamérica y Centroamérica.
Alcance del informe de mercado de facturación electrónica
| Atributo del informe | Detalles |
|---|---|
| Tamaño del mercado en 2023 | US$ 12,47 mil millones |
| Tamaño del mercado en 2031 | US$ 62,68 mil millones |
| Tasa de crecimiento anual compuesta (TCAC) global (2023-2031) | 22,4% |
| Datos históricos | 2021-2022 |
| Período de pronóstico | 2024-2031 |
| Segmentos cubiertos |
Por Despliegue
|
| Regiones y países cubiertos |
América del Norte
|
| Líderes del mercado y perfiles de empresas clave |
|
Densidad de actores del mercado de la facturación electrónica: comprensión de su impacto en la dinámica empresarial
El mercado de la facturación electrónica está creciendo rápidamente, impulsado por la creciente demanda de los usuarios finales debido a factores como la evolución de las preferencias de los consumidores, los avances tecnológicos y una mayor conciencia de los beneficios del producto. A medida que aumenta la demanda, las empresas amplían su oferta, innovan para satisfacer las necesidades de los consumidores y aprovechan las tendencias emergentes, lo que impulsa aún más el crecimiento del mercado.
- Obtenga una descripción general de los principales actores clave del mercado de facturación electrónica.
Noticias del mercado de la facturación electrónica y novedades.
El mercado de la facturación electrónica se evalúa mediante la recopilación de datos cualitativos y cuantitativos a partir de investigaciones primarias y secundarias, que incluyen importantes publicaciones corporativas, datos de asociaciones y bases de datos. A continuación, se presenta una lista de las novedades en el mercado de la facturación electrónica:
- En 2021, Coupa Software, uno de los líderes en gestión de gastos empresariales (BSM), anunció su incorporación oficial a la Asociación para la Promoción de la Factura Electrónica (EIPA), organización que desarrolla, demuestra y promueve especificaciones estándar para facturas electrónicas. (Fuente: Coupa Software, comunicado de prensa)
- En 2024, Basware, líder mundial en automatización de cuentas por pagar y procesamiento de facturas, anunció importantes planes de expansión global, con un aumento del 52 % en las reservas y una aceleración interanual del crecimiento de los ingresos recurrentes en 2023. (Fuente: Sweco AB, comunicado de prensa)
- En 2023, Toyota Boshoku Asia firmó un contrato con Comarch para la implementación de la facturación electrónica en Tailandia. Comarch apoyará a Toyota Boshoku Asia en la implementación de una solución de facturación electrónica para la preparación, entrega y almacenamiento de documentos digitales, con firmas digitales para facturas y recibos fiscales, que cumpla con las condiciones y requisitos del Departamento de Hacienda de Tailandia. (Fuente: Toyota Boshoku, comunicado de prensa)
Informe de mercado sobre facturación electrónica: cobertura y resultados
El informe "Tamaño y pronósticos del mercado de la facturación electrónica (2022-2030)" ofrece un análisis detallado del mercado que abarca las siguientes áreas:
- Tamaño del mercado de facturación electrónica y pronóstico a nivel global, regional y nacional para todos los segmentos clave del mercado cubiertos bajo el alcance
- Dinámica del mercado de la facturación electrónica: impulsores, restricciones y oportunidades clave
- Principales tendencias futuras en el mercado de la facturación electrónica
- Análisis detallado PEST/de las cinco fuerzas de Porter y FODA
- Análisis del mercado global y regional que cubre las tendencias clave del mercado, los principales actores, las regulaciones y los desarrollos recientes del mercado.
- Análisis del panorama industrial y de la competencia que abarca la concentración del mercado, el análisis de mapas de calor, los actores destacados y los desarrollos recientes en el mercado de la facturación electrónica.
- Perfiles detallados de empresas

Ankita es una profesional dinámica en investigación de mercados y consultoría con más de 8 años de experiencia en los sectores de tecnología, medios de comunicación, TIC, electrónica y semiconductores. Ha liderado y ejecutado con éxito más de 100 proyectos de consultoría e investigación para clientes globales como Microsoft, Oracle, NEC Corporation, SAP, KPMG y Expeditors International. Sus principales competencias incluyen la evaluación de mercado, el análisis de datos, la previsión, la formulación de estrategias, la inteligencia competitiva y la redacción de informes.
Ankita es experta en la gestión de ciclos completos de proyecto, desde el diseño de propuestas de preventa y las conversaciones con los clientes hasta la entrega de información práctica posventa. Es experta en la gestión de equipos multifuncionales, la estructuración de módulos de investigación complejos y la alineación de soluciones con los objetivos de negocio específicos del cliente. Sus excelentes habilidades de comunicación, liderazgo y presentación le han permitido obtener constantemente resultados orientados al valor en entornos de mercado dinámicos y en constante evolución.
- Análisis exhaustivo del tamaño del mercado y previsiones
- Análisis detallado de la segmentación
- Evaluación en profundidad de la dinámica del mercado
- Información a nivel regional y nacional
- Panorama competitivo y análisis comparativo de empresas
- Inteligencia empresarial estratégica
Testimonios
El informe de mercado de sistemas SCADA de Insight Partners es completo y ofrece información valiosa sobre las tendencias actuales y las previsiones futuras. El equipo fue altamente profesional, receptivo y me brindó un gran apoyo en todo momento. Estamos muy satisfechos y recomendamos ampliamente sus servicios.
RAN KEDEM Socio, Reali Technologies LTDsSolicité un informe sobre un mercado de software muy específico y el equipo lo elaboró en pocos días. La información era muy relevante y estaba bien presentada. Posteriormente, solicité algunos cambios y adiciones al informe. El equipo fue muy receptivo y recibí el informe final en menos de una semana.
JEAN-HERVE JENN Presidente, Future AnalyticaTrabajamos con The Insight Partners para un importante estudio y pronóstico de mercado. Nos brindaron una visión clara de las oportunidades y los riesgos, lo que nos ayudó a definir nuestros planes. Su investigación fue fácil de usar y se basó en datos sólidos. Nos ayudó a tomar decisiones inteligentes y seguras. Los recomendamos ampliamente.
PIYUSH NAGPAL Vicepresidente Sénior, , High Beam GlobalThe Insight Partners realizó una investigación de mercado profunda y bien estructurada con una sólida experiencia en el sector. Su equipo fue profesional y receptivo en todo momento. El sitio web, fácil de usar, facilitó el acceso a los informes del sector. Los recomendamos ampliamente por sus servicios de investigación confiables y de alta calidad.
YUKIHIKO ADACHI Director Ejecutivo, , Deep Blue, LLCEsta es la primera vez que compro un informe de mercado de The Insight Partners. Aunque al principio tenía dudas, visité su sitio web y me sentí más cómodo al arriesgarme y comprarlo. Estoy completamente satisfecho con la calidad del informe y el servicio al cliente. Tenía varias preguntas y comentarios sobre el informe inicial, pero después de un par de conversaciones por correo electrónico con su analista, creo que tengo un informe que puedo usar como base para nuestro proceso de planificación estratégica. Muchas gracias por tomarse el tiempo y hacer de esta una experiencia positiva. Sin duda, recomendaré sus servicios y serán mi primera opción cuando necesitemos más datos de mercado.
JOHN SUZUKI Presidente y Director Ejecutivo, Director de la Junta Directiva, BK TechnologiesAgradezco su apoyo y la profesionalidad que demostraron al atender mi solicitud de información sobre el mercado de diagnóstico in vitro (IVD) para enfermedades infecciosas en Nigeria. Agradezco su paciencia, su orientación y su disposición a ofrecerme un descuento, lo que finalmente nos permitió cerrar un trato. Espero poder colaborar con The Insight Partners en el futuro, gracias a la impresión que me causó este primer encuentro.
DRA. CHIJIOKE ONYIA, DIRECTORA GENERAL, PineCrest Healthcare Ltd.Razón para comprar
- Toma de decisiones informada
- Comprensión de la dinámica del mercado
- Análisis competitivo
- Información sobre clientes
- Pronósticos del mercado
- Mitigación de riesgos
- Planificación estratégica
- Justificación de la inversión
- Identificación de mercados emergentes
- Mejora de las estrategias de marketing
- Impulso de la eficiencia operativa
- Alineación con las tendencias regulatorias


