
電子請求書市場戦略、主要プレーヤー、成長機会、分析、2031年までの予測
電子請求書市場の規模と予測(2021年 - 2031年)、世界および地域別のシェア、トレンド、成長機会分析レポートの対象範囲:展開別(オンプレミス、クラウドベース)、エンドユーザー別(小売および電子商取引、政府、ITおよび通信、BFSI、その他)、アプリケーション別(B2B、B2C、B2G)、タイプ別(非注文書請求書、注文書請求書)、および地域別(北米、ヨーロッパ、アジア太平洋、中東およびアフリカ、南米および中米)
- ステータス : 出版
- レポートコード : TIPRE00009392
- カテゴリー : テクノロジー、メディア、通信
- ページ数 : 179
- 利用可能なレポート形式 :


- 最終更新日 : June 19, 2025

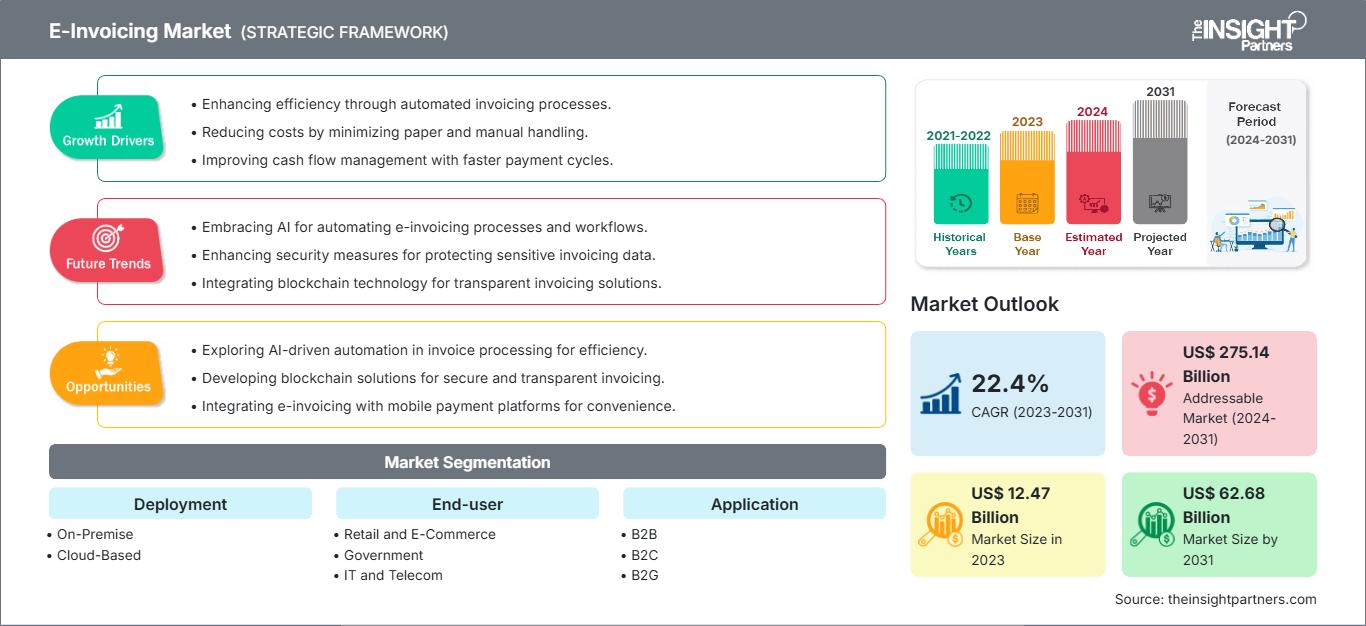
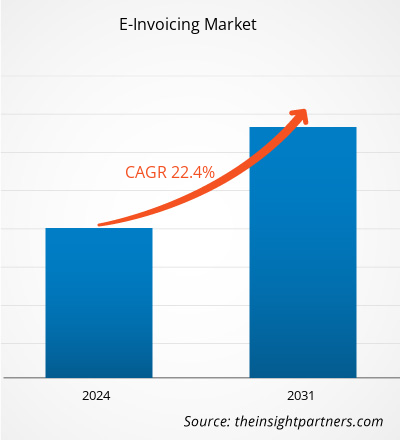
電子インボイス市場の規模は、2023年の124億7,000万米ドルから、2031年には626億8,000万米ドルに達すると予測されています。市場は2023年から2031年の間に22.4%のCAGRを記録すると予想されています。
レポートには、現在の電子インボイス市場の動向と市場の成長に影響を与える推進要因を考慮した成長見通しが含まれています。
電子インボイス市場分析
政府機関や税務当局の間では、脱税や金融詐欺に対抗するためのデジタルソリューションに対する需要が高まっており、さまざまな国で電子インボイスの義務化が進んでいます。欧州電子請求書サービスプロバイダー協会 (EESPA)、CEN、UN/CEFACT、OpenPEPPOL、GS1 などの政府機関や協会によるさまざまな支援活動は、電子請求書の標準/フレームワーク/形式の開発と、各国での電子請求書の導入を推進する上で重要な役割を果たしています。電子インボイスの導入では、ブラジル、チリ、メキシコが市場をリードしており、2019年に電子インボイスを義務化したイタリアなどの国がこれに続きます。これらの国における電子インボイスの導入の成功とそのメリットは、ボリビア、フランス、コロンビア、グアテマラ、中国、インド、キルギスタン、ウズベキスタン、ベトナム、クロアチア、エストニア、セルビア、ポルトガルなどの他の国々でも電子インボイスの義務化を推進しています。電子インボイス市場の概要
電子インボイスは、企業間取引(B2B)、企業顧客間取引(B2C)、企業政府間取引(B2G)など、さまざまな分野で導入が進んでいる成長市場です。電子インボイスとは、購入者とサプライヤー間の電子インボイス交換のみを指します。電子請求書の定義は、各国の規制や事業内容に基づき、国によって様々です。電子請求書のやり取りには、サプライヤーダイレクトモデル、バイヤーダイレクトモデル、SaaS/PaaSモデル、ネットワークモデル、フォーコーナーモデル、マルチクラウドモデル、ハイブリッドクラウドモデルなど、業界を問わず様々なモデルが利用されています。世界中の組織は、顧客と直接電子請求書を交換するか、サードパーティのサービスプロバイダーを利用しています。効率的な処理とコンプライアンス要件を満たすために、様々な文書をデジタル化する傾向が高まっており、手書きの紙ベースの請求書から電子請求書への移行が世界規模で加速しています。要件に合わせてレポートをカスタマイズ
レポートの一部、国レベルの分析、Excelデータパックなどを含め、スタートアップ&大学向けに特別オファーや割引もご利用いただけます(無償)
電子請求書市場: 戦略的洞察
-
このレポートの主要な市場動向を入手してください。この無料サンプルには、市場動向から見積もりや予測に至るまでのデータ分析が含まれます。
クラウドベースソリューションの需要増加
クラウドコンピューティングは、あらゆる業界でデジタルトランスフォーメーションの原動力となりつつあります。クラウドベースのソリューションはオンプレミス導入に比べて多くのメリットがあるため、企業全体でかつてない速さで需要が高まっています。クラウドベースのソリューションの主なメリットとしては、導入の容易さ、相互運用性、コスト削減、高い効率性、オンデマンド機能などが挙げられます。IaaS(Infrastructure as a Service)やSaaS(Software as a Service)といったサービスは急速に成長しています。しかし、クラウドベースのソリューションの導入は、規制環境や競争状況といった要因によって、地域や企業によって異なります。中小企業では、コスト面でのメリットから、クラウドベースのソリューションへの需要が高くなっています。大規模組織の多くは、依然としてオンプレミス ソリューションを使用しています。これは、大規模組織全体とそのネットワーク全体に新しいプロセスを実装することが複雑な作業であり、従来の作業慣行の変更が必要になるためです。電子請求書市場レポートのセグメンテーション分析
電子請求書市場分析の導出に貢献した主要なセグメントは、導入、エンド ユーザー、アプリケーション、およびタイプです。- 導入モデル別に、電子請求書市場はクラウドとオンプレミスに分割されています。2023 年には、クラウド セグメントが、容易な実装、コスト削減、運用の柔軟性などの利点により、より大きな電子請求書市場シェアを占めました。
- エンド ユーザー別に、市場は小売および電子商取引、政府、IT および通信、BFSI、その他に分割されています。 2023年には、政府部門が最大の電子インボイス市場シェアを占めました。
- タイプに基づいて、電子インボイス市場は、発注書請求書と非発注書請求書に分類されます。2023年には、非発注書請求書セグメントが大きな市場シェアで市場を支配し、予測期間中に高いCAGRを記録すると予想されます。
- アプリケーションに基づいて、電子インボイス市場は、B2B、B2C、およびB2Gに分類されます。B2Gセグメントは、世界の電子インボイス市場で最大のシェアを占め、B2Bセグメントは予測期間中に最も急速に成長するセグメントになると予想されます。
地域別の電子インボイス市場シェア分析
電子インボイス市場は、北米、ヨーロッパ、アジア太平洋(APAC)、中東およびアフリカの5つの主要地域に分類されています。電子インボイス市場は、2023年には北米が最大のシェアを占めました。市場シェアでは、ヨーロッパ、南米、アジア太平洋地域がそれぞれ2023年に2位、3位、4位を占めました。ヨーロッパも電子インボイスにとって重要な市場です。最近、イタリアは、脱税や脱税の防止、そして財政システムの効率化を目的として、ヨーロッパで初めて電子インボイスの導入を義務付けました。他のヨーロッパ諸国もイタリアに倣って電子インボイスを導入し、市場を活性化させると予想されています。電子インボイス市場
電子請求書市場予測期間を通じて電子請求書市場に影響を与える地域的な傾向と要因については、The Insight Partnersのアナリストが詳細に解説しています。このセクションでは、北米、ヨーロッパ、アジア太平洋、中東・アフリカ、中南米における電子請求書市場のセグメントと地域についても解説しています。
電子請求書市場レポートの範囲
| レポート属性 | 詳細 |
|---|---|
| の市場規模 2023 | US$ 12.47 Billion |
| 市場規模別 2031 | US$ 62.68 Billion |
| 世界的なCAGR (2023 - 2031) | 22.4% |
| 過去データ | 2021-2022 |
| 予測期間 | 2024-2031 |
| 対象セグメント |
By 展開
|
| 対象地域と国 |
北米
|
| 市場リーダーと主要企業の概要 |
|
電子請求書市場のプレーヤー密度:ビジネスダイナミクスへの影響を理解する
電子請求書市場は、消費者の嗜好の変化、技術の進歩、製品メリットへの認知度の高まりといった要因によるエンドユーザーの需要増加に牽引され、急速に成長しています。需要の増加に伴い、企業は提供内容を拡大し、消費者ニーズを満たすための革新を進め、新たなトレンドを活用しており、これが市場の成長をさらに促進しています。
- 入手 電子請求書市場 主要プレーヤーの概要
電子請求書市場のニュースと最新動向
電子請求書市場は、主要な企業出版物、協会データ、データベースなどの一次調査と二次調査を経て、定性・定量データを収集することで評価されます。以下は、電子請求書市場の動向です。- 2021年、ビジネス支出管理(BSM)のリーダー企業であるCoupa Softwareは、電子請求書の標準仕様を開発、実証、推進する組織であるE-Invoice Promotion Association(EIPA)の正式会員になったことを発表しました。 (出典:Coupa Software、プレスリリース)
- 2024年、買掛金自動化および請求書処理の世界的リーダーであるBaswareは、2023年の受注が52%増加し、経常収益の成長が前年比で加速したことを受け、大規模なグローバル展開計画を発表しました。(出典:Sweco AB、プレスリリース)
- 2023年、トヨタ紡織アジアは、タイにおける電子請求書の導入についてComarchと契約を締結しました。Comarchは、タイ歳入局の条件と要件に準拠した税金請求書と領収書のデジタル署名を備えたデジタル文書の作成、配信、保管のための電子請求書ソリューションの構築において、トヨタ紡織アジアをサポートします。 (出典:トヨタ紡織、プレスリリース)
電子請求書市場レポートの対象範囲と成果物
「電子請求書市場規模と予測(2022~2030年)」では、以下の分野を網羅した詳細な市場分析を提供しています。- 調査対象となるすべての主要市場セグメントにおける、世界、地域、国レベルでの電子請求書市場規模と予測
- 推進要因、制約要因、主要な機会などの電子請求書市場のダイナミクス
- 電子請求書市場における主要な今後の動向
- 詳細なPEST/ポーターの5つの力とSWOT分析
- 主要な市場動向、主要プレーヤー、規制、最近の市場動向を網羅した世界および地域の市場分析
- 市場集中、ヒートマップ分析、主要プレーヤー、最近の市場動向を網羅した業界の状況と競争分析電子請求書市場
- 詳細な企業プロフィール

アンキタは、テクノロジー、メディア、ICT、エレクトロニクス・半導体の各分野で8年以上の経験を持つ、ダイナミックな市場調査およびコンサルティングのプロフェッショナルです。Microsoft、Oracle、NEC、SAP、KPMG、Expeditors Internationalといったグローバルクライアントに対し、100件以上のコンサルティングおよび調査案件を主導・遂行してきました。彼女のコアコンピテンシーは、市場評価、データ分析、予測、戦略策定、競合情報、レポート作成です。
アンキタは、販売前の提案書作成やクライアントとの協議から、販売後の実用的なインサイトの提供まで、プロジェクトサイクル全体を巧みに管理することに長けています。彼女は、部門横断的なチームの管理、複雑な調査モジュールの構築、そしてクライアント固有のビジネス目標に合わせたソリューションの調整に長けています。優れたコミュニケーション能力、リーダーシップ、そしてプレゼンテーション能力により、急速に変化する市場環境において、常に価値主導の成果を生み出しています。
- 包括的な市場規模および予測分析
- 詳細なセグメンテーション分析
- 市場動向(ダイナミクス)の徹底的な評価
- 地域および国別のインサイト
- 競争環境および企業ベンチマーク
- 戦略的ビジネスインテリジェンス
お客様の声
Insight PartnersのSCADAシステム市場レポートは包括的で、現在のトレンドと将来の予測に関する貴重な洞察が含まれています。チームは終始、非常にプロフェッショナルで、対応が早く、サポートも充実していました。私たちは彼らのサービスに非常に満足しており、強くお勧めします。
ラン・ケデム パートナー, レアリテクノロジーズ株式会社非常に特殊なソフトウェア市場に関するレポートを依頼したところ、チームは数日でレポートを作成してくれました。情報は非常に関連性が高く、分かりやすくまとめられていました。その後、レポートにいくつか修正と追加を依頼しましたが、チームは非常に迅速に対応し、1週間も経たないうちに最終レポートを受け取ることができました。
ジャン=エルヴェ・ジェン 会長, フューチャー・アナリティカ重要な市場調査と予測のために、The Insight Partnersと協力しました。彼らは機会とリスクに関する明確な洞察を提供し、私たちの計画策定に役立ちました。彼らの調査は使いやすく、確かなデータに基づいており、賢明で自信に満ちた意思決定に役立ちました。彼らを強くお勧めします。
ピユーシュ・ナグパル 上級副社長, ハイビームグローバルInsight Partnersは、深い専門知識に基づき、洞察力に富み、構造化された市場調査を提供しました。チームは終始プロフェッショナルで、対応力も抜群でした。ユーザーフレンドリーなウェブサイトにより、業界レポートへのアクセスもスムーズでした。信頼性の高い高品質な調査サービスをお探しなら、Insight Partnersを強くお勧めします。
安達幸彦 最高経営責任者(CEO), ディープブルーLLC。The Insight Partnersから市場レポートを購入するのは今回が初めてです。最初は不安でしたが、ウェブサイトを見て、リスクを負ってでも購入してみようという気持ちになりました。レポートの品質とカスタマーサービスには大変満足しています。最初のレポートにはいくつか質問やコメントがありましたが、アナリストとメールで何度かやり取りした結果、戦略策定プロセスへのインプットとして活用できるレポートが完成しました。貴重なお時間を割いていただき、貴重な体験をさせていただき、誠にありがとうございました。他の方にもぜひお勧めしたいですし、今後さらに市場データが必要になった際には、まずThe Insight Partnersにご連絡させていただきます。
ジョン・スズキ 社長兼最高経営責任者、取締役, BKテクノロジーズナイジェリアの感染症IVD市場に関する情報提供依頼に対し、ご対応いただいた際、ご尽力とプロフェッショナルな姿勢に深く感謝申し上げます。忍耐強く、的確なアドバイスをいただき、また、最終的に取引成立に至った割引のご提供にも深く感謝申し上げます。今回の最初の出会いで得た強い印象のおかげで、今後もThe Insight Partnersとの連携を心待ちにしております。
チジオケ博士 オニア マネージングディレクター, パインクレストヘルスケア株式会社購入理由
- 情報に基づいた意思決定
- 市場動向の理解
- 競合分析
- 顧客インサイト
- 市場予測
- リスク軽減
- 戦略計画
- 投資の正当性
- 新興市場の特定
- マーケティング戦略の強化
- 業務効率の向上
- 規制動向への対応


