
Strategie di mercato della fatturazione elettronica, principali attori, opportunità di crescita, analisi e previsioni entro il 2031
Rapporto di analisi su dimensioni e previsioni del mercato della fatturazione elettronica (2021-2031), quota globale e regionale, tendenze e opportunità di crescita. Copertura: per implementazione (on-premise, basata su cloud), utente finale (vendita al dettaglio ed e-commerce, governo, IT e telecomunicazioni, BFSI, altri), applicazione (B2B, B2C, B2G), tipo (fatture non-ordine d'acquisto, fatture ordine d'acquisto) e area geografica (Nord America, Europa, Asia Pacifico, Medio Oriente e Africa, Sud e Centro America).
- Stato : Edito
- Codice del report : TIPRE00009392
- Categoria : Tecnologia, media e telecomunicazioni
- Numero di pagine : 179
- Formati di report disponibili :


- Data dell'ultimo aggiornamento : June 19, 2025

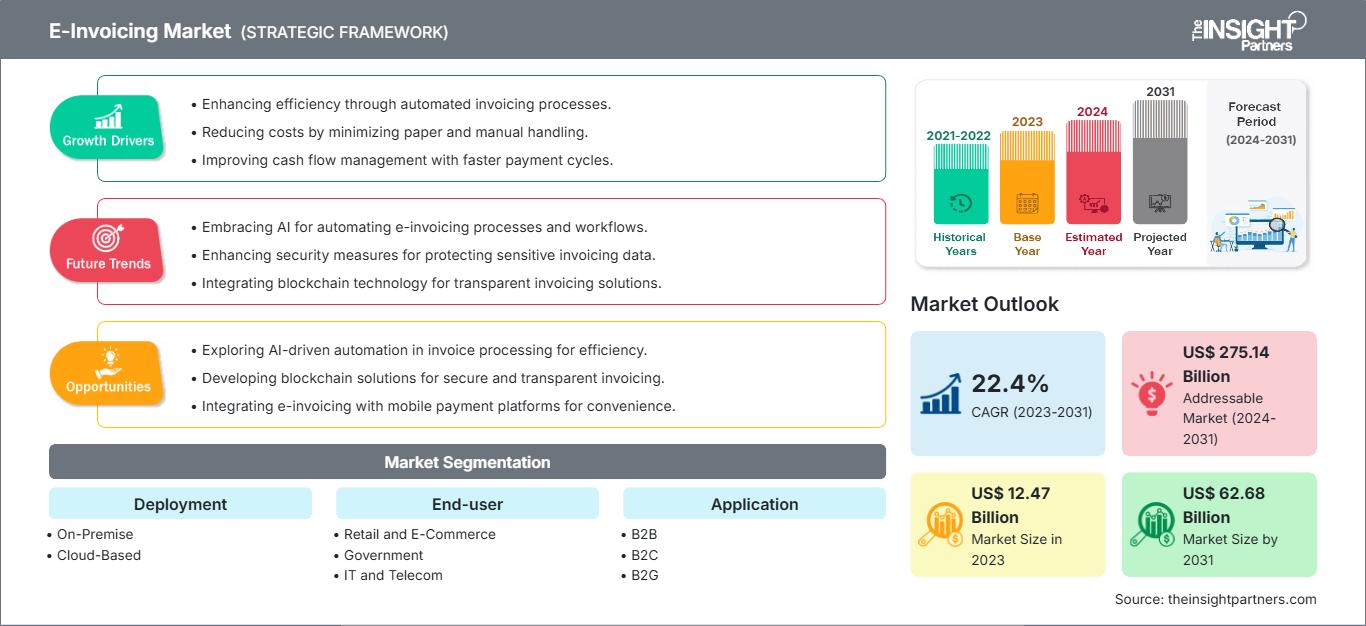
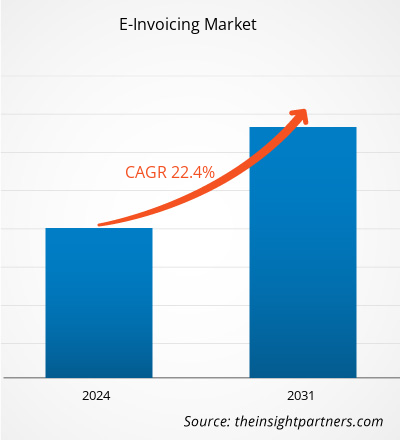
Si prevede che il mercato della fatturazione elettronica raggiungerà i 62,68 miliardi di dollari entro il 2031, rispetto ai 12,47 miliardi di dollari del 2023. Si prevede che il mercato registrerà un CAGR del 22,4% nel periodo 2023-2031.
Il rapporto include prospettive di crescita alla luce delle attuali tendenze del mercato della fatturazione elettronica e dei fattori trainanti che influenzano la crescita del mercato.
Analisi del mercato della fatturazione elettronica
La crescente domanda di soluzioni digitali per combattere l'evasione fiscale e le frodi finanziarie tra le organizzazioni governative e le autorità fiscali sta determinando la crescita degli obblighi di fatturazione elettronica in diversi paesi. Diverse iniziative di supporto intraprese da organizzazioni e associazioni governative, come l'Associazione europea dei fornitori di servizi di fatturazione elettronica (EESPA), CEN, UN/CEFACT, OpenPEPPOL e GS1, stanno svolgendo un ruolo cruciale nel promuovere lo sviluppo di standard/quadri/formati di fatturazione elettronica e l'adozione della fatturazione elettronica in tutti i paesi. In termini di adozione della fatturazione elettronica, Brasile, Cile e Messico sono leader di mercato, seguiti da paesi come l'Italia, che ha reso obbligatoria la fatturazione elettronica nel 2019. Il successo dell'implementazione della fatturazione elettronica in questi paesi e i suoi vantaggi stanno spingendo altri paesi, come Bolivia, Francia, Colombia, Guatemala, Cina, India, Kirghizistan, Uzbekistan, Vietnam, Croazia, Estonia, Serbia e Portogallo, a implementare l'obbligo di fatturazione elettronica.Panoramica del mercato della fatturazione elettronica
La fatturazione elettronica è un mercato in crescita, con una crescente adozione in diversi segmenti, come business-to-business (B2B), business-to-customer (B2C) e business-to-government (B2G). La fatturazione elettronica si riferisce esclusivamente allo scambio di fatture elettroniche tra acquirenti e fornitori. Diversi paesi definiscono la fatturazione elettronica in modo diverso in base alle normative e alla natura delle attività commerciali prevalenti in ciascun paese. Per lo scambio di fatture elettroniche, vengono utilizzati diversi modelli in diversi settori, come il modello fornitore diretto, il modello acquirente diretto, il modello SaaS/PaaS, il modello di rete, il modello a quattro angoli, il modello multi-cloud e il modello cloud ibrido. Le organizzazioni di tutto il mondo scambiano fatture elettroniche direttamente con i propri clienti o si avvalgono di fornitori di servizi terzi. La crescente tendenza alla digitalizzazione di vari documenti per un'elaborazione efficiente e per soddisfare i requisiti di conformità sta accelerando la transizione dalle fatture cartacee manuali alle fatture elettroniche su scala globale.Personalizza questo rapporto in base alle tue esigenze
Potrai personalizzare gratuitamente qualsiasi rapporto, comprese parti di questo rapporto, o analisi a livello di paese, pacchetto dati Excel, oltre a usufruire di grandi offerte e sconti per start-up e università
Mercato della fatturazione elettronica: Approfondimenti strategici
-
Ottieni le principali tendenze chiave del mercato di questo rapporto.Questo campione GRATUITO includerà l'analisi dei dati, che vanno dalle tendenze di mercato alle stime e alle previsioni.
Aumento della domanda di soluzioni basate su cloud
Il cloud computing sta diventando la forza trainante della trasformazione digitale in tutti i settori. La domanda di soluzioni basate su cloud in tutte le aziende sta crescendo a un ritmo senza precedenti grazie ai vantaggi offerti da queste soluzioni rispetto all'implementazione on-premise. I principali vantaggi delle soluzioni basate su cloud includono facilità di implementazione, interoperabilità, risparmio sui costi, elevata efficienza e funzionalità on-demand. Servizi come Infrastructure as a Service (IaaS) e Software as a Service (SaaS) sono in rapida crescita. Tuttavia, l'adozione di soluzioni basate su cloud varia a seconda delle aree geografiche e delle aziende, a seconda di fattori quali il contesto normativo e gli scenari competitivi. La domanda di soluzioni basate su cloud è elevata nelle piccole e medie imprese, grazie ai vantaggi economici che queste soluzioni offrono. La maggior parte delle grandi organizzazioni utilizza ancora soluzioni on-premise, poiché l'implementazione di nuovi processi nelle grandi organizzazioni e nelle relative reti è un'attività complessa e richiede cambiamenti nelle pratiche di lavoro tradizionali.Analisi della segmentazione del mercato della fatturazione elettronica
I segmenti chiave che hanno contribuito alla derivazione dell'analisi del mercato della fatturazione elettronica sono implementazione, utente finale, applicazione e tipologia.- In base al modello di implementazione, il mercato della fatturazione elettronica è segmentato in cloud e on-premise. Nel 2023, il segmento cloud ha detenuto una quota di mercato maggiore della fatturazione elettronica grazie a vantaggi quali facilità di implementazione, risparmio sui costi e flessibilità operativa.
- In base all'utente finale, il mercato è segmentato in vendita al dettaglio ed e-commerce, pubblica amministrazione, IT e telecomunicazioni, BFSI e altri. Il segmento pubblico ha detenuto la quota di mercato maggiore della fatturazione elettronica nel 2023.
- In base alla tipologia, il mercato della fatturazione elettronica è segmentato in fatture con ordine d'acquisto e fatture senza ordine d'acquisto. Nel 2023, il segmento delle fatture senza ordine d'acquisto ha dominato il mercato con una quota di mercato maggiore e si prevede che registrerà un CAGR più elevato durante il periodo di previsione.
- In base all'applicazione, il mercato della fatturazione elettronica è suddiviso in B2B, B2C e B2G. Il segmento B2G deteneva la quota maggiore del mercato globale della fatturazione elettronica e si prevede che il segmento B2B sarà quello in più rapida crescita nel periodo di previsione.
Analisi della quota di mercato della fatturazione elettronica per area geografica
Il mercato della fatturazione elettronica è segmentato in cinque regioni principali: Nord America, Europa, Asia-Pacifico (APAC), Medio Oriente e Africa (MEA) e America meridionale e centrale. Il Nord America deteneva la quota di mercato della fatturazione elettronica maggiore nel 2023. In termini di quota di mercato, Europa, America meridionale e centrale e APAC si sono classificati rispettivamente al secondo, terzo e quarto posto nel 2023. L'Europa è un altro mercato cruciale per la fatturazione elettronica. Di recente, l'Italia è diventata il primo Paese in Europa a rendere obbligatoria la fatturazione elettronica per contrastare la frode e l'evasione fiscale, nonché per aumentare l'efficienza del sistema fiscale. Si prevede che anche altri paesi europei seguiranno l'esempio dell'Italia e adotteranno la fatturazione elettronica, dando un impulso positivo al mercato.Mercato della fatturazione elettronicaLe tendenze e i fattori regionali che influenzano il mercato della fatturazione elettronica durante il periodo di previsione sono stati ampiamente spiegati dagli analisti di The Insight Partners. Questa sezione analizza anche i segmenti e la distribuzione geografica del mercato della fatturazione elettronica in Nord America, Europa, Asia-Pacifico, Medio Oriente e Africa, America Meridionale e Centrale.
Ambito del rapporto sul mercato della fatturazione elettronica
| Attributo del rapporto | Dettagli |
|---|---|
| Dimensioni del mercato in 2023 | US$ 12.47 Billion |
| Dimensioni del mercato per 2031 | US$ 62.68 Billion |
| CAGR globale (2023 - 2031) | 22.4% |
| Dati storici | 2021-2022 |
| Periodo di previsione | 2024-2031 |
| Segmenti coperti |
By Distribuzione
|
| Regioni e paesi coperti |
Nord America
|
| Leader di mercato e profili aziendali chiave |
|
Densità degli operatori del mercato della fatturazione elettronica: comprendere il suo impatto sulle dinamiche aziendali
Il mercato della fatturazione elettronica è in rapida crescita, trainato dalla crescente domanda degli utenti finali, dovuta a fattori quali l'evoluzione delle preferenze dei consumatori, i progressi tecnologici e una maggiore consapevolezza dei vantaggi del prodotto. Con l'aumento della domanda, le aziende stanno ampliando la propria offerta, innovando per soddisfare le esigenze dei consumatori e sfruttando le tendenze emergenti, alimentando ulteriormente la crescita del mercato.
- Ottieni il Mercato della fatturazione elettronica Panoramica dei principali attori chiave
Notizie e sviluppi recenti sul mercato della fatturazione elettronica
Il mercato della fatturazione elettronica viene valutato raccogliendo dati qualitativi e quantitativi a seguito di ricerche primarie e secondarie, che includono importanti pubblicazioni aziendali, dati di associazioni e database. Di seguito è riportato un elenco degli sviluppi nel mercato della fatturazione elettronica:- Nel 2021, Coupa Software, uno dei leader nella gestione della spesa aziendale (BSM), ha annunciato di essere diventata membro ufficiale dell'E-Invoice Promotion Association (EIPA), un'organizzazione che sviluppa, dimostra e promuove le specifiche standard delle fatture elettroniche. (Fonte: Coupa Software, comunicato stampa)
- Nel 2024, Basware, leader mondiale nell'automazione della contabilità fornitori e nell'elaborazione delle fatture, ha annunciato importanti piani di espansione globale, con un aumento delle prenotazioni del 52% e un'accelerazione della crescita dei ricavi ricorrenti su base annua (YoY) nel 2023. (Fonte: Sweco AB, comunicato stampa)
- Nel 2023, Toyota Boshoku Asia ha firmato un contratto con Comarch per l'implementazione della fatturazione elettronica in Thailandia. Comarch supporterà Toyota Boshoku Asia nell'implementazione di una soluzione di fatturazione elettronica per la preparazione, la consegna e l'archiviazione di documenti digitali, con firme digitali per fatture e ricevute fiscali conformi alle condizioni e ai requisiti dell'Agenzia delle Entrate thailandese. (Fonte: Toyota Boshoku, comunicato stampa)
Copertura e risultati del rapporto sul mercato della fatturazione elettronica
Il rapporto "Dimensioni e previsioni del mercato della fatturazione elettronica (2022-2030)" fornisce un'analisi dettagliata del mercato che copre le aree menzionate di seguito:- Dimensioni e previsioni del mercato della fatturazione elettronica a livello globale, regionale e nazionale per tutti i segmenti di mercato chiave coperti dall'ambito
- Dinamiche del mercato della fatturazione elettronica come driver, restrizioni e opportunità chiave
- Principali tendenze future nel mercato della fatturazione elettronica
- Analisi dettagliata delle cinque forze di Porter e SWOT
- Analisi del mercato globale e regionale che copre le principali tendenze del mercato, i principali attori, le normative e i recenti sviluppi del mercato
- Analisi del panorama del settore e della concorrenza che copre la concentrazione del mercato, l'analisi della mappa termica, gli attori principali e i recenti sviluppi nel mercato della fatturazione elettronica
- Profili aziendali dettagliati

Ankita è una dinamica professionista della ricerca di mercato e della consulenza con oltre 8 anni di esperienza nei settori della tecnologia, dei media, dell'ICT, dell'elettronica e dei semiconduttori. Ha guidato e portato a termine con successo oltre 100 incarichi di consulenza e ricerca per clienti globali come Microsoft, Oracle, NEC Corporation, SAP, KPMG ed Expeditors International. Le sue competenze principali includono la valutazione del mercato, l'analisi dei dati, le previsioni, la formulazione di strategie, l'intelligence competitiva e la redazione di report.
Ankita è esperta nella gestione di cicli di progetto completi, dalla progettazione di proposte pre-vendita e discussioni con i clienti fino alla fornitura di insight fruibili post-vendita. È esperta nella gestione di team interfunzionali, nella strutturazione di moduli di ricerca complessi e nell'allineamento delle soluzioni agli obiettivi aziendali specifici del cliente. Le sue eccellenti capacità di comunicazione, leadership e presentazione le hanno permesso di fornire costantemente risultati orientati al valore in contesti di mercato in rapida evoluzione.
- Analisi completa delle dimensioni e delle previsioni di mercato
- Analisi dettagliata della segmentazione
- Valutazione approfondita delle dinamiche di mercato
- Approfondimenti a livello regionale e nazionale
- Analisi del panorama competitivo e benchmarking aziendale
- Business intelligence strategica
Testimonianze
Il report di mercato sui sistemi SCADA di Insight Partners è completo, con preziosi spunti sulle tendenze attuali e sulle previsioni future. Il team si è dimostrato altamente professionale, reattivo e disponibile in ogni fase del progetto. Siamo molto soddisfatti e consigliamo vivamente i loro servizi.
RAN KEDEM Partner, Reali Technologies LTDsHo richiesto un report su un mercato software molto specifico e il team lo ha prodotto in pochi giorni. Le informazioni erano molto pertinenti e ben presentate. Ho quindi richiesto alcune modifiche e aggiunte al report. Il team è stato ancora una volta molto reattivo e ho ricevuto il report finale in meno di una settimana.
JEAN-HERVE JENN Presidente, Future AnalyticaAbbiamo collaborato con The Insight Partners per un importante studio di mercato e una previsione. Ci hanno fornito informazioni chiare su opportunità e rischi, che ci hanno aiutato a definire i nostri piani. La loro ricerca è stata facile da usare e basata su dati solidi. Ci ha aiutato a prendere decisioni intelligenti e consapevoli. Li consigliamo vivamente.
PIYUSH NAGPAL Vicepresidente senior, Abbaglianti globaliInsight Partners ha fornito ricerche di mercato approfondite e ben strutturate, con una solida competenza nel settore. Il loro team si è dimostrato professionale e reattivo in ogni fase. Il sito web intuitivo ha reso l'accesso ai report di settore semplice e immediato. Li consigliamo vivamente per servizi di ricerca affidabili e di alta qualità.
YUKIHIKO ADACHI Amministratore delegato, Deep Blue, LLC.Questa è la prima volta che acquisto un report di mercato da The Insight Partners. Sebbene inizialmente fossi indeciso, ho visitato il loro sito web e mi sono sentito più a mio agio nell'acquistare un report di mercato. Sono completamente soddisfatto della qualità del report e del servizio clienti. Avevo diverse domande e commenti sul report iniziale, ma dopo un paio di conversazioni via email con il loro analista credo di avere un report che posso utilizzare come input per il nostro processo di pianificazione strategica. Grazie mille per aver dedicato del tempo extra e aver reso questa esperienza positiva. Consiglierò sicuramente il vostro servizio ad altri e sarete la mia prima persona a cui rivolgermi quando avremo bisogno di ulteriori dati di mercato.
GIOVANNI SUZUKI Presidente e Amministratore Delegato, Consigliere di Amministrazione, Tecnologie BKDesidero esprimere la mia gratitudine per il supporto e la professionalità dimostrati nel rispondere alla mia richiesta di informazioni sul mercato dei dispositivi medici in vitro per malattie infettive in Nigeria. Apprezzo la vostra pazienza, la vostra guida e la vostra disponibilità a offrirmi uno sconto, che alla fine ci ha permesso di concludere l'affare. Non vedo l'ora di collaborare con The Insight Partners in futuro, grazie anche all'impressione che mi avete lasciato dopo questo primo incontro.
Dott. Chijioke AMMINISTRATORE DELEGATO DI ONYIA, PineCrest Healthcare Ltd.Motivo dell'acquisto
- Processo decisionale informato
- Comprensione delle dinamiche di mercato
- Analisi competitiva
- Analisi dei clienti
- Previsioni di mercato
- Mitigazione del rischio
- Pianificazione strategica
- Giustificazione degli investimenti
- Identificazione dei mercati emergenti
- Miglioramento delle strategie di marketing
- Aumento dell'efficienza operativa
- Allineamento alle tendenze normative


