
Stratégies de marché de la facturation électronique, principaux acteurs, opportunités de croissance, analyse et prévisions d’ici 2031
Taille et prévisions du marché de la facturation électronique (2021-2031), parts mondiales et régionales, tendances et opportunités de croissance. Rapport d'analyse : par déploiement (sur site, cloud), utilisateur final (commerce de détail et e-commerce, administrations publiques, informatique et télécommunications, BFSI, autres), application (B2B, B2C, B2G), type (factures hors bon de commande, factures avec bon de commande) et géographie (Amérique du Nord, Europe, Asie-Pacifique, Moyen-Orient et Afrique, Amérique du Sud et centrale).
- Statut : Publié
- Code du rapport : TIPRE00009392
- Catégorie : Technologie, médias et télécommunications
- Nombre de pages : 179
- Formats de rapport disponibles :


- Date de dernière mise à jour : June 19, 2025

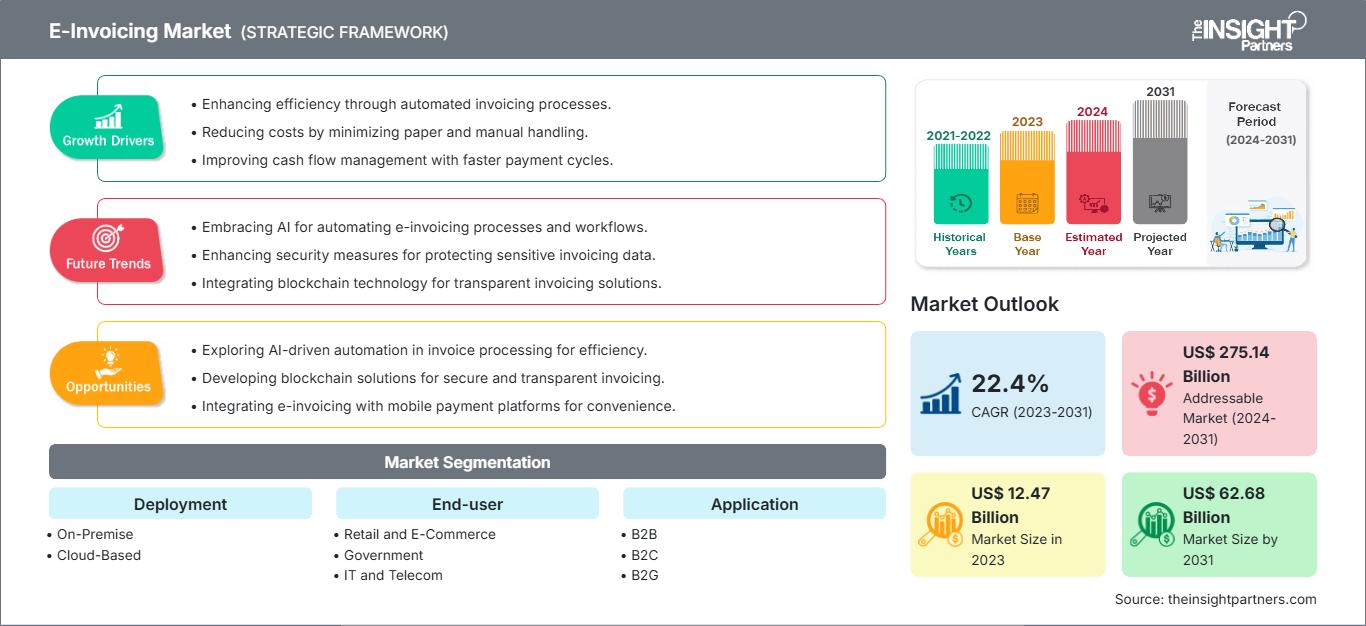
La taille du marché de la facturation électronique devrait atteindre 62,68 milliards de dollars américains d'ici 2031, contre 12,47 milliards de dollars américains en 2023. Le marché devrait enregistrer un TCAC de 22,4 % entre 2023 et 2031.
Le rapport inclut les perspectives de croissance à la lumière des tendances actuelles du marché de la facturation électronique et des facteurs déterminants qui influencent la croissance du marché.
Analyse du marché de la facturation électronique
La demande croissante de solutions numériques pour lutter contre l'évasion fiscale et la fraude financière parmi les organisations gouvernementales et les autorités fiscales stimule la croissance des mandats de facturation électronique dans divers pays. Diverses initiatives de soutien prises par des organisations et associations gouvernementales, telles que l’Association européenne des prestataires de services de facturation électronique (EESPA), le CEN, l’UN/CEFACT, OpenPEPPOL et GS1, jouent un rôle crucial dans le développement de normes/cadres/formats de facturation électronique et dans l’adoption de la facturation électronique dans tous les pays. En termes d'adoption de la facturation électronique, le Brésil, le Chili et le Mexique sont les leaders du marché, suivis par des pays comme l'Italie, qui a rendu la facturation électronique obligatoire en 2019. La mise en œuvre réussie de la facturation électronique dans ces pays et ses avantages incitent d'autres pays, comme la Bolivie, la France, la Colombie, le Guatemala, la Chine, l'Inde, le Kirghizistan, l'Ouzbékistan, le Vietnam, la Croatie, l'Estonie, la Serbie et le Portugal, à mettre en œuvre des mandats de facturation électronique.Aperçu du marché de la facturation électronique
La facturation électronique est un marché en pleine croissance avec une adoption croissante dans divers segments tels que le commerce interentreprises (B2B), le commerce interentreprises-clients (B2C) et le commerce interentreprises-gouvernement (B2G). La facturation électronique fait exclusivement référence à l'échange de factures électroniques entre acheteurs et fournisseurs. Différents pays définissent la facturation électronique différemment en fonction des réglementations et de la nature des entreprises en vigueur dans certains pays. Pour l'échange de factures électroniques, différents modèles sont utilisés dans différents secteurs : le modèle direct fournisseur, le modèle direct acheteur, le modèle SaaS/PaaS, le modèle réseau, le modèle Four Corner, le modèle multicloud et le modèle cloud hybride. Partout dans le monde, les entreprises échangent des factures électroniques directement avec leurs clients ou font appel à des prestataires tiers. La tendance croissante à la numérisation de divers documents pour un traitement efficace et le respect des exigences de conformité accélère la transition des factures papier manuelles vers les factures électroniques à l'échelle mondiale.Vous bénéficierez d’une personnalisation sur n’importe quel rapport - gratuitement - y compris des parties de ce rapport, ou une analyse au niveau du pays, un pack de données Excel, ainsi que de profiter d’offres exceptionnelles et de réductions pour les start-ups et les universités
Marché de la facturation électronique: Perspectives stratégiques
-
Obtenez les principales tendances clés du marché de ce rapport.Cet échantillon GRATUIT comprendra une analyse de données, allant des tendances du marché aux estimations et prévisions.
Augmentation de la demande de solutions cloud
Le cloud computing devient le moteur de la transformation numérique dans tous les secteurs. La demande de solutions cloud dans les entreprises croît à un rythme sans précédent en raison des avantages offerts par ces solutions par rapport au déploiement sur site. Les principaux avantages des solutions cloud sont la facilité de déploiement, l'interopérabilité, les économies de coûts, la grande efficacité et les fonctionnalités à la demande. Des services tels que l'infrastructure en tant que service (IaaS) et le logiciel en tant que service (SaaS) connaissent une croissance rapide. Cependant, l'adoption de solutions cloud varie selon les zones géographiques et les entreprises, en fonction de facteurs tels que l'environnement réglementaire et les scénarios concurrentiels. La demande de solutions cloud est élevée dans les petites et moyennes entreprises en raison des avantages financiers liés à ces solutions. La plupart des grandes organisations utilisent encore des solutions sur site, car la mise en œuvre de nouveaux processus au sein des grandes organisations et de leurs réseaux est une tâche complexe qui nécessite une modification des pratiques de travail traditionnelles.Analyse de segmentation du rapport sur le marché de la facturation électronique
Les principaux segments ayant contribué à l'élaboration de l'analyse du marché de la facturation électronique sont le déploiement, l'utilisateur final, l'application et le type.- Par modèle de déploiement, le marché de la facturation électronique est segmenté en cloud et sur site. En 2023, le segment cloud détenait une part de marché plus importante de la facturation électronique grâce à des avantages tels que la facilité de mise en œuvre, les économies de coûts et la flexibilité opérationnelle.
- Selon l'utilisateur final, le marché est segmenté en commerce de détail et e-commerce, administration publique, informatique et télécommunications, BFSI, etc. Le segment administration publique détenait la plus grande part de marché de la facturation électronique en 2023.
- Selon le type, le marché de la facturation électronique est segmenté en factures avec bon de commande et factures sans bon de commande. En 2023, le segment des factures sans bon de commande a dominé le marché avec une part de marché plus importante et devrait enregistrer un TCAC plus élevé au cours de la période de prévision.
- Selon l'application, le marché de la facturation électronique est classé en B2B, B2C et B2G. Français Le segment B2G détenait la plus grande part du marché mondial de la facturation électronique, et le segment B2B devrait être le segment qui connaîtra la croissance la plus rapide au cours de la période de prévision.
Analyse des parts de marché de la facturation électronique par zone géographique
Le marché de la facturation électronique est segmenté en cinq grandes régions : l'Amérique du Nord, l'Europe, l'Asie-Pacifique (APAC), le Moyen-Orient et l'Afrique (MEA), et l'Amérique du Sud et l'Amérique centrale. L'Amérique du Nord détenait la plus grande part de marché de la facturation électronique en 2023. En termes de parts de marché, l'Europe, l'Amérique du Sud et l'Amérique centrale, ainsi que l'APAC occupaient respectivement la deuxième, la troisième et la quatrième place en 2023. L'Europe est un autre marché crucial pour la facturation électronique. Récemment, l'Italie est devenue le premier pays d'Europe à imposer la facturation électronique pour lutter contre la fraude et l'évasion fiscales, ainsi que pour accroître l'efficacité du système fiscal. D'autres pays européens devraient également suivre l'exemple de l'Italie et adopter la facturation électronique, ce qui stimulera positivement le marché.Marché de la facturation électronique
Les tendances et facteurs régionaux influençant le marché de la facturation électronique tout au long de la période de prévision ont été analysés en détail par les analystes de The Insight Partners. Cette section aborde également les segments et la répartition géographique du marché de la facturation électronique en Amérique du Nord, en Europe, en Asie-Pacifique, au Moyen-Orient et en Afrique, ainsi qu'en Amérique du Sud et en Amérique centrale.
Portée du rapport sur le marché de la facturation électronique| Attribut de rapport | Détails |
|---|---|
| Taille du marché en 2023 | US$ 12.47 Billion |
| Taille du marché par 2031 | US$ 62.68 Billion |
| TCAC mondial (2023 - 2031) | 22.4% |
| Données historiques | 2021-2022 |
| Période de prévision | 2024-2031 |
| Segments couverts |
By Déploiement
|
| Régions et pays couverts |
Amérique du Nord
|
| Leaders du marché et profils d'entreprises clés |
|
Densité des acteurs du marché de la facturation électronique : comprendre son impact sur la dynamique des entreprises
Le marché de la facturation électronique connaît une croissance rapide, portée par une demande croissante des utilisateurs finaux, due à des facteurs tels que l'évolution des préférences des consommateurs, les avancées technologiques et une meilleure connaissance des avantages du produit. Face à cette demande croissante, les entreprises élargissent leur offre, innovent pour répondre aux besoins des consommateurs et capitalisent sur les nouvelles tendances, ce qui alimente la croissance du marché.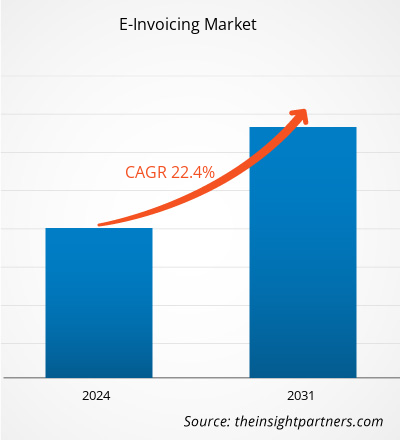
- Obtenez le Marché de la facturation électronique Aperçu des principaux acteurs clés
Actualités et développements récents du marché de la facturation électronique
Le marché de la facturation électronique est évalué en collectant des données qualitatives et quantitatives issues de recherches primaires et secondaires, notamment d'importantes publications d'entreprises, de données d'associations et de bases de données. Voici une liste des évolutions du marché de la facturation électronique :- En 2021, Coupa Software, l'un des leaders de la gestion des dépenses d'entreprise (BSM), a annoncé être devenu membre officiel de l'E-Invoice Promotion Association (EIPA), une organisation qui développe, démontre et promeut les spécifications standard des factures électroniques. (Source : Coupa Software, communiqué de presse)
- En 2024, Basware, leader mondial de l'automatisation des comptes fournisseurs et du traitement des factures, a annoncé d'importants plans d'expansion mondiale, les réservations ayant augmenté de 52 % et la croissance des revenus récurrents s'étant accélérée d'une année sur l'autre (YoY) en 2023. (Source : Sweco AB, communiqué de presse)
- En 2023, Toyota Boshoku Asia a signé un contrat avec Comarch pour la mise en œuvre de la facturation électronique en Thaïlande. Comarch accompagnera Toyota Boshoku Asia dans la mise en place d'une solution de facturation électronique pour la préparation, la livraison et le stockage de documents numériques, avec des signatures numériques pour les factures et reçus fiscaux conformes aux conditions et exigences du ministère des Finances thaïlandais. (Source : Toyota Boshoku, communiqué de presse)
Couverture et livrables du rapport sur le marché de la facturation électronique
Le rapport « Taille et prévisions du marché de la facturation électronique (2022-2030) » fournit une analyse détaillée du marché couvrant les domaines mentionnés ci-dessous :- Taille et prévisions du marché de la facturation électronique aux niveaux mondial, régional et national pour tous les segments de marché clés couverts par le rapport
- Dynamique du marché de la facturation électronique, notamment les moteurs, les contraintes et les principales opportunités
- Principales tendances futures du marché de la facturation électronique
- Analyse détaillée des cinq forces PEST/Porter et SWOT
- Analyse du marché mondial et régional couvrant les principales tendances du marché, les principaux acteurs, les réglementations et les développements récents du marché
- Analyse du paysage industriel et de la concurrence couvrant la concentration du marché, l'analyse des cartes thermiques, les principaux acteurs et les développements récents du marché de la facturation électronique
- Détaillée profils d'entreprise

Ankita est une professionnelle dynamique des études de marché et du conseil, forte de plus de 8 ans d'expérience dans les secteurs des technologies, des médias, des TIC, de l'électronique et des semi-conducteurs. Elle a dirigé et réalisé avec succès plus de 100 missions de conseil et d'études pour des clients internationaux tels que Microsoft, Oracle, NEC Corporation, SAP, KPMG et Expeditors International. Ses compétences clés incluent l'analyse de marché, l'analyse de données, la prévision, la formulation de stratégies, la veille concurrentielle et la rédaction de rapports.
Ankita maîtrise parfaitement la gestion de cycles de projet complets, de la conception de propositions avant-vente et des discussions avec les clients jusqu'à la fourniture d'informations exploitables après-vente. Elle maîtrise la gestion d'équipes transverses, la structuration de modules d'études complexes et l'alignement des solutions sur les objectifs commerciaux spécifiques de chaque client. Ses excellentes compétences en communication, leadership et présentation lui ont permis de fournir systématiquement des résultats à forte valeur ajoutée dans des environnements de marché dynamiques et en constante évolution.
- Analyse complète de la taille du marché et prévisions
- Analyse détaillée de la segmentation
- Évaluation approfondie de la dynamique du marché
- Aperçus par région et par pays
- Paysage concurrentiel et analyse comparative des entreprises
- Intelligence économique stratégique
Témoignages
Le rapport sur le marché des systèmes SCADA d'Insight Partners est complet et fournit des informations précieuses sur les tendances actuelles et les prévisions. L'équipe a fait preuve d'un grand professionnalisme, d'une grande réactivité et d'un grand soutien tout au long du projet. Nous sommes très satisfaits et recommandons vivement leurs services.
RAN KEDEM Partenaire, Reali Technologies LTDJ'ai demandé un rapport sur un marché logiciel très spécifique et l'équipe l'a produit en quelques jours. Les informations étaient très pertinentes et bien présentées. J'ai ensuite demandé des modifications et des ajouts au rapport. L'équipe a de nouveau été très réactive et j'ai reçu le rapport final en moins d'une semaine.
JEAN-HERVÉ JENN Président, Future AnalyticaNous avons collaboré avec The Insight Partners pour une importante étude de marché et des prévisions. Ils nous ont fourni une vision claire des opportunités et des risques, ce qui nous a aidés à élaborer nos plans. Leurs recherches étaient faciles à utiliser et basées sur des données solides. Elles nous ont permis de prendre des décisions éclairées et en toute confiance. Nous les recommandons vivement.
PIYUSH NAGPAL Vice-président principal, Feux de route mondiauxInsight Partners a réalisé une étude de marché pertinente et bien structurée, avec une solide expertise du domaine. Son équipe a fait preuve de professionnalisme et de réactivité tout au long du projet. Son site web convivial a facilité l'accès aux rapports sectoriels. Nous recommandons vivement ses services d'études fiables et de haute qualité.
YUKIHIKO ADACHI PDG, Bleu profond, LLC.C'est la première fois que j'achète une étude de marché auprès de The Insight Partners. J'étais un peu hésitant au début, mais j'ai consulté leur site web et me suis senti plus à l'aise pour prendre le risque d'acheter une étude de marché. Je suis entièrement satisfait de la qualité du rapport et du service client. J'avais plusieurs questions et commentaires concernant le rapport initial, mais après quelques échanges par e-mail avec leur analyste, je pense avoir obtenu un rapport qui pourra alimenter notre processus de planification stratégique. Merci beaucoup pour votre temps et pour avoir rendu cette expérience positive. Je recommanderai sans hésiter vos services et vous serez mon premier contact lorsque nous aurons besoin de données de marché supplémentaires.
JOHN SUZUKI Président-directeur général, administrateur du conseil d'administration, BK TechnologiesJe tiens à vous remercier pour votre soutien et le professionnalisme dont vous avez fait preuve lors du traitement de ma demande d'informations concernant le marché des dispositifs de diagnostic in vitro (DIV) pour les maladies infectieuses au Nigéria. J'apprécie votre patience, vos conseils et votre volonté d'offrir une réduction, ce qui nous a finalement permis de conclure un accord. Je me réjouis de collaborer à nouveau avec The Insight Partners, grâce à l'impression que vous m'avez laissée suite à cette première rencontre.
DR CHIJIOKE DIRECTEUR GÉNÉRAL D'ONYIA, PineCrest Healthcare Ltd.Raison d'acheter
- Prise de décision éclairée
- Compréhension de la dynamique du marché
- Analyse concurrentielle
- Connaissances clients
- Prévisions de marché
- Atténuation des risques
- Planification stratégique
- Justification des investissements
- Identification des marchés émergents
- Amélioration des stratégies marketing
- Amélioration de l'efficacité opérationnelle
- Alignement sur les tendances réglementaires


