Equipo de calidad de energía Crecimiento del mercado, tamaño, participación, tendencias, análisis de jugadores clave y pronóstico hasta 2031
Tamaño y pronóstico del mercado de equipos de calidad de energía (2021-2031), participación global y regional, tendencias y análisis de oportunidades de crecimiento. Cobertura del informe: por equipo (sistema de alimentación ininterrumpida (SAI), filtros armónicos, compensador estático VAR, medidores de calidad de energía, otros), fase (monofásica, trifásica), usuarios finales (industrial y manufacturero, comercial y otros) y geografía.
- Estado : Datos publicados
- Código de informe : TIPRE00023328
- Categoría : Electrónica y semiconductores
- Número de páginas : 150
- Formatos de informe disponibles :


- Fecha de última actualización : August 07, 2025


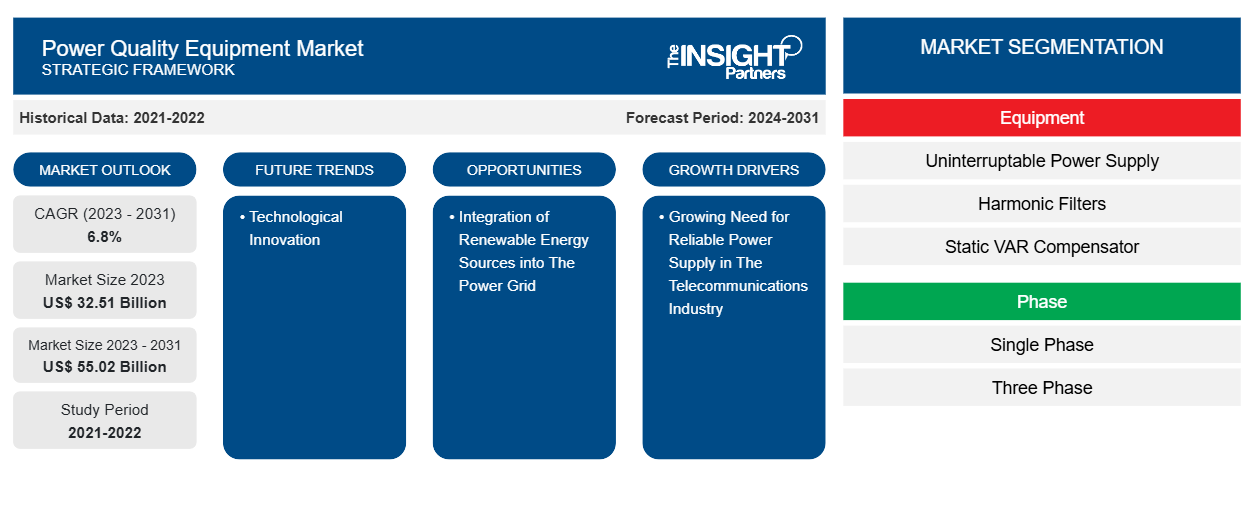
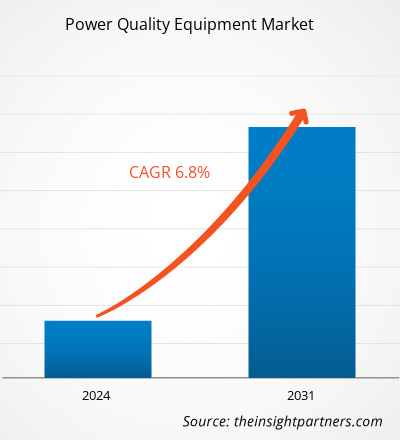
Se proyecta que el tamaño del mercado de equipos de calidad de energía alcance los 55.020 millones de dólares estadounidenses en 2031, frente a los 32.510 millones de dólares estadounidenses en 2023. Se espera que el mercado registre una CAGR del 6,8 % durante el período 2023-2031. Es probable que la innovación tecnológica siga siendo una tendencia clave en el mercado.
Análisis del mercado de equipos de calidad de energía
La demanda mundial de electricidad está aumentando debido al rápido crecimiento de las industrias de procesamiento y fabricación. El aumento del consumo de electricidad también está siendo impulsado por las industrias del transporte, la atención médica, los negocios y la vivienda. El aumento de la población, el aumento de los ingresos disponibles y la creciente digitalización en Asia Pacífico están provocando que los consumidores prefieran cada vez más comprar y pagar en línea.
Descripción general del mercado de equipos de calidad de energía
Varios gobiernos de la zona están fomentando el desarrollo de sus sectores manufactureros. Por ejemplo, el gobierno indio lanzó el programa "Make in India" para promover que las empresas nacionales e internacionales establezcan sus plantas de fabricación en la India y mejoren la infraestructura de fabricación en el país. De la misma manera, el gobierno chino implementó el plan "Made in China 2025" para mejorar la industria manufacturera del país y posicionarse como el principal mercado a nivel mundial. Las tendencias mencionadas están provocando un aumento en el uso de equipos de calidad de energía para mantener un suministro de energía estable en las industrias, lo que en última instancia protege el hardware de los daños relacionados con las fluctuaciones de energía. Además, la creciente demanda del mercado de equipos de calidad de energía se está fortaleciendo por el crecimiento continuo de las industrias de procesamiento impulsadas por la mayor necesidad de bienes de consumo de rápida rotación.
Personalice este informe según sus necesidades
Obtendrá personalización en cualquier informe, sin cargo, incluidas partes de este informe o análisis a nivel de país, paquete de datos de Excel, así como también grandes ofertas y descuentos para empresas emergentes y universidades.
Mercado de equipos de calidad de energía: perspectivas estratégicas
-
Obtenga las principales tendencias clave del mercado de este informe.Esta muestra GRATUITA incluirá análisis de datos, desde tendencias del mercado hasta estimaciones y pronósticos.
Factores impulsores y oportunidades del mercado de equipos de calidad de energía
La creciente necesidad de un suministro de energía confiable en la industria de las telecomunicaciones impulsará el crecimiento del mercado
La infraestructura de telecomunicaciones ha evolucionado rápidamente en los últimos años. Esta infraestructura de telecomunicaciones moderna incluye sistemas actualizados como centros de datos, servidores e infraestructura relacionada con Internet, junto con equipos para proporcionar de manera eficiente servicios de transmisión de voz y datos. Sin embargo, los sistemas de comunicación contemporáneos enfrentan una mayor susceptibilidad a problemas de energía debido a que los componentes electrónicos utilizados para la transmisión de datos son más propensos a caídas/bajadas de voltaje, subidas, transitorios y armónicos. Un dispositivo de telecomunicaciones puede verse afectado por fluctuaciones de energía resultantes de aumentos repentinos en las cargas, como caídas y subidas de voltaje, que son causadas por cortocircuitos, conexiones sueltas, fallas y el arranque de motores. Estos escenarios resultan en interrupciones de comunicación y pérdidas financieras para las empresas de telecomunicaciones, así como posibles fallas y mal funcionamiento de los equipos. Para abordar este obstáculo, las empresas de telecomunicaciones están implementando dispositivos de calidad de energía para mantener un suministro de voltaje constante dentro de un rango específico.
Incorporación de recursos energéticos renovables a la red eléctrica
La integración exitosa de la energía renovable depende en gran medida del mantenimiento de una alta calidad de la energía. Un desafío clave en este contexto es la ocurrencia de fluctuaciones de voltaje y frecuencia resultantes de la naturaleza impredecible de las fuentes de energía renovable . El uso de dispositivos electrónicos de potencia en la generación de energía renovable también contribuye a los problemas de calidad de la energía, incluida la generación de armónicos. Como resultado, existe una perspectiva optimista para la expansión del mercado de equipos de calidad de la energía, ya que desempeña un papel vital en la prevención del mal funcionamiento de los equipos eléctricos debido a desequilibrios de carga. Además, la industria de alimentos y bebidas ha experimentado un crecimiento sustancial en los últimos años. Factores como el aumento de las preocupaciones por la salud, la urbanización y las iniciativas gubernamentales globales han impulsado la creciente popularidad de los alimentos envasados y los productos lácteos.
Informe de mercado de equipos de calidad de energía Análisis de segmentación
Los segmentos clave que contribuyeron a la derivación del análisis del mercado de equipos de calidad de energía son el equipo, la fase y los usuarios finales.
- Según el equipamiento, el mercado se segmenta en sistemas de alimentación ininterrumpida (SAI), filtros armónicos, compensadores estáticos VAR, medidores de calidad de energía y otros. El segmento de sistemas de alimentación ininterrumpida (SAI) tuvo una participación de mercado significativa en 2023.uninterruptable power supply (UPS), harmonic filters, static VAR compensators, power quality meters, and others. The uninterruptable power supply (UPS) segment held a significant market share in 2023.
- En términos de fases, el mercado se divide en uno monofásico y uno trifásico. El segmento monofásico tuvo una participación sustancial del mercado en 2023.
- En función de los usuarios finales, el mercado se segmenta en industrial y manufacturero, comercial y otros. El segmento industrial y manufacturero tuvo una participación de mercado significativa en 2023.
Análisis de la cuota de mercado de equipos de calidad de la energía por geografía
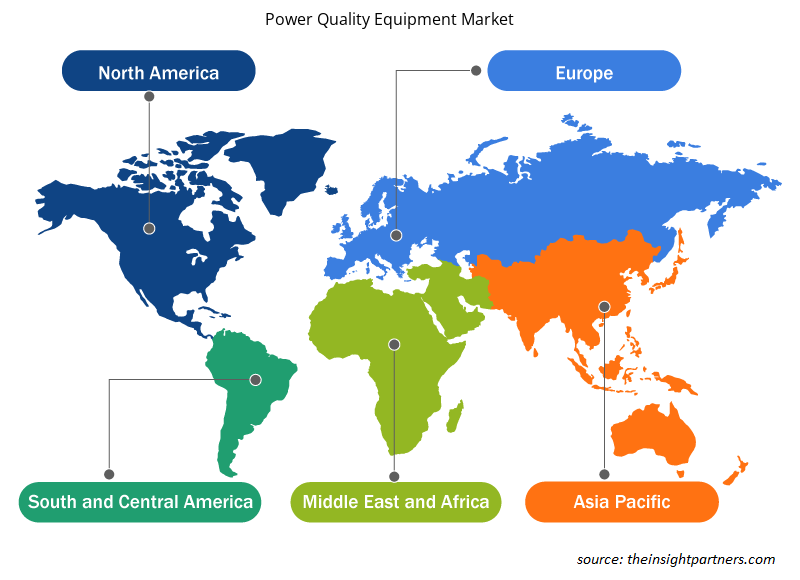
El alcance geográfico del informe del mercado de equipos de calidad de energía se divide en cinco regiones: América del Norte, Asia Pacífico, Europa, Medio Oriente y África, y América del Sur y Central.
En la región de Asia y el Pacífico, la industria manufacturera es crucial para impulsar las economías de muchos países, siendo China el principal contribuyente a la producción manufacturera mundial. Japón, India, Corea del Sur e Indonesia también son importantes contribuyentes a la región. Al mismo tiempo, se prevé que Vietnam, Malasia y Singapur aumenten su presencia en el mercado de esta industria en los próximos años. Esto pone de relieve la variedad de actividades manufactureras en la región de Asia y el Pacífico, lo que influye en la necesidad de equipos de calidad energética.
Perspectivas regionales del mercado de equipos de calidad de energía
Los analistas de Insight Partners explicaron en detalle las tendencias y los factores regionales que influyen en el mercado de equipos de calidad de la energía durante el período de pronóstico. Esta sección también analiza los segmentos y la geografía del mercado de equipos de calidad de la energía en América del Norte, Europa, Asia Pacífico, Medio Oriente y África, y América del Sur y Central.
- Obtenga datos regionales específicos para el mercado de equipos de calidad de energía
Alcance del informe de mercado de equipos de calidad de energía
| Atributo del informe | Detalles |
|---|---|
| Tamaño del mercado en 2023 | US$ 32,51 mil millones |
| Tamaño del mercado en 2031 | US$ 55.02 mil millones |
| CAGR global (2023 - 2031) | 6,8% |
| Datos históricos | 2021-2022 |
| Período de pronóstico | 2024-2031 |
| Segmentos cubiertos |
Por equipo
|
| Regiones y países cubiertos |
América del norte
|
| Líderes del mercado y perfiles de empresas clave |
|
Densidad de actores del mercado de equipos de calidad de energía: comprensión de su impacto en la dinámica empresarial
El mercado de equipos de calidad de energía está creciendo rápidamente, impulsado por la creciente demanda de los usuarios finales debido a factores como la evolución de las preferencias de los consumidores, los avances tecnológicos y una mayor conciencia de los beneficios del producto. A medida que aumenta la demanda, las empresas amplían sus ofertas, innovan para satisfacer las necesidades de los consumidores y aprovechan las tendencias emergentes, lo que impulsa aún más el crecimiento del mercado.
La densidad de actores del mercado se refiere a la distribución de las empresas o firmas que operan dentro de un mercado o industria en particular. Indica cuántos competidores (actores del mercado) están presentes en un espacio de mercado determinado en relación con su tamaño o valor total de mercado.
Las principales empresas que operan en el mercado de equipos de calidad de energía son:
- Acumentría
- Compañía Eléctrica Emerson
- Compañía AMETEK Inc.
- Comer
- Compañía General Electric
- Schneider Electric SE
Descargo de responsabilidad : Las empresas enumeradas anteriormente no están clasificadas en ningún orden particular.
- Obtenga una descripción general de los principales actores clave del mercado de equipos de calidad de energía
Noticias y desarrollos recientes del mercado de equipos de calidad de energía
El mercado de equipos de calidad de la energía se evalúa mediante la recopilación de datos cualitativos y cuantitativos posteriores a la investigación primaria y secundaria, que incluye publicaciones corporativas importantes, datos de asociaciones y bases de datos. A continuación, se enumeran algunos de los avances en el mercado de equipos de calidad de la energía:
- La empresa de gestión de energía Eaton (NYSE: ETN) anunció hoy que ha completado la adquisición de Tripp Lite. Con sede en Chicago, Illinois, Tripp Lite es un proveedor líder de productos de calidad de energía y soluciones de conectividad, incluidos sistemas de suministro de energía ininterrumpida monofásicos, unidades de distribución de energía en rack, protectores contra sobretensiones y gabinetes para centros de datos, mercados industriales, médicos y de comunicaciones en las Américas.
(Fuente: Eaton, comunicado de prensa, marzo de 2021)
Informe sobre el mercado de equipos de calidad de la energía: cobertura y resultados
El informe “Tamaño y pronóstico del mercado de equipos de calidad de energía (2021-2031)” proporciona un análisis detallado del mercado que cubre las siguientes áreas:
- Tamaño del mercado de equipos de calidad de energía y pronóstico a nivel global, regional y nacional para todos los segmentos clave del mercado cubiertos bajo el alcance
- Tendencias del mercado de equipos de calidad de energía, así como dinámica del mercado, como impulsores, restricciones y oportunidades clave
- Análisis detallado de las cinco fuerzas de Porter y PEST y FODA
- Análisis del mercado de equipos de calidad de energía que cubre las tendencias clave del mercado, el marco global y regional, los principales actores, las regulaciones y los desarrollos recientes del mercado.
- Análisis del panorama de la industria y de la competencia que abarca la concentración del mercado, el análisis de mapas de calor, los actores destacados y los desarrollos recientes del mercado de equipos de calidad de la energía
- Perfiles detallados de empresas

Naveen es un experimentado profesional en investigación de mercados y consultoría con más de 9 años de experiencia en proyectos personalizados, sindicados y de consultoría. Actualmente se desempeña como Vicepresidente Asociado, donde ha gestionado con éxito a las partes interesadas en toda la cadena de valor del proyecto y ha redactado más de 100 informes de investigación y más de 30 proyectos de consultoría. Su trabajo abarca proyectos industriales y gubernamentales, contribuyendo significativamente al éxito de los clientes y a la toma de decisiones basada en datos.
Naveen es licenciado en Ingeniería Electrónica y Comunicaciones por la VTU (Karnataka) y tiene un MBA en Marketing y Operaciones por la Universidad de Manipal. Ha sido miembro activo del IEEE durante 9 años, participando en conferencias, simposios técnicos y realizando voluntariado tanto a nivel de sección como regional. Antes de su puesto actual, trabajó como Consultor Estratégico Asociado en IndustryARC y como Consultor de Servidores Industriales en Hewlett Packard (HP Global).
- Análisis exhaustivo del tamaño del mercado y previsiones
- Análisis detallado de la segmentación
- Evaluación en profundidad de la dinámica del mercado
- Información a nivel regional y nacional
- Panorama competitivo y análisis comparativo de empresas
- Inteligencia empresarial estratégica
Testimonios
El informe de mercado de sistemas SCADA de Insight Partners es completo y ofrece información valiosa sobre las tendencias actuales y las previsiones futuras. El equipo fue altamente profesional, receptivo y me brindó un gran apoyo en todo momento. Estamos muy satisfechos y recomendamos ampliamente sus servicios.
RAN KEDEM Socio, Reali Technologies LTDsSolicité un informe sobre un mercado de software muy específico y el equipo lo elaboró en pocos días. La información era muy relevante y estaba bien presentada. Posteriormente, solicité algunos cambios y adiciones al informe. El equipo fue muy receptivo y recibí el informe final en menos de una semana.
JEAN-HERVE JENN Presidente, Future AnalyticaTrabajamos con The Insight Partners para un importante estudio y pronóstico de mercado. Nos brindaron una visión clara de las oportunidades y los riesgos, lo que nos ayudó a definir nuestros planes. Su investigación fue fácil de usar y se basó en datos sólidos. Nos ayudó a tomar decisiones inteligentes y seguras. Los recomendamos ampliamente.
PIYUSH NAGPAL Vicepresidente Sénior, , High Beam GlobalThe Insight Partners realizó una investigación de mercado profunda y bien estructurada con una sólida experiencia en el sector. Su equipo fue profesional y receptivo en todo momento. El sitio web, fácil de usar, facilitó el acceso a los informes del sector. Los recomendamos ampliamente por sus servicios de investigación confiables y de alta calidad.
YUKIHIKO ADACHI Director Ejecutivo, , Deep Blue, LLCEsta es la primera vez que compro un informe de mercado de The Insight Partners. Aunque al principio tenía dudas, visité su sitio web y me sentí más cómodo al arriesgarme y comprarlo. Estoy completamente satisfecho con la calidad del informe y el servicio al cliente. Tenía varias preguntas y comentarios sobre el informe inicial, pero después de un par de conversaciones por correo electrónico con su analista, creo que tengo un informe que puedo usar como base para nuestro proceso de planificación estratégica. Muchas gracias por tomarse el tiempo y hacer de esta una experiencia positiva. Sin duda, recomendaré sus servicios y serán mi primera opción cuando necesitemos más datos de mercado.
JOHN SUZUKI Presidente y Director Ejecutivo, Director de la Junta Directiva, BK TechnologiesAgradezco su apoyo y la profesionalidad que demostraron al atender mi solicitud de información sobre el mercado de diagnóstico in vitro (IVD) para enfermedades infecciosas en Nigeria. Agradezco su paciencia, su orientación y su disposición a ofrecerme un descuento, lo que finalmente nos permitió cerrar un trato. Espero poder colaborar con The Insight Partners en el futuro, gracias a la impresión que me causó este primer encuentro.
DRA. CHIJIOKE ONYIA, DIRECTORA GENERAL, PineCrest Healthcare Ltd.Razón para comprar
- Toma de decisiones informada
- Comprensión de la dinámica del mercado
- Análisis competitivo
- Información sobre clientes
- Pronósticos del mercado
- Mitigación de riesgos
- Planificación estratégica
- Justificación de la inversión
- Identificación de mercados emergentes
- Mejora de las estrategias de marketing
- Impulso de la eficiencia operativa
- Alineación con las tendencias regulatorias


