Crescita, dimensioni, quota, tendenze, analisi dei principali attori e previsioni del mercato delle apparecchiature per la qualità dell'energia fino al 2031
Dati storici : 2021-2022 | Anno base : 2023 | Periodo di previsione : 2024-2031Dimensioni e previsioni del mercato delle apparecchiature per la qualità dell'energia (2021-2031), quota globale e regionale, trend e opportunità di crescita. Copertura del rapporto di analisi: per apparecchiatura (gruppo di continuità (UPS), filtri armonici, compensatore VAR statico, misuratori della qualità dell'energia, altri), fase (monofase, trifase), utenti finali (industriali e manifatturieri, commerciali e altri) e area geografica.
- Stato : Dati rilasciati
- Codice del report : TIPRE00023328
- Categoria : Elettronica e semiconduttori
- Numero di pagine : 150
- Formati di report disponibili :


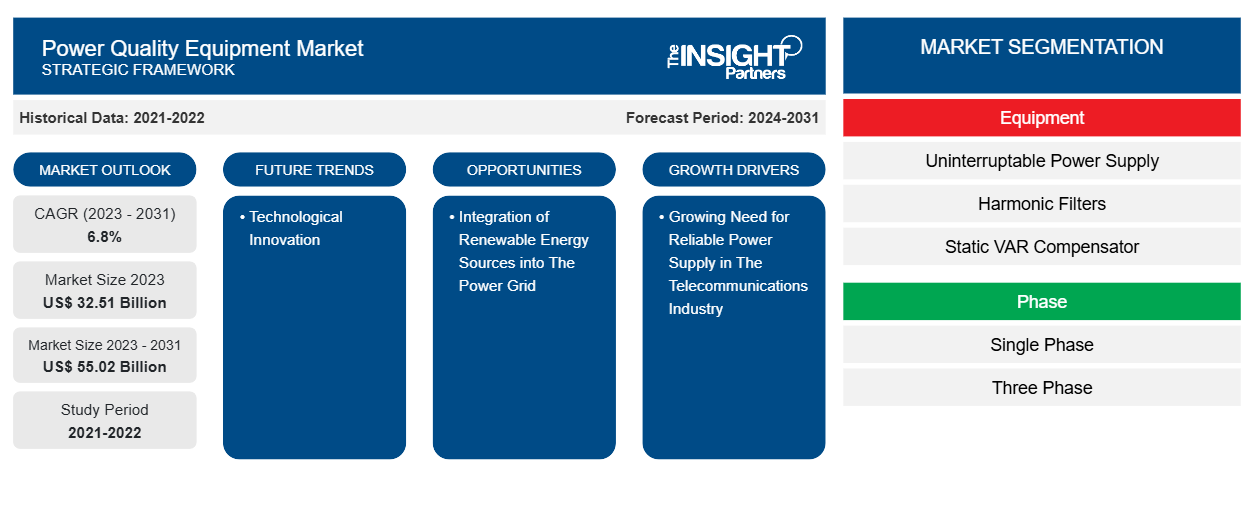
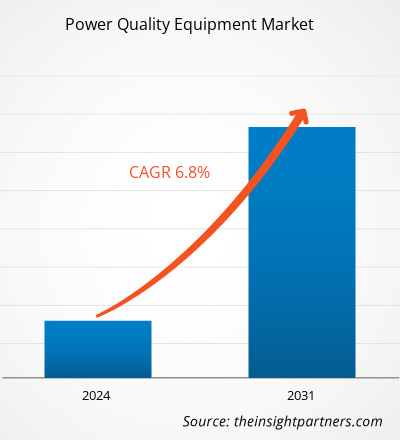
Si prevede che la dimensione del mercato delle apparecchiature per la qualità dell'energia raggiungerà i 55,02 miliardi di dollari entro il 2031, rispetto ai 32,51 miliardi di dollari del 2023. Si prevede che il mercato registrerà un CAGR del 6,8% nel periodo 2023-2031. È probabile che l'innovazione tecnologica rimanga una tendenza chiave nel mercato.CAGR of 6.8% during 2023–2031. Technological innovation is likely to remain a key trend in the market.
Analisi di mercato delle apparecchiature per la qualità dell'energia
La domanda globale di elettricità è in aumento a causa della rapida crescita delle industrie di trasformazione e produzione. L'aumento dell'uso di elettricità è anche guidato dai settori dei trasporti, dell'assistenza sanitaria, delle aziende e delle residenze. L'aumento della popolazione, il reddito disponibile più elevato e la crescente digitalizzazione nell'area Asia-Pacifico stanno spingendo i consumatori a preferire sempre di più l'acquisto e il pagamento online.digitalization in the Asia Pacific are causing consumers to increasingly favor buying and paying online.
Panoramica del mercato delle apparecchiature per la qualità dell'energia
Vari governi della zona stanno incoraggiando lo sviluppo dei loro settori manifatturieri. Ad esempio, il governo indiano ha lanciato il programma "Make in India" per promuovere sia le aziende nazionali che quelle internazionali a stabilire i loro impianti di produzione in India e migliorare l'infrastruttura manifatturiera nella nazione. Allo stesso modo, il governo cinese ha implementato il piano "Made in China 2025" per migliorare l'industria manifatturiera della nazione e posizionarsi come il mercato principale a livello mondiale. Le tendenze menzionate stanno causando un aumento nell'uso di apparecchiature di qualità dell'energia per mantenere un'alimentazione elettrica stabile nelle industrie, salvaguardando in ultima analisi l'hardware dai danni correlati alle fluttuazioni di potenza. Inoltre, la crescente domanda di mercato di apparecchiature di qualità dell'energia è rafforzata dalla continua crescita delle industrie di trasformazione, guidata dalla crescente necessità di beni di consumo in rapida evoluzione.
Personalizza questo report in base alle tue esigenze
Riceverai la personalizzazione gratuita di qualsiasi report, comprese parti di questo report, o analisi a livello nazionale, pacchetto dati Excel, oltre a usufruire di grandi offerte e sconti per start-up e università
Mercato delle apparecchiature per la qualità dell'energia: approfondimenti strategici
-
Scopri le principali tendenze di mercato in questo rapporto.Questo campione GRATUITO includerà analisi di dati che spaziano dalle tendenze di mercato alle stime e alle previsioni.
Driver e opportunità del mercato delle apparecchiature per la qualità dell'energia
Crescente necessità di alimentazione elettrica affidabile nel settore delle telecomunicazioni per guidare la crescita del mercato
L'infrastruttura delle telecomunicazioni si è evoluta rapidamente negli ultimi anni. Questa moderna infrastruttura delle telecomunicazioni include sistemi aggiornati come data center, server e infrastrutture correlate a Internet, insieme ad apparecchiature per fornire in modo efficiente servizi di trasmissione dati e voce. Tuttavia, i sistemi di comunicazione contemporanei affrontano una maggiore suscettibilità ai problemi di alimentazione a causa dei componenti elettronici utilizzati per la trasmissione dei dati che sono più inclini a cali/calo, sbalzi, transitori e armoniche. Un dispositivo di telecomunicazione può essere interrotto da fluttuazioni di potenza derivanti da improvvisi aumenti di carico, come cali e sbalzi di tensione, che sono causati da cortocircuiti, connessioni allentate, guasti e avviamento di motori. Questi scenari comportano interruzioni delle comunicazioni e perdite finanziarie per le società di telecomunicazioni, nonché potenziali malfunzionamenti e guasti delle apparecchiature. Per affrontare questo ostacolo, le società di telecomunicazioni stanno implementando dispositivi di qualità dell'alimentazione per mantenere un'alimentazione di tensione costante entro un intervallo specificato.
Incorporazione delle risorse energetiche rinnovabili nella rete elettrica
L'integrazione di successo delle energie rinnovabili si basa in modo significativo sul mantenimento di un'elevata qualità dell'energia. Una sfida fondamentale in questo contesto è il verificarsi di fluttuazioni di tensione e frequenza derivanti dalla natura imprevedibile delle fonti di energia rinnovabile . L'uso di dispositivi elettronici di potenza nella generazione di energia rinnovabile contribuisce anche a problemi di qualità dell'energia, inclusa la generazione di armoniche. Di conseguenza, vi è una prospettiva ottimistica per l'espansione del mercato delle apparecchiature per la qualità dell'energia, in quanto svolge un ruolo fondamentale nel prevenire il malfunzionamento delle apparecchiature elettriche dovuto a squilibri di carico. Inoltre, l'industria alimentare e delle bevande ha registrato una crescita sostanziale negli ultimi anni. Fattori come le crescenti preoccupazioni per la salute, l'urbanizzazione e le iniziative governative globali hanno guidato la crescente popolarità sia degli alimenti confezionati che dei prodotti lattiero-caseari.
Analisi della segmentazione del rapporto di mercato delle apparecchiature per la qualità dell'energia
I segmenti chiave che hanno contribuito alla derivazione dell'analisi di mercato delle apparecchiature per la qualità dell'energia sono le apparecchiature, la fase e gli utenti finali.
- In base all'attrezzatura, il mercato è segmentato in gruppi di continuità (UPS), filtri armonici, compensatori VAR statici, misuratori della qualità dell'alimentazione e altri. Il segmento dei gruppi di continuità (UPS) ha detenuto una quota di mercato significativa nel 2023.uninterruptable power supply (UPS), harmonic filters, static VAR compensators, power quality meters, and others. The uninterruptable power supply (UPS) segment held a significant market share in 2023.
- In termini di fase, il mercato è diviso in monofase e trifase. Il segmento monofase ha detenuto una quota sostanziale del mercato nel 2023.
- In base agli utenti finali, il mercato è segmentato in industriale e manifatturiero, commerciale e altri. Il segmento industriale e manifatturiero ha detenuto una quota di mercato significativa nel 2023.
Analisi della quota di mercato delle apparecchiature per la qualità dell'energia per area geografica
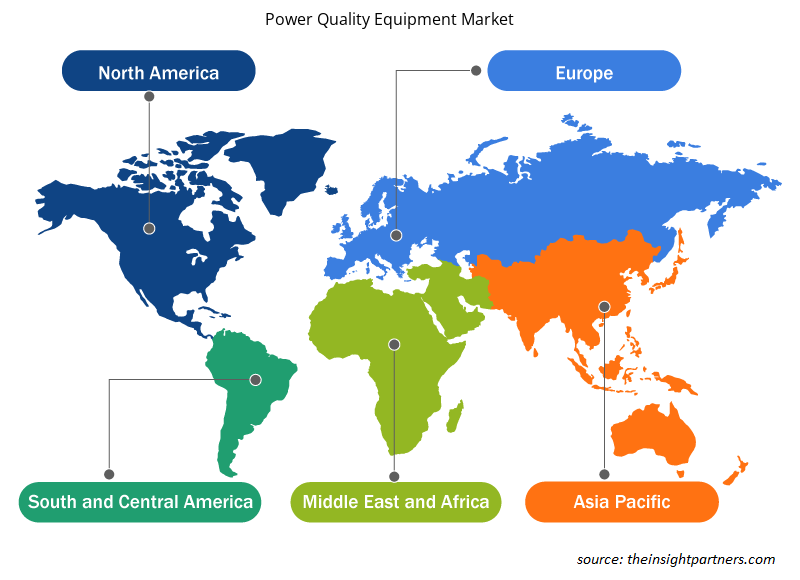
L'ambito geografico del rapporto sul mercato delle apparecchiature per la qualità dell'energia è suddiviso in cinque regioni: Nord America, Asia Pacifico, Europa, Medio Oriente e Africa, e Sud e Centro America.
Nell'area Asia-Pacifico, l'industria manifatturiera è fondamentale per dare impulso alle economie di molti paesi, con la Cina come principale contributore alla produzione manifatturiera mondiale. Anche Giappone, India, Corea del Sud e Indonesia sono importanti contributori della regione. Allo stesso tempo, si prevede che Vietnam, Malesia e Singapore aumenteranno la loro presenza di mercato in questo settore nei prossimi anni. Ciò evidenzia la varietà di attività manifatturiere nella regione Asia-Pacifico, influenzando la necessità di apparecchiature di qualità energetica.
Approfondimenti regionali sul mercato delle apparecchiature per la qualità dell'energia
Le tendenze regionali e i fattori che influenzano il mercato delle apparecchiature per la qualità dell'energia durante il periodo di previsione sono stati ampiamente spiegati dagli analisti di Insight Partners. Questa sezione discute anche i segmenti e la geografia del mercato delle apparecchiature per la qualità dell'energia in Nord America, Europa, Asia Pacifico, Medio Oriente e Africa e America meridionale e centrale.
- Ottieni i dati specifici regionali per il mercato delle apparecchiature per la qualità dell'energia
Ambito del rapporto di mercato sulle apparecchiature per la qualità dell'energia
| Attributo del report | Dettagli |
|---|---|
| Dimensioni del mercato nel 2023 | 32,51 miliardi di dollari USA |
| Dimensioni del mercato entro il 2031 | 55,02 miliardi di dollari USA |
| CAGR globale (2023-2031) | 6,8% |
| Dati storici | 2021-2022 |
| Periodo di previsione | 2024-2031 |
| Segmenti coperti |
Per equipaggiamento
|
| Regioni e Paesi coperti |
America del Nord
|
| Leader di mercato e profili aziendali chiave |
|
Densità degli operatori del mercato delle apparecchiature per la qualità dell'energia: comprendere il suo impatto sulle dinamiche aziendali
Il mercato delle apparecchiature per la qualità dell'energia sta crescendo rapidamente, spinto dalla crescente domanda degli utenti finali dovuta a fattori quali l'evoluzione delle preferenze dei consumatori, i progressi tecnologici e una maggiore consapevolezza dei vantaggi del prodotto. Con l'aumento della domanda, le aziende stanno ampliando le loro offerte, innovando per soddisfare le esigenze dei consumatori e capitalizzando sulle tendenze emergenti, il che alimenta ulteriormente la crescita del mercato.
La densità degli operatori di mercato si riferisce alla distribuzione di aziende o società che operano in un particolare mercato o settore. Indica quanti concorrenti (operatori di mercato) sono presenti in un dato spazio di mercato in relazione alle sue dimensioni o al valore di mercato totale.
Le principali aziende che operano nel mercato delle apparecchiature per la qualità dell'energia sono:
- Acumentazione
- Azienda Emerson Electric
- AMETEK Inc.
- Mangiare
- Compagnia elettrica generale
- Schneider Electric Italia
Disclaimer : le aziende elencate sopra non sono classificate secondo un ordine particolare.
- Ottieni una panoramica dei principali attori del mercato delle apparecchiature per la qualità dell'energia
Notizie e sviluppi recenti sul mercato delle apparecchiature per la qualità dell'energia
Il mercato delle apparecchiature per la qualità dell'energia viene valutato raccogliendo dati qualitativi e quantitativi dopo la ricerca primaria e secondaria, che include importanti pubblicazioni aziendali, dati associativi e database. Di seguito sono elencati alcuni degli sviluppi nel mercato delle apparecchiature per la qualità dell'energia:
- La società di gestione dell'alimentazione Eaton (NYSE: ETN) ha annunciato oggi di aver completato l'acquisizione di Tripp Lite. Con sede a Chicago, Illinois, Tripp Lite è un fornitore leader di prodotti per la qualità dell'alimentazione e soluzioni di connettività, tra cui sistemi di alimentazione ininterrotta monofase, unità di distribuzione dell'alimentazione su rack, protezioni da sovratensione e contenitori per data center, mercati industriali, medici e delle comunicazioni nelle Americhe.
(Fonte: Eaton, Comunicato stampa, marzo 2021)
Copertura e risultati del rapporto sul mercato delle apparecchiature per la qualità dell'energia
Il rapporto "Dimensioni e previsioni del mercato delle apparecchiature per la qualità dell'energia (2021-2031)" fornisce un'analisi dettagliata del mercato che copre le seguenti aree:
- Dimensioni e previsioni del mercato delle apparecchiature per la qualità dell'energia a livello globale, regionale e nazionale per tutti i principali segmenti di mercato coperti dall'ambito
- Tendenze del mercato delle apparecchiature per la qualità dell'energia e dinamiche di mercato come driver, vincoli e opportunità chiave
- Analisi dettagliata delle cinque forze PEST/Porter e SWOT
- Analisi di mercato delle apparecchiature per la qualità dell'energia che copre le principali tendenze del mercato, il quadro globale e regionale, i principali attori, le normative e i recenti sviluppi del mercato
- Analisi del panorama industriale e della concorrenza che copre la concentrazione del mercato, l'analisi della mappa termica, i principali attori e gli sviluppi recenti per il mercato delle apparecchiature per la qualità dell'energia
- Profili aziendali dettagliati

Naveen è un professionista esperto in ricerche di mercato e consulenza con oltre 9 anni di esperienza in progetti personalizzati, sindacati e di consulenza. Attualmente Vicepresidente Associato, ha gestito con successo gli stakeholder lungo l'intera catena del valore del progetto e ha redatto oltre 100 report di ricerca e oltre 30 incarichi di consulenza. Il suo lavoro spazia tra progetti industriali e governativi, contribuendo in modo significativo al successo dei clienti e al processo decisionale basato sui dati.
Naveen ha conseguito una laurea in Ingegneria Elettronica e delle Comunicazioni presso la VTU, Karnataka, e un MBA in Marketing e Operations presso la Manipal University. È membro attivo dell'IEEE da 9 anni, partecipando a conferenze, simposi tecnici e svolgendo attività di volontariato sia a livello di sezione che regionale. Prima del suo attuale ruolo, ha lavorato come Consulente Strategico Associato presso IndustryARC e come Consulente Server Industriali presso Hewlett Packard (HP Global).
- Analisi storica (2 anni), anno base, previsione (7 anni) con CAGR
- Analisi PEST e SWOT
- Valore/volume delle dimensioni del mercato - Globale, Regionale, Nazionale
- Industria e panorama competitivo
- Set di dati Excel
Testimonianze
Il report di mercato sui sistemi SCADA di Insight Partners è completo, con preziosi spunti sulle tendenze attuali e sulle previsioni future. Il team si è dimostrato altamente professionale, reattivo e disponibile in ogni fase del progetto. Siamo molto soddisfatti e consigliamo vivamente i loro servizi.
RAN KEDEM Partner, Reali Technologies LTDsHo richiesto un report su un mercato software molto specifico e il team lo ha prodotto in pochi giorni. Le informazioni erano molto pertinenti e ben presentate. Ho quindi richiesto alcune modifiche e aggiunte al report. Il team è stato ancora una volta molto reattivo e ho ricevuto il report finale in meno di una settimana.
JEAN-HERVE JENN Presidente, Future AnalyticaAbbiamo collaborato con The Insight Partners per un importante studio di mercato e una previsione. Ci hanno fornito informazioni chiare su opportunità e rischi, che ci hanno aiutato a definire i nostri piani. La loro ricerca è stata facile da usare e basata su dati solidi. Ci ha aiutato a prendere decisioni intelligenti e consapevoli. Li consigliamo vivamente.
PIYUSH NAGPAL Vicepresidente senior, Abbaglianti globaliInsight Partners ha fornito ricerche di mercato approfondite e ben strutturate, con una solida competenza nel settore. Il loro team si è dimostrato professionale e reattivo in ogni fase. Il sito web intuitivo ha reso l'accesso ai report di settore semplice e immediato. Li consigliamo vivamente per servizi di ricerca affidabili e di alta qualità.
YUKIHIKO ADACHI Amministratore delegato, Deep Blue, LLC.Questa è la prima volta che acquisto un report di mercato da The Insight Partners. Sebbene inizialmente fossi indeciso, ho visitato il loro sito web e mi sono sentito più a mio agio nell'acquistare un report di mercato. Sono completamente soddisfatto della qualità del report e del servizio clienti. Avevo diverse domande e commenti sul report iniziale, ma dopo un paio di conversazioni via email con il loro analista credo di avere un report che posso utilizzare come input per il nostro processo di pianificazione strategica. Grazie mille per aver dedicato del tempo extra e aver reso questa esperienza positiva. Consiglierò sicuramente il vostro servizio ad altri e sarete la mia prima persona a cui rivolgermi quando avremo bisogno di ulteriori dati di mercato.
GIOVANNI SUZUKI Presidente e Amministratore Delegato, Consigliere di Amministrazione, Tecnologie BKDesidero esprimere la mia gratitudine per il supporto e la professionalità dimostrati nel rispondere alla mia richiesta di informazioni sul mercato dei dispositivi medici in vitro per malattie infettive in Nigeria. Apprezzo la vostra pazienza, la vostra guida e la vostra disponibilità a offrirmi uno sconto, che alla fine ci ha permesso di concludere l'affare. Non vedo l'ora di collaborare con The Insight Partners in futuro, grazie anche all'impressione che mi avete lasciato dopo questo primo incontro.
Dott. Chijioke AMMINISTRATORE DELEGATO DI ONYIA, PineCrest Healthcare Ltd.Motivo dell'acquisto
- Processo decisionale informato
- Comprensione delle dinamiche di mercato
- Analisi competitiva
- Analisi dei clienti
- Previsioni di mercato
- Mitigazione del rischio
- Pianificazione strategica
- Giustificazione degli investimenti
- Identificazione dei mercati emergenti
- Miglioramento delle strategie di marketing
- Aumento dell'efficienza operativa
- Allineamento alle tendenze normative


Sblocca sconti esclusivi sui report
Richiedi ora


 Ottieni un campione gratuito per - Mercato delle apparecchiature per la qualità dell'energia