電力品質機器市場の成長、規模、シェア、傾向、主要プレーヤーの分析、2031年までの予測

  • Report Date : Oct 2025
  • Report Code : TIPRE00023328
  • Category : Electronics and Semiconductor
  • Status : Data Released
  • Available Report Formats : pdf-format excel-format
  • No. of Pages : 150

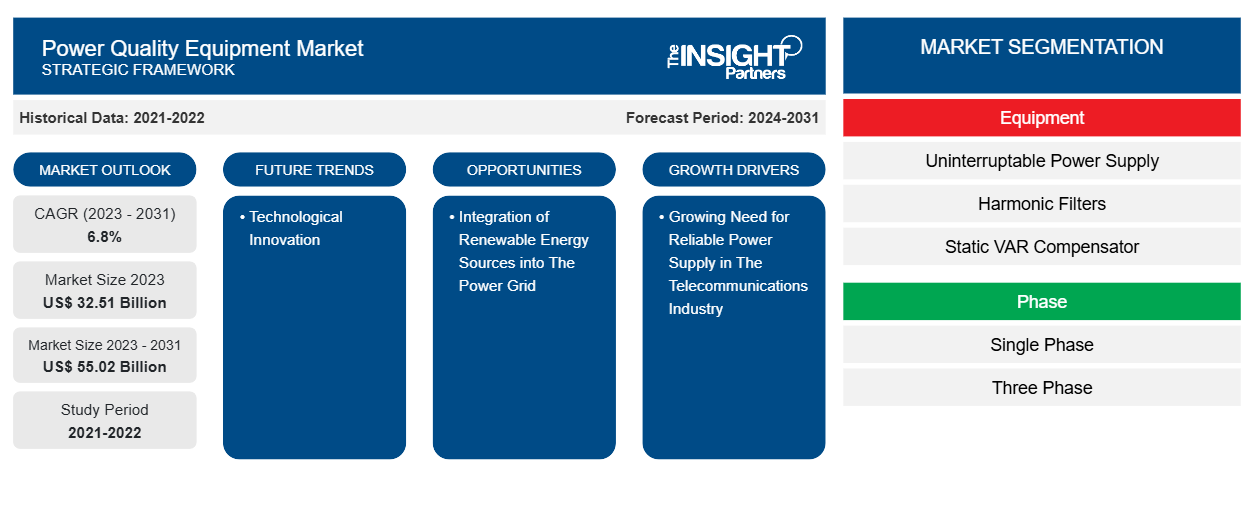
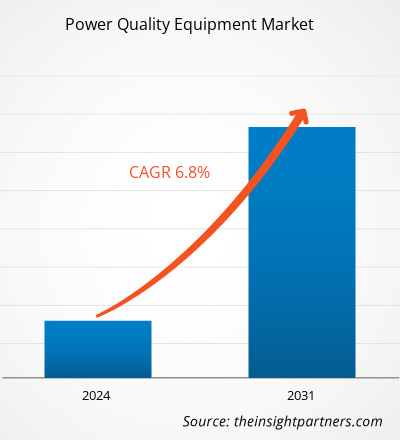
電力品質機器市場規模は、2023年の325億1,000万米ドルから2031年には550億2,000万米ドルに達すると予測されています。市場は2023年から2031年の間に6.8%のCAGRを記録すると予想されています。技術革新は引き続き市場の重要なトレンドとなると思われます。

電力品質機器市場分析

加工・製造業の急速な成長により、世界の電力需要は増加しています。電力使用量の増加は、輸送、医療、ビジネス、住宅の各産業によっても促進されています。アジア太平洋地域では人口の増加、可処分所得の増加、デジタル化の進展により、消費者はオンラインでの購入や支払いをますます好むようになっています。

電力品質機器市場の概要

この地域のさまざまな政府は、製造業の発展を奨励しています。たとえば、インド政府は「Make in India」プログラムを立ち上げ、国内外の企業がインドに製造工場を設立し、国内の製造インフラを強化することを促進しています。同様に、中国政府は「Made in China 2025」計画を実施し、国の製造業を強化し、世界のトップ市場としての地位を確立しました。前述の傾向により、業界で安定した電力供給を維持するために電力品質機器の使用が増加し、最終的には電力変動に関連する損傷からハードウェアを保護しています。さらに、電力品質機器市場に対する需要の増加は、急速に変化する消費財の需要の増加によって推進される加工産業の継続的な成長によって強化されています。

要件に合わせてレポートをカスタマイズする

このレポートの一部、国レベルの分析、Excelデータパックなど、あらゆるレポートを無料でカスタマイズできます。また、スタートアップや大学向けのお得なオファーや割引もご利用いただけます。

電力品質機器市場:

Power Quality Equipment Market
  • このレポートの主要な市場動向を入手してください。
    この無料サンプルには、市場動向から見積もりや予測に至るまでのデータ分析が含まれます。

電力品質機器市場の推進要因と機会

通信業界における信頼性の高い電力供給の必要性の高まりが市場の成長を促進

近年、通信インフラは急速に進化しています。この現代の通信インフラには、データセンター、サーバー、インターネット関連インフラなどのアップグレードされたシステムに加えて、音声およびデータ伝送サービスを効率的に提供するための機器が含まれています。しかし、現代の通信システムは、データ伝送に使用される電子部品が電圧低下、電圧上昇、過渡現象、高調波の影響を受けやすいため、電力の問題の影響を受けやすくなっています。通信デバイスは、短絡、接続不良、障害、モーターの始動などによって引き起こされる電圧低下や電圧上昇などの負荷の急激な増加による電力変動によって中断される可能性があります。これらのシナリオは、通信の中断や通信会社の経済的損失、および機器の誤動作や故障の可能性につながります。この障害に対処するために、通信会社は、指定された範囲内で一貫した電圧供給を維持するための電力品質デバイスを実装しています。

再生可能エネルギー資源の電力網への組み込み

再生可能エネルギーの統合を成功させるには、高い電力品質を維持することが非常に重要です。この点での主な課題は、再生可能エネルギー源の予測不可能な性質から生じる電圧と周波数の変動の発生です。再生可能エネルギーの生成におけるパワーエレクトロニクスデバイスの使用も、高調波の発生を含む電力品質の問題の一因となります。その結果、電力品質機器市場の拡大には楽観的な見通しがあります。これは、負荷の不均衡による電気機器の誤動作を防ぐ上で重要な役割を果たすためです。さらに、食品および飲料業界は近年大幅に成長しています。健康への懸念の高まり、都市化、世界的な政府の取り組みなどの要因により、包装食品と乳製品の両方の人気の高まりが促進されています。

電力品質機器市場レポートのセグメンテーション分析

電力品質機器市場分析の導出に貢献した主要なセグメントは、機器、フェーズ、およびエンドユーザーです。

  • 機器に基づいて、市場は無停電電源装置(UPS)、高調波フィルター、静的VAR補償装置、電力品質メーター、その他に分類されます。無停電電源装置(UPS)セグメントは、2023年に大きな市場シェアを占めました。uninterruptable power supply (UPS), harmonic filters, static VAR compensators, power quality meters, and others. The uninterruptable power supply (UPS) segment held a significant market share in 2023.
  • フェーズ別に見ると、市場は単相と三相に分かれています。単相セグメントは2023年に市場で大きなシェアを占めました。
  • エンドユーザーに基づいて、市場は産業および製造、商業、その他に分類されます。産業および製造セグメントは、2023年に大きな市場シェアを占めました。

電力品質機器の地域別市場シェア分析

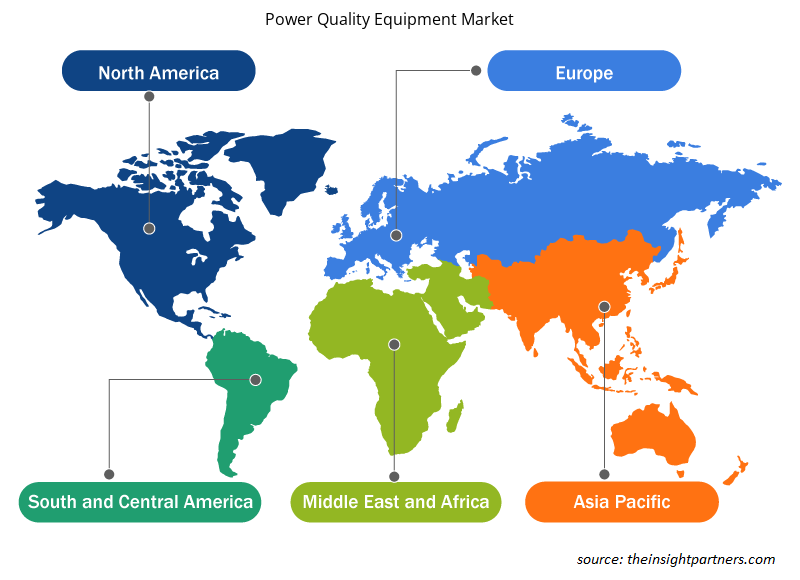
電力品質機器市場レポートの地理的範囲は、北米、アジア太平洋、ヨーロッパ、中東およびアフリカ、南米および中米の 5 つの地域に分かれています。

アジア太平洋地域では、製造業が多くの国の経済成長に重要な役割を果たしており、中国は世界の製造業生産の主たる貢献国です。日本、インド、韓国、インドネシアもこの地域に大きく貢献しています。同時に、ベトナム、マレーシア、シンガポールは今後数年間でこの業界での存在感を高めると予想されています。これは、アジア太平洋地域での製造活動の多様性を浮き彫りにし、電力品質の機器の必要性に影響を与えています。


電力品質機器市場地域別インサイト

予測期間を通じて電力品質機器市場に影響を与える地域的な傾向と要因は、Insight Partners のアナリストによって徹底的に説明されています。このセクションでは、北米、ヨーロッパ、アジア太平洋、中東およびアフリカ、南米および中米にわたる電力品質機器市場のセグメントと地理についても説明します。

Power Quality Equipment Market
  • 電力品質機器市場の地域別データを入手

電力品質機器市場レポートの範囲

レポート属性詳細
2023年の市場規模325億1000万米ドル
2031年までの市場規模550.2億米ドル
世界のCAGR(2023年~2031年)6.8%
履歴データ2021-2022
予測期間2024-2031
対象セグメント機器別
  • 無停電電源装置
  • 高調波フィルタ
  • 静的VAR補償装置
  • 電力品質メーター
フェーズ別
  • 単相
  • 三相
エンドユーザー別
  • 工業および製造業
  • コマーシャル
対象地域と国北米
  • 私たち
  • カナダ
  • メキシコ
ヨーロッパ
  • 英国
  • ドイツ
  • フランス
  • ロシア
  • イタリア
  • その他のヨーロッパ
アジア太平洋
  • 中国
  • インド
  • 日本
  • オーストラリア
  • その他のアジア太平洋地域
南米と中央アメリカ
  • ブラジル
  • アルゼンチン
  • 南米および中米のその他の地域
中東およびアフリカ
  • 南アフリカ
  • サウジアラビア
  • アラブ首長国連邦
  • その他の中東およびアフリカ
市場リーダーと主要企業プロフィール
  • アキュメントリクス
  • エマーソンエレクトリック社
  • アメテック株式会社
  • イートン
  • ゼネラル・エレクトリック・カンパニー
  • シュナイダーエレクトリック SE
  • シーメンスAG
  • 東芝エネルギーシステムズ株式会社
  • 日立ABBパワーグリッドグループ
  • ピラーグループ GmbH


電力品質機器市場のプレーヤー密度:ビジネスダイナミクスへの影響を理解する

電力品質機器市場は、消費者の嗜好の変化、技術の進歩、製品の利点に対する認識の高まりなどの要因により、エンドユーザーの需要が高まり、急速に成長しています。需要が高まるにつれて、企業は提供を拡大し、消費者のニーズを満たすために革新し、新たなトレンドを活用し、市場の成長をさらに促進しています。

市場プレーヤー密度とは、特定の市場または業界内で活動している企業または会社の分布を指します。これは、特定の市場スペースに、その規模または総市場価値と比較して、どれだけの競合相手 (市場プレーヤー) が存在するかを示します。

電力品質機器市場で事業を展開している主要企業は次のとおりです。

  1. アキュメントリクス
  2. エマーソンエレクトリック社
  3. アメテック株式会社
  4. イートン
  5. ゼネラル・エレクトリック・カンパニー
  6. シュナイダーエレクトリック SE

免責事項上記の企業は、特定の順序でランク付けされていません。


power-quality-equipment-market-cagr


  • 電力品質機器市場のトップキープレーヤーの概要を入手

電力品質機器市場のニュースと最近の動向

電力品質機器市場は、主要な企業出版物、協会データ、データベースを含む一次調査と二次調査後の定性的および定量的データを収集することによって評価されます。電力品質機器市場におけるいくつかの動向を以下に示します。

  • 電力管理会社イートン(NYSE: ETN)は本日、Tripp Lite の買収を完了したことを発表しました。イリノイ州シカゴに本社を置く Tripp Lite は、南北アメリカ大陸のデータセンター、産業、医療、通信市場向けの単相無停電電源装置、ラック配電ユニット、サージプロテクタ、エンクロージャなど、電力品質製品および接続ソリューションの大手サプライヤです。

(出典:イートン、プレスリリース、2021年3月)

電力品質機器市場レポートの対象範囲と成果物

「電力品質機器市場規模と予測(2021〜2031年)」レポートでは、以下の分野をカバーする市場の詳細な分析を提供しています。

  • 対象範囲に含まれるすべての主要市場セグメントについて、世界、地域、国レベルでの電力品質機器市場規模と予測
  • 電力品質機器市場の動向、および推進要因、制約、主要な機会などの市場動向
  • 詳細なPEST/ポーターの5つの力とSWOT分析
  • 主要な市場動向、世界および地域の枠組み、主要プレーヤー、規制、最近の市場動向を網羅した電力品質機器市場分析
  • 市場集中、ヒートマップ分析、主要プレーヤー、電力品質機器市場の最近の動向を網羅した業界の状況と競争分析
  • 詳細な企業プロフィール

よくある質問

Which are the leading players operating in the power quality equipment market?

Acumentrics, Emerson Electric Co., AMETEK Inc., Eaton, General Electric Company, Schneider Electric SE, Siemens AG, Toshiba Energy Systems & Solutions Corporation, Hitachi ABB Power Grids Group, and Piller Group GmbH are major players in the market.

What are the future trends of the power quality equipment market?

Technological innovation is a key trend in the market.

What are the driving factors impacting the power quality equipment market?

The growing need for reliable power supply in the telecommunications industry and the increase in smart grid infrastructure are driving the market.

What would be the estimated value of the power quality equipment market by 2031?

The market is expected to reach a value of US$ 50.33 billion by 2031.

What is the expected CAGR of the power quality equipment market?

The market is anticipated to record a CAGR of 6.5% during 2025-2031.

ナヴィーン・チッタラギ
ナヴィーン・チッタラギ
副社長
市場調査とコンサルティング

ナビーンは、カスタム、シンジケート、コンサルティングの各プロジェクトにおいて9年以上の実績を持つ、経験豊富な市場調査およびコンサルティングのプロフェッショナルです。現在はアソシエイトバイスプレジデントを務め、プロジェクトバリューチェーン全体にわたるステークホルダーのマネジメントを成功させ、100件以上の調査レポートと30件以上のコンサルティング案件を執筆しています。産業分野から政府機関まで、幅広いプロジェクトに携わり、クライアントの成功とデータに基づく意思決定に大きく貢献しています。

ナビーンは、カルナータカ州VTUで電子通信工学の学位を取得し、マニパル大学でマーケティング&オペレーションズのMBAを取得しています。9年間IEEEの会員として活動し、会議や技術シンポジウムへの参加、支部および地域レベルでのボランティア活動などを行っています。現職に就く前は、IndustryARCでアソシエイト戦略コンサルタント、ヒューレット・パッカード(HP Global)で産業用サーバーコンサルタントを務めていました。

  • 過去2年間の分析、基準年、CAGRによる予測(7年間)
  • PEST分析とSWOT分析
  • 市場規模価値/数量 - 世界、地域、国
  • 業界と競争環境
  • Excel データセット

お客様の声

購入理由

  • 情報に基づいた意思決定
  • 市場動向の理解
  • 競合分析
  • 新興市場の特定
  • 顧客インサイト
  • 市場予測
  • リスク軽減
  • 業務効率の向上
  • 戦略計画
  • 投資の正当性
  • 業界イノベーションの追跡
  • 規制動向への対応
主な懸念事項への対応 - 質問と回答
購入前にレポートのサンプルを見ることはできますか?

はい!レポートの範囲(目次)、レポートの構成、そしてレポート全体の価値を評価するのに役立つ厳選されたインサイトを含む、レポートの無料サンプルをご提供しています。 「サンプルをダウンロード」ボタンをクリックするか、お問い合わせの上、サンプルをお送りください。

ご購入にはアナリストサポートが含まれていますか?

はい、アナリストによるサポートはパッケージに含まれています。ご購入後、アナリストにご連絡いただき、レポートの洞察や手法についてご説明したり、調査結果がお客様のビジネスニーズにどのように当てはまるかご相談いただけます。

注文後の手順を教えてください。

ご注文が完了すると、確認メールと請求書が届きます。

• 公開済みレポートの場合:4~6営業時間以内に、セキュリティ保護されたメールがお客様のメールアドレスに送信されます。
• 近日公開予定レポートの場合:ご注文は事前予約として記録されます。リリース予定日については、担当チームからご連絡し、最新情報をお知らせいたします。レポートが公開され次第、ご登録いただいたメールアドレスに配信いたします。

レポートは、お客様の特定のニーズに合わせてカスタマイズできますか?

お客様の特定の目的に合わせてレポートをカスタマイズするためのオプションをご用意しております。特定の地域、業界セグメント、競合他社の分析、データカットなど、より深い洞察が必要な場合でも、当社のリサーチチームがそれに応じてレポートをカスタマイズいたします。ご要望をお聞かせください。お客様に合わせたご提案やスコープを喜んでご提供いたします。

レポートはどのような形式で提供されますか?

レポートは、選択したライセンスに応じて、PDF形式またはExcelデータセットで提供されます。

PDF版では、完全な分析とビジュアルがすぐに読める形式で提供されます。Excelデータセットには、すべてのデータテーブルが含まれており、簡単に操作して詳細な分析を行うことができます。
ご購入時にライセンスオプションをご確認ください。または、ご購入に含まれる形式を確認するには、お問い合わせください。

プラットフォームの決済プロセスはどの程度安全ですか?

当社の決済プロセスは完全に安全で、PCI-DSSに準拠しています。

当社は、すべての取引が業界標準のSSL暗号化で保護されるよう、信頼性の高い暗号化された決済ゲートウェイを使用しています。お支払い情報は当社のサーバーに保存されることはありません。認定されたサードパーティの決済代行業者によって安全に処理されます。
お客様の個人情報と財務情報は当社で安全に保管されますので、安心してご購入いただけます。

複数のレポートをご購入いただく場合、特別価格はありますか?

はい、まとめ買いの場合は特別価格をご用意しております。
複数のレポートをご購入いただく場合は、お客様のニーズに合わせてカスタマイズされたバンドルオファーまたは数量ベースの割引をご提供いたします。ご検討中のレポートのリストを弊社の営業チームまでお送りください。お客様に合わせたお見積もりをお送りいたします。

ご購入前に、担当チームとレポートについてご相談させていただくことは可能でしょうか?

はい、もちろんです。
弊社のチームが、お客様が十分な情報に基づいて意思決定できるようお手伝いいたします。レポートの範囲、方法論、カスタマイズオプション、最適なライセンスなど、ご質問がございましたら、お気軽にお問い合わせください。 sales@theinsightpartners.com までご連絡ください。担当者が速やかにご連絡いたします。

ご購入時に請求書は発行されますか?

はい、ご購入が完了すると請求書が自動的に生成され、ご登録いただいたメールアドレスに送信されます。
特定の形式で請求書が必要な場合や、追加情報(会社名、GST、VAT情報など)が必要な場合は、お気軽にお問い合わせください。喜んでご対応させていただきます。

レポートにアクセスできない場合、サポートを受けることはできますか?

はい、もちろんです。
レポートへのアクセスや受信に問題が発生した場合は、サポートチームがサポートいたします。ご注文情報を添えて、メールまたはライブチャットでお問い合わせください。問題を迅速に解決し、お客様が中断することなくレポートにアクセスできるようお手伝いいたします。

当社のクライアント
Your data will never be shared with third parties, however, we may send you information from time to time about our products that may be of interest to you. By submitting your details, you agree to be contacted by us. You may contact us at any time to opt-out.

販売支援
US: +1-646-491-9876
UK: +44-20-8125-4005
Email: sales@theinsightpartners.com
チャットでお問い合わせください
DUNS Logo
87-673-9708
ISO Certified Logo
ISO 9001:2015
ISO Certified Logo

The Insight Partners performs research in 4 major stages: Data Collection & Secondary Research, Primary Research, Data Analysis and Data Triangulation & Final Review.

  1. Data Collection and Secondary Research:

As a market research and consulting firm operating from a decade, we have published and advised several client across the globe. First step for any study will start with an assessment of currently available data and insights from existing reports. Further, historical and current market information is collected from Investor Presentations, Annual Reports, SEC Filings, etc., and other information related to company’s performance and market positioning are gathered from Paid Databases (Factiva, Hoovers, and Reuters) and various other publications available in public domain.

Several associations trade associates, technical forums, institutes, societies and organization are accessed to gain technical as well as market related insights through their publications such as research papers, blogs and press releases related to the studies are referred to get cues about the market. Further, white papers, journals, magazines, and other news articles published in last 3 years are scrutinized and analyzed to understand the current market trends.

  1. Primary Research:

The primarily interview analysis comprise of data obtained from industry participants interview and answers to survey questions gathered by in-house primary team.

For primary research, interviews are conducted with industry experts/CEOs/Marketing Managers/VPs/Subject Matter Experts from both demand and supply side to get a 360-degree view of the market. The primary team conducts several interviews based on the complexity of the markets to understand the various market trends and dynamics which makes research more credible and precise.

A typical research interview fulfils the following functions:

  • Provides first-hand information on the market size, market trends, growth trends, competitive landscape, and outlook
  • Validates and strengthens in-house secondary research findings
  • Develops the analysis team’s expertise and market understanding

Primary research involves email interactions and telephone interviews for each market, category, segment, and sub-segment across geographies. The participants who typically take part in such a process include, but are not limited to:

  • Industry participants: VPs, business development managers, market intelligence managers and national sales managers
  • Outside experts: Valuation experts, research analysts and key opinion leaders specializing in the electronics and semiconductor industry.

Below is the breakup of our primary respondents by company, designation, and region:

Research Methodology

Once we receive the confirmation from primary research sources or primary respondents, we finalize the base year market estimation and forecast the data as per the macroeconomic and microeconomic factors assessed during data collection.

  1. Data Analysis:

Once data is validated through both secondary as well as primary respondents, we finalize the market estimations by hypothesis formulation and factor analysis at regional and country level.

  • Macro-Economic Factor Analysis:

We analyse macroeconomic indicators such the gross domestic product (GDP), increase in the demand for goods and services across industries, technological advancement, regional economic growth, governmental policies, the influence of COVID-19, PEST analysis, and other aspects. This analysis aids in setting benchmarks for various nations/regions and approximating market splits. Additionally, the general trend of the aforementioned components aid in determining the market's development possibilities.

  • Country Level Data:

Various factors that are especially aligned to the country are taken into account to determine the market size for a certain area and country, including the presence of vendors, such as headquarters and offices, the country's GDP, demand patterns, and industry growth. To comprehend the market dynamics for the nation, a number of growth variables, inhibitors, application areas, and current market trends are researched. The aforementioned elements aid in determining the country's overall market's growth potential.

  • Company Profile:

The “Table of Contents” is formulated by listing and analyzing more than 25 - 30 companies operating in the market ecosystem across geographies. However, we profile only 10 companies as a standard practice in our syndicate reports. These 10 companies comprise leading, emerging, and regional players. Nonetheless, our analysis is not restricted to the 10 listed companies, we also analyze other companies present in the market to develop a holistic view and understand the prevailing trends. The “Company Profiles” section in the report covers key facts, business description, products & services, financial information, SWOT analysis, and key developments. The financial information presented is extracted from the annual reports and official documents of the publicly listed companies. Upon collecting the information for the sections of respective companies, we verify them via various primary sources and then compile the data in respective company profiles. The company level information helps us in deriving the base number as well as in forecasting the market size.

  • Developing Base Number:

Aggregation of sales statistics (2020-2022) and macro-economic factor, and other secondary and primary research insights are utilized to arrive at base number and related market shares for 2022. The data gaps are identified in this step and relevant market data is analyzed, collected from paid primary interviews or databases. On finalizing the base year market size, forecasts are developed on the basis of macro-economic, industry and market growth factors and company level analysis.

  1. Data Triangulation and Final Review:

The market findings and base year market size calculations are validated from supply as well as demand side. Demand side validations are based on macro-economic factor analysis and benchmarks for respective regions and countries. In case of supply side validations, revenues of major companies are estimated (in case not available) based on industry benchmark, approximate number of employees, product portfolio, and primary interviews revenues are gathered. Further revenue from target product/service segment is assessed to avoid overshooting of market statistics. In case of heavy deviations between supply and demand side values, all thes steps are repeated to achieve synchronization.

We follow an iterative model, wherein we share our research findings with Subject Matter Experts (SME’s) and Key Opinion Leaders (KOLs) until consensus view of the market is not formulated – this model negates any drastic deviation in the opinions of experts. Only validated and universally acceptable research findings are quoted in our reports.

We have important check points that we use to validate our research findings – which we call – data triangulation, where we validate the information, we generate from secondary sources with primary interviews and then we re-validate with our internal data bases and Subject matter experts. This comprehensive model enables us to deliver high quality, reliable data in shortest possible time.