
Croissance, taille, part, tendances, analyse des principaux acteurs et prévisions du marché des équipements de qualité électrique jusqu’en 2031
Analyse de la taille et des prévisions du marché des équipements de qualité de l'énergie (2021-2031), des parts mondiales et régionales, des tendances et des opportunités de croissance. Couverture du rapport : par équipement (onduleurs, filtres harmoniques, compensateurs statiques VAR, compteurs de qualité de l'énergie, autres), phase (monophasée, triphasée), utilisateurs finaux (industriels et manufacturiers, commerciaux et autres) et géographie.
- Statut : Données publiées
- Code du rapport : TIPRE00023328
- Catégorie : Électronique et semi-conducteurs
- Nombre de pages : 150
- Formats de rapport disponibles :


- Date de dernière mise à jour : August 07, 2025

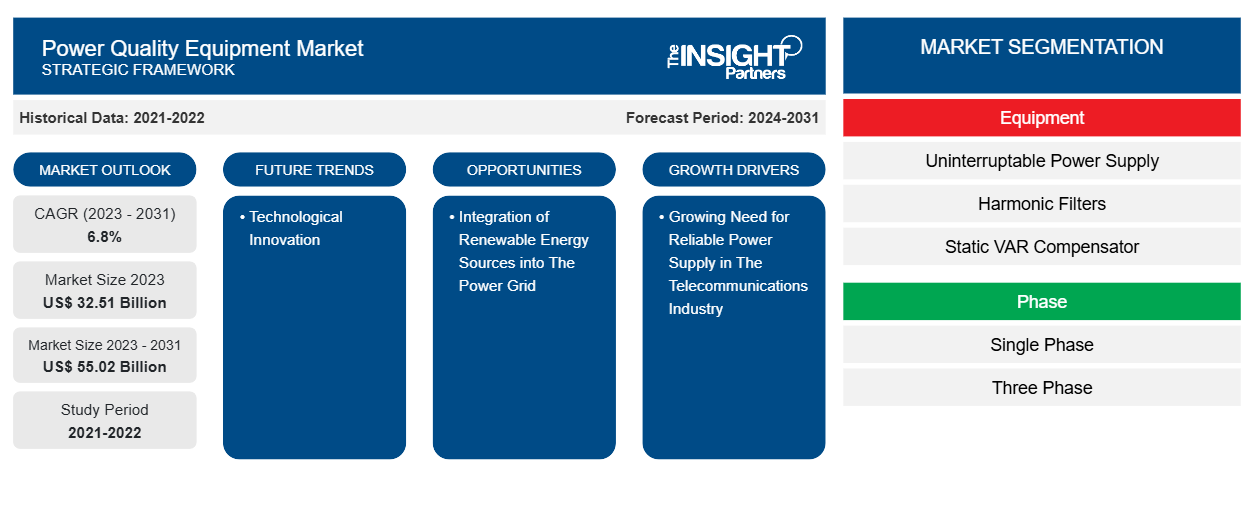
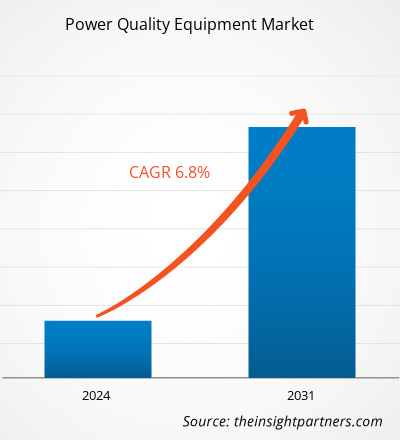
Le marché des équipements de qualité de l'énergie devrait atteindre 55,02 milliards USD d'ici 2031, contre 32,51 milliards USD en 2023. Le marché devrait enregistrer un TCAC de 6,8 % au cours de la période 2023-2031. L'innovation technologique devrait rester une tendance clé du marché.
Analyse du marché des équipements de qualité de l'énergie
La demande mondiale en électricité augmente en raison de la croissance rapide des industries de transformation et de fabrication. L’augmentation de la consommation d’électricité est également due aux secteurs des transports, de la santé, des affaires et du logement. L’augmentation de la population, l’augmentation du revenu disponible et la numérisation croissante dans la région Asie-Pacifique incitent les consommateurs à privilégier de plus en plus les achats et les paiements en ligne.
Aperçu du marché des équipements de qualité de l'énergie
Les différents gouvernements de la région encouragent le développement de leur secteur manufacturier. À titre d'exemple, le gouvernement indien a lancé le programme « Make in India » pour encourager les entreprises nationales et internationales à établir leurs usines de fabrication en Inde et à améliorer l'infrastructure de fabrication du pays. De la même manière, le gouvernement chinois a mis en œuvre le plan « Made in China 2025 » pour renforcer l'industrie manufacturière du pays et se positionner comme le premier marché mondial. Les tendances mentionnées entraînent une augmentation de l'utilisation d'équipements de qualité de l'énergie pour maintenir une alimentation électrique stable dans les industries, protégeant ainsi le matériel des dommages liés aux fluctuations de l'énergie. En outre, la demande croissante pour le marché des équipements de qualité de l'énergie est renforcée par la croissance continue des industries de transformation, stimulée par le besoin croissant de biens de consommation à évolution rapide.
Personnalisez ce rapport en fonction de vos besoins
Vous bénéficierez d'une personnalisation gratuite de n'importe quel rapport, y compris de certaines parties de ce rapport, d'une analyse au niveau des pays, d'un pack de données Excel, ainsi que d'offres et de remises exceptionnelles pour les start-ups et les universités.
Marché des équipements de qualité de l'énergie : informations stratégiques
-
Obtenez les principales tendances clés du marché de ce rapport.Cet échantillon GRATUIT comprendra une analyse de données, allant des tendances du marché aux estimations et prévisions.
Moteurs et opportunités du marché des équipements de qualité de l'énergie
Le besoin croissant d'une alimentation électrique fiable dans le secteur des télécommunications pour stimuler la croissance du marché
L'infrastructure des télécommunications a rapidement évolué ces dernières années. Cette infrastructure de télécommunication moderne comprend des systèmes modernisés tels que des centres de données, des serveurs et des infrastructures liées à Internet, ainsi que des équipements permettant de fournir efficacement des services de transmission de voix et de données. Néanmoins, les systèmes de communication contemporains sont de plus en plus sensibles aux problèmes d'alimentation électrique en raison des composants électroniques utilisés pour la transmission de données qui sont plus sujets aux creux/baisses, aux surtensions, aux transitoires et aux harmoniques. Un appareil de télécommunication peut être perturbé par des fluctuations de puissance résultant d'augmentations soudaines des charges, telles que des creux et des surtensions de tension, qui sont causés par des courts-circuits, des connexions desserrées, des pannes et le démarrage de moteurs. Ces scénarios entraînent des interruptions de communication et des pertes financières pour les entreprises de télécommunications, ainsi que des dysfonctionnements et des pannes d'équipement potentiels. Pour surmonter cet obstacle, les entreprises de télécommunications mettent en œuvre des dispositifs de qualité de l'alimentation électrique pour maintenir une alimentation en tension constante dans une plage spécifiée.
Incorporation des ressources énergétiques renouvelables dans le réseau électrique
L'intégration réussie des énergies renouvelables repose en grande partie sur le maintien d'une qualité d'énergie élevée. L'un des principaux défis dans ce contexte est l'apparition de fluctuations de tension et de fréquence résultant de la nature imprévisible des sources d'énergie renouvelables . L'utilisation d'appareils électroniques de puissance dans la production d'énergie renouvelable contribue également aux problèmes de qualité de l'énergie, notamment à la génération d'harmoniques. Par conséquent, les perspectives d'expansion du marché des équipements de qualité de l'énergie sont optimistes, car ils jouent un rôle essentiel dans la prévention des dysfonctionnements des équipements électriques dus à des déséquilibres de charge. En outre, l'industrie agroalimentaire a connu une croissance substantielle ces dernières années. Des facteurs tels que les préoccupations croissantes en matière de santé, l'urbanisation et les initiatives gouvernementales mondiales ont entraîné la popularité croissante des aliments emballés et des produits laitiers.
Analyse de segmentation du rapport sur le marché des équipements de qualité de l'énergie
Les segments clés qui ont contribué à l’élaboration de l’analyse du marché des équipements de qualité de l’énergie sont l’équipement, la phase et les utilisateurs finaux.
- En fonction des équipements, le marché est segmenté en alimentations sans interruption (UPS), filtres harmoniques, compensateurs statiques VAR , compteurs de qualité de l'énergie et autres. Le segment des alimentations sans interruption (UPS) détenait une part de marché importante en 2023.
- En termes de phase, le marché est divisé en une phase unique et une phase triphasée. Le segment monophasé détenait une part substantielle du marché en 2023.
- En fonction des utilisateurs finaux, le marché est segmenté en secteurs industriel et manufacturier, commercial et autres. Le segment industriel et manufacturier détenait une part de marché importante en 2023.
Analyse des parts de marché des équipements de qualité de l'énergie par zone géographique
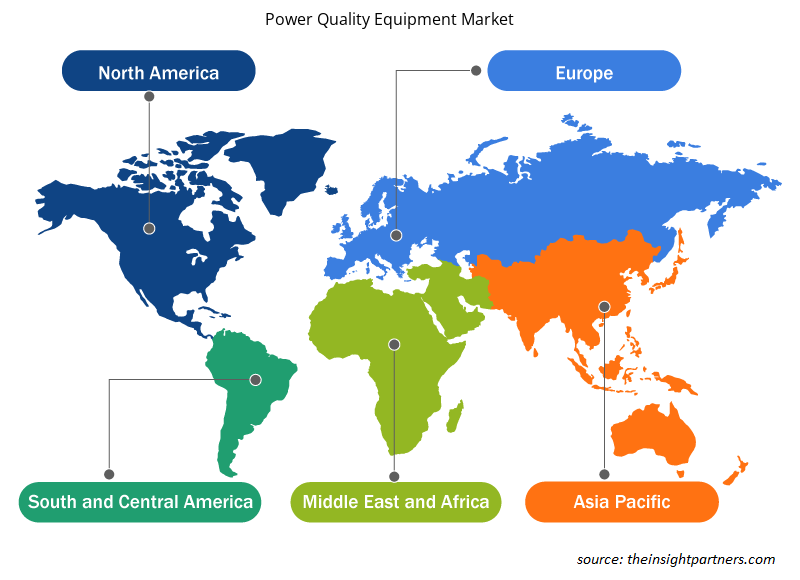
La portée géographique du rapport sur le marché des équipements de qualité énergétique est divisée en cinq régions : Amérique du Nord, Asie-Pacifique, Europe, Moyen-Orient et Afrique, et Amérique du Sud et centrale.
Dans la région Asie-Pacifique, l'industrie manufacturière est essentielle pour stimuler l'économie de nombreux pays, la Chine étant le principal contributeur à la production manufacturière mondiale. Le Japon, l'Inde, la Corée du Sud et l'Indonésie sont également des contributeurs importants de la région. Dans le même temps, le Vietnam, la Malaisie et Singapour devraient accroître leur présence sur le marché de cette industrie dans les années à venir. Cela met en évidence la diversité des activités manufacturières dans la région Asie-Pacifique, qui influencent le besoin d'équipements de qualité énergétique.
Aperçu régional du marché des équipements de qualité de l'énergie
Les tendances et facteurs régionaux influençant le marché des équipements de qualité de l'énergie tout au long de la période de prévision ont été expliqués en détail par les analystes d'Insight Partners. Cette section traite également des segments et de la géographie du marché des équipements de qualité de l'énergie en Amérique du Nord, en Europe, en Asie-Pacifique, au Moyen-Orient et en Afrique, ainsi qu'en Amérique du Sud et en Amérique centrale.
- Obtenez les données régionales spécifiques au marché des équipements de qualité de l'énergie
Portée du rapport sur le marché des équipements de qualité de l'énergie
| Attribut de rapport | Détails |
|---|---|
| Taille du marché en 2023 | 32,51 milliards de dollars américains |
| Taille du marché d'ici 2031 | 55,02 milliards de dollars américains |
| Taux de croissance annuel composé mondial (2023-2031) | 6,8% |
| Données historiques | 2021-2022 |
| Période de prévision | 2024-2031 |
| Segments couverts |
Par équipement
|
| Régions et pays couverts |
Amérique du Nord
|
| Leaders du marché et profils d'entreprises clés |
|
Densité des acteurs du marché des équipements de qualité de l'énergie : comprendre son impact sur la dynamique des entreprises
Le marché des équipements de qualité de l'énergie connaît une croissance rapide, tirée par la demande croissante des utilisateurs finaux en raison de facteurs tels que l'évolution des préférences des consommateurs, les avancées technologiques et une plus grande sensibilisation aux avantages du produit. À mesure que la demande augmente, les entreprises élargissent leurs offres, innovent pour répondre aux besoins des consommateurs et capitalisent sur les tendances émergentes, ce qui alimente davantage la croissance du marché.
La densité des acteurs du marché fait référence à la répartition des entreprises ou des sociétés opérant sur un marché ou un secteur particulier. Elle indique le nombre de concurrents (acteurs du marché) présents sur un marché donné par rapport à sa taille ou à sa valeur marchande totale.
Les principales entreprises opérant sur le marché des équipements de qualité de l'énergie sont :
- Acuméntrique
- Société d'Électricité Emerson
- AMETEK Inc.
- Eaton
- Compagnie Générale d'Électricité
- Schneider Electric SE
Avis de non-responsabilité : les sociétés répertoriées ci-dessus ne sont pas classées dans un ordre particulier.
- Obtenez un aperçu des principaux acteurs du marché des équipements de qualité de l'énergie
Actualités et développements récents du marché des équipements de qualité de l'énergie
Le marché des équipements de qualité de l'énergie est évalué en collectant des données qualitatives et quantitatives après des recherches primaires et secondaires, qui comprennent d'importantes publications d'entreprise, des données d'association et des bases de données. Quelques-uns des développements sur le marché des équipements de qualité de l'énergie sont énumérés ci-dessous :
- Eaton (NYSE : ETN), société de gestion d'énergie, a annoncé aujourd'hui avoir finalisé l'acquisition de Tripp Lite. Basée à Chicago, dans l'Illinois, Tripp Lite est un fournisseur leader de produits de qualité d'énergie et de solutions de connectivité, notamment des systèmes d'alimentation sans interruption monophasés, des unités de distribution d'énergie en rack, des parasurtenseurs et des boîtiers pour les centres de données, les marchés industriels, médicaux et des communications dans les Amériques.
(Source : Eaton, communiqué de presse, mars 2021)
Rapport sur le marché des équipements de qualité de l'énergie
Le rapport « Taille et prévisions du marché des équipements de qualité de l’énergie (2021-2031) » fournit une analyse détaillée du marché couvrant les domaines ci-dessous :
- Taille et prévisions du marché des équipements de qualité de l'énergie aux niveaux mondial, régional et national pour tous les segments de marché clés couverts par le champ d'application
- Tendances du marché des équipements de qualité de l'énergie ainsi que la dynamique du marché, comme les facteurs moteurs, les contraintes et les opportunités clés
- Analyse détaillée des cinq forces de PEST/Porter et SWOT
- Analyse du marché des équipements de qualité de l'énergie couvrant les principales tendances du marché, le cadre mondial et régional, les principaux acteurs, les réglementations et les développements récents du marché
- Analyse du paysage industriel et de la concurrence couvrant la concentration du marché, l'analyse de la carte thermique, les principaux acteurs et les développements récents pour le marché des équipements de qualité de l'énergie
- Profils d'entreprise détaillés

Naveen est un professionnel expérimenté des études de marché et du conseil, fort de plus de 9 ans d'expertise dans des projets personnalisés, syndiqués et de conseil. Actuellement vice-président associé, il a géré avec succès les parties prenantes tout au long de la chaîne de valeur des projets et a rédigé plus de 100 rapports de recherche et plus de 30 missions de conseil. Son expertise couvre des projets industriels et gouvernementaux, contribuant significativement à la réussite de ses clients et à la prise de décision fondée sur les données.
Naveen est titulaire d'un diplôme d'ingénieur en électronique et communication de la VTU, Karnataka, et d'un MBA en marketing et opérations de l'Université de Manipal. Membre actif de l'IEEE depuis 9 ans, il a participé à des conférences et des colloques techniques et s'est porté volontaire au niveau des sections et des régions. Avant d'occuper ce poste, il a travaillé comme consultant stratégique associé chez IndustryARC et comme consultant en serveurs industriels chez Hewlett Packard (HP Global).
- Analyse complète de la taille du marché et prévisions
- Analyse détaillée de la segmentation
- Évaluation approfondie de la dynamique du marché
- Aperçus par région et par pays
- Paysage concurrentiel et analyse comparative des entreprises
- Intelligence économique stratégique
Témoignages
Le rapport sur le marché des systèmes SCADA d'Insight Partners est complet et fournit des informations précieuses sur les tendances actuelles et les prévisions. L'équipe a fait preuve d'un grand professionnalisme, d'une grande réactivité et d'un grand soutien tout au long du projet. Nous sommes très satisfaits et recommandons vivement leurs services.
RAN KEDEM Partenaire, Reali Technologies LTDJ'ai demandé un rapport sur un marché logiciel très spécifique et l'équipe l'a produit en quelques jours. Les informations étaient très pertinentes et bien présentées. J'ai ensuite demandé des modifications et des ajouts au rapport. L'équipe a de nouveau été très réactive et j'ai reçu le rapport final en moins d'une semaine.
JEAN-HERVÉ JENN Président, Future AnalyticaNous avons collaboré avec The Insight Partners pour une importante étude de marché et des prévisions. Ils nous ont fourni une vision claire des opportunités et des risques, ce qui nous a aidés à élaborer nos plans. Leurs recherches étaient faciles à utiliser et basées sur des données solides. Elles nous ont permis de prendre des décisions éclairées et en toute confiance. Nous les recommandons vivement.
PIYUSH NAGPAL Vice-président principal, Feux de route mondiauxInsight Partners a réalisé une étude de marché pertinente et bien structurée, avec une solide expertise du domaine. Son équipe a fait preuve de professionnalisme et de réactivité tout au long du projet. Son site web convivial a facilité l'accès aux rapports sectoriels. Nous recommandons vivement ses services d'études fiables et de haute qualité.
YUKIHIKO ADACHI PDG, Bleu profond, LLC.C'est la première fois que j'achète une étude de marché auprès de The Insight Partners. J'étais un peu hésitant au début, mais j'ai consulté leur site web et me suis senti plus à l'aise pour prendre le risque d'acheter une étude de marché. Je suis entièrement satisfait de la qualité du rapport et du service client. J'avais plusieurs questions et commentaires concernant le rapport initial, mais après quelques échanges par e-mail avec leur analyste, je pense avoir obtenu un rapport qui pourra alimenter notre processus de planification stratégique. Merci beaucoup pour votre temps et pour avoir rendu cette expérience positive. Je recommanderai sans hésiter vos services et vous serez mon premier contact lorsque nous aurons besoin de données de marché supplémentaires.
JOHN SUZUKI Président-directeur général, administrateur du conseil d'administration, BK TechnologiesJe tiens à vous remercier pour votre soutien et le professionnalisme dont vous avez fait preuve lors du traitement de ma demande d'informations concernant le marché des dispositifs de diagnostic in vitro (DIV) pour les maladies infectieuses au Nigéria. J'apprécie votre patience, vos conseils et votre volonté d'offrir une réduction, ce qui nous a finalement permis de conclure un accord. Je me réjouis de collaborer à nouveau avec The Insight Partners, grâce à l'impression que vous m'avez laissée suite à cette première rencontre.
DR CHIJIOKE DIRECTEUR GÉNÉRAL D'ONYIA, PineCrest Healthcare Ltd.Raison d'acheter
- Prise de décision éclairée
- Compréhension de la dynamique du marché
- Analyse concurrentielle
- Connaissances clients
- Prévisions de marché
- Atténuation des risques
- Planification stratégique
- Justification des investissements
- Identification des marchés émergents
- Amélioration des stratégies marketing
- Amélioration de l'efficacité opérationnelle
- Alignement sur les tendances réglementaires


