
Informe de mercado de conmutadores de presentación 2027 por segmentos, geografía, dinámica, desarrollos recientes e ideas estratégicas
Informe de mercado de conmutadores de presentación 2027 por segmentos, geografía, dinámica, desarrollos recientes e ideas estratégicas
- Estado : Publicada
- Código de informe : TIPRE00005588
- Categoría : Electrónica y semiconductores
- Número de páginas : 141
- Formatos de informe disponibles :


- Fecha de última actualización : June 17, 2024

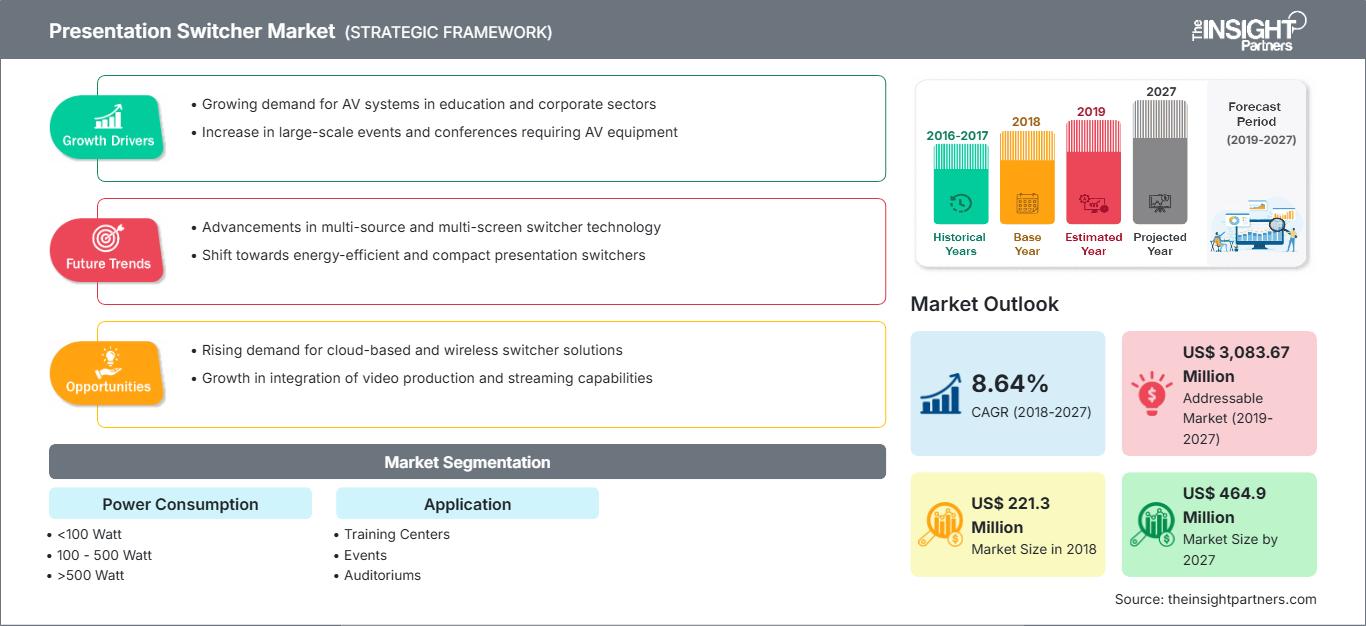
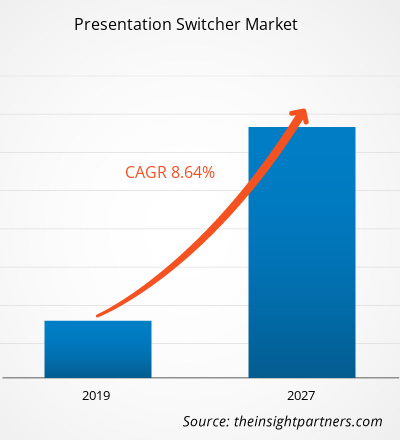
El mercado de conmutadores de presentación representó US$ 221,3 millones en 2018; se espera que crezca a una CAGR de 8,64% durante el período de pronóstico, para alcanzar US$ 464,9 millones en 2027.
La región Asia Pacífico representa la mayor participación en este mercado, seguida de Europa y Norteamérica. Asia Pacífico lidera el mercado de mezcladores de presentaciones. Debido al auge de la industria de eventos en la región, los profesionales del marketing buscan equipos adecuados para sus programas. Actualmente, con la creciente inversión en centros de formación, eventos, estadios y arenas, y el desarrollo de la tecnología y los datos, las empresas se centran en la adopción de mezcladores de presentaciones para ofrecer efectos de audio y vídeo avanzados. Además, se estima que Asia Pacífico obtendrá una participación significativa en los ingresos del mercado total gracias al crecimiento económico y al aumento de las iniciativas de digitalización en la región.
Obtendrá personalización en cualquier informe, sin cargo, incluidas partes de este informe o análisis a nivel de país, paquete de datos de Excel, así como también grandes ofertas y descuentos para empresas emergentes y universidades.
Mercado de conmutadores de presentación: Perspectivas estratégicas
-
Obtenga las principales tendencias clave del mercado de este informe.Esta muestra GRATUITA incluirá análisis de datos, desde tendencias del mercado hasta estimaciones y pronósticos.
Perspectivas del mercado
El creciente número de estadios y arenas en todo el mundo está impulsando la demanda del mercado de conmutadores de presentación.
El número de estadios aumenta a nivel mundial a medida que la industria deportiva se acentúa en cuanto al número de eventos. El creciente número de estadios y arenas en todo el mundo impulsa el mercado de los conmutadores de presentación, ya que cada estadio y arena busca tecnologías de transmisión eficientes. Los conmutadores de presentación ofrecen múltiples entradas y salidas a través de un solo dispositivo. La transmisión en vivo de eventos deportivos implica la transmisión de señales a larga distancia para facilitar el acceso a espectadores distantes, y los conmutadores de presentación desempeñan un papel importante en las tecnologías de transmisión convencionales. Por lo tanto, el aumento mundial del número de estadios y arenas está impulsando el mercado de los conmutadores de presentación.
La creciente concienciación sobre los conmutadores de presentación en los países en desarrollo ofrece una oportunidad próspera para el mercado de los conmutadores de presentación.
El mercado de conmutadores de presentación ha madurado en los países desarrollados de Norteamérica, Europa y Asia-Pacífico. Sin embargo, varios países en desarrollo de Asia-Pacífico, Oriente Medio, África y Sudamérica están adquiriendo mayor conciencia sobre la tecnología de conmutadores de presentación. Este factor representa una oportunidad clave para que los actores del mercado de conmutadores de presentación expandan su presencia global y aumenten sus ingresos anuales año tras año.
Información sobre el consumo de energía
El mercado global de conmutadores de presentación, según su consumo de energía, se clasifica en <100 vatios, 100-500 vatios y >500 vatios. Se estima que el segmento de <100 vatios dominará el mercado de conmutadores de presentación en 2018, mientras que el de 101-500 vatios presenta la mayor tasa de crecimiento anual compuesta (TCAC). Se espera que la demanda de conmutadores de presentación con un consumo de energía de 100-500 vatios se dispare en los próximos años debido a la creciente necesidad de conmutadores de presentación en estadios y arenas. Varios países están invirtiendo cantidades sustanciales en la expansión de estadios deportivos, lo que se prevé que catalice la demanda de conmutadores de presentación de 100-500 vatios.
Perspectivas de la aplicación
El mercado global de conmutadores de presentación, por aplicación, se segmenta en centros de capacitación, eventos, auditorios, estadios, museos y planetarios, entre otros. Se proyecta que este segmento domine el mercado de conmutadores de presentación durante el período de pronóstico. Los centros que ofrecen capacitación en aulas incluyen videograbadoras (es decir, grabadoras de videocasete), computadoras tradicionales basadas en VGA (es decir, basadas en matriz de gráficos de video), computadoras equipadas con HDMI (es decir, con interfaz multimedia de alta definición), iPads y pizarras interactivas, que requieren una integración económica. Además, las salas de conferencias están diseñadas para dar cabida a una amplia variedad de presentadores en todo el mundo.
Se espera que el crecimiento de las actividades de investigación y desarrollo de los fabricantes de conmutadores de presentación para la introducción de tecnologías futuras contribuya al mercado global de conmutadores de presentación en los próximos años. A continuación, se enumeran algunos de los desarrollos recientes:
2019: Atlona comenzó a distribuir el conmutador de presentación matricial 6×2 como parte de las nuevas ofertas estratégicas de su serie Omega, en rápido crecimiento.
2018: Analog Way anunció su nuevo acuerdo de distribución con LANG BARANDAY AG para Suiza.
2017: Presentation Switchers Inc. lanzó el PS105, el primero de su serie AV+IoT de conmutadores de presentación digitales compactos, diseñados para la colaboración y espacios reducidos en salas de conferencias.
Perspectivas regionales del mercado de conmutadores de presentación
Los analistas de The Insight Partners han explicado detalladamente las tendencias regionales y los factores que influyen en el mercado de conmutadores de presentación durante el período de pronóstico. Esta sección también analiza los segmentos y la geografía del mercado de conmutadores de presentación en América del Norte, Europa, Asia Pacífico, Oriente Medio y África, y América del Sur y Central.
Alcance del informe de mercado de conmutadores de presentación
| Atributo del informe | Detalles |
|---|---|
| Tamaño del mercado en 2018 | US$ 221,3 millones |
| Tamaño del mercado en 2027 | US$ 464,9 millones |
| CAGR global (2018-2027) | 8,64% |
| Datos históricos | 2016-2017 |
| Período de pronóstico | 2019-2027 |
| Segmentos cubiertos |
Por consumo de energía
|
| Regiones y países cubiertos |
América del norte
|
| Líderes del mercado y perfiles de empresas clave |
|
Densidad de actores del mercado de conmutadores de presentación: comprensión de su impacto en la dinámica empresarial
El mercado de conmutadores de presentación está creciendo rápidamente, impulsado por la creciente demanda del usuario final debido a factores como la evolución de las preferencias de los consumidores, los avances tecnológicos y una mayor conciencia de los beneficios del producto. A medida que aumenta la demanda, las empresas amplían su oferta, innovan para satisfacer las necesidades de los consumidores y aprovechan las tendencias emergentes, lo que impulsa aún más el crecimiento del mercado.
- Obtenga una descripción general de los principales actores clave del mercado de conmutadores de presentación
INTERCAMBIADOR DE PRESENTACIÓN GLOBAL – SEGMENTACIÓN DEL MERCADO
Por consumo de energía
- <100 vatios
- 100 – 500 vatios
- >500 vatios
Por aplicación
- Centro de formación
- Eventos
- Auditorios
- Estadios y Arenas
- Museos y planetarios
- Otros
Por geografía
-
América del norte
- A NOSOTROS
- Canadá
- México
-
Europa
- Francia
- Alemania
- Reino Unido
- Italia
- Rusia
- Resto de Europa
-
Asia Pacífico (APAC)
- Australia
- Porcelana
- India
- Japón
- Corea del Sur
- Resto de APAC
-
Oriente Medio y África (MEA)
- Arabia Saudita
- Sudáfrica
- Emiratos Árabes Unidos
- Resto de MEA
-
América del Sur (SAM)
- Brasil
- Resto de SAM
Perfiles de empresas
- Atlona Inc. (Panduit)
- SAS de forma analógica
- Barco NV
- Crestron Electronics, Inc.
- Sistemas digitales Christie, Inc.
- CYP (Reino Unido) Ltd.
- FSR, Inc.
- Industrias internacionales Harman
- LogicAV
- Conmutadores de presentación, Inc.
Otros actores del mercado de la cadena de valor:
Kramer Electronics Ltd., Extron, ATEN, DVIGear, Inc. y Black Box Corporation son algunos otros actores del mercado de la cadena de valor que no están perfilados en el informe, pero que pueden incluirse si se solicita.

Naveen es un experimentado profesional en investigación de mercados y consultoría con más de 9 años de experiencia en proyectos personalizados, sindicados y de consultoría. Actualmente se desempeña como Vicepresidente Asociado, donde ha gestionado con éxito a las partes interesadas en toda la cadena de valor del proyecto y ha redactado más de 100 informes de investigación y más de 30 proyectos de consultoría. Su trabajo abarca proyectos industriales y gubernamentales, contribuyendo significativamente al éxito de los clientes y a la toma de decisiones basada en datos.
Naveen es licenciado en Ingeniería Electrónica y Comunicaciones por la VTU (Karnataka) y tiene un MBA en Marketing y Operaciones por la Universidad de Manipal. Ha sido miembro activo del IEEE durante 9 años, participando en conferencias, simposios técnicos y realizando voluntariado tanto a nivel de sección como regional. Antes de su puesto actual, trabajó como Consultor Estratégico Asociado en IndustryARC y como Consultor de Servidores Industriales en Hewlett Packard (HP Global).
- Análisis exhaustivo del tamaño del mercado y previsiones
- Análisis detallado de la segmentación
- Evaluación en profundidad de la dinámica del mercado
- Información a nivel regional y nacional
- Panorama competitivo y análisis comparativo de empresas
- Inteligencia empresarial estratégica
Testimonios
El informe de mercado de sistemas SCADA de Insight Partners es completo y ofrece información valiosa sobre las tendencias actuales y las previsiones futuras. El equipo fue altamente profesional, receptivo y me brindó un gran apoyo en todo momento. Estamos muy satisfechos y recomendamos ampliamente sus servicios.
RAN KEDEM Socio, Reali Technologies LTDsSolicité un informe sobre un mercado de software muy específico y el equipo lo elaboró en pocos días. La información era muy relevante y estaba bien presentada. Posteriormente, solicité algunos cambios y adiciones al informe. El equipo fue muy receptivo y recibí el informe final en menos de una semana.
JEAN-HERVE JENN Presidente, Future AnalyticaTrabajamos con The Insight Partners para un importante estudio y pronóstico de mercado. Nos brindaron una visión clara de las oportunidades y los riesgos, lo que nos ayudó a definir nuestros planes. Su investigación fue fácil de usar y se basó en datos sólidos. Nos ayudó a tomar decisiones inteligentes y seguras. Los recomendamos ampliamente.
PIYUSH NAGPAL Vicepresidente Sénior, , High Beam GlobalThe Insight Partners realizó una investigación de mercado profunda y bien estructurada con una sólida experiencia en el sector. Su equipo fue profesional y receptivo en todo momento. El sitio web, fácil de usar, facilitó el acceso a los informes del sector. Los recomendamos ampliamente por sus servicios de investigación confiables y de alta calidad.
YUKIHIKO ADACHI Director Ejecutivo, , Deep Blue, LLCEsta es la primera vez que compro un informe de mercado de The Insight Partners. Aunque al principio tenía dudas, visité su sitio web y me sentí más cómodo al arriesgarme y comprarlo. Estoy completamente satisfecho con la calidad del informe y el servicio al cliente. Tenía varias preguntas y comentarios sobre el informe inicial, pero después de un par de conversaciones por correo electrónico con su analista, creo que tengo un informe que puedo usar como base para nuestro proceso de planificación estratégica. Muchas gracias por tomarse el tiempo y hacer de esta una experiencia positiva. Sin duda, recomendaré sus servicios y serán mi primera opción cuando necesitemos más datos de mercado.
JOHN SUZUKI Presidente y Director Ejecutivo, Director de la Junta Directiva, BK TechnologiesAgradezco su apoyo y la profesionalidad que demostraron al atender mi solicitud de información sobre el mercado de diagnóstico in vitro (IVD) para enfermedades infecciosas en Nigeria. Agradezco su paciencia, su orientación y su disposición a ofrecerme un descuento, lo que finalmente nos permitió cerrar un trato. Espero poder colaborar con The Insight Partners en el futuro, gracias a la impresión que me causó este primer encuentro.
DRA. CHIJIOKE ONYIA, DIRECTORA GENERAL, PineCrest Healthcare Ltd.Razón para comprar
- Toma de decisiones informada
- Comprensión de la dinámica del mercado
- Análisis competitivo
- Información sobre clientes
- Pronósticos del mercado
- Mitigación de riesgos
- Planificación estratégica
- Justificación de la inversión
- Identificación de mercados emergentes
- Mejora de las estrategias de marketing
- Impulso de la eficiencia operativa
- Alineación con las tendencias regulatorias


