
Analyse et prévisions du marché des commutateurs de présentation par taille, part, croissance et tendances 2027
Marché des commutateurs de présentation jusqu'en 2027 : Analyse et prévisions mondiales par consommation électrique (< 100 W, 100 - 500 W, > 500 W) ; applications (centres de formation, événements, auditoriums, stades et arènes, musées et planétariums, autres)
- Statut : Publié
- Code du rapport : TIPRE00005588
- Catégorie : Électronique et semi-conducteurs
- Nombre de pages : 141
- Formats de rapport disponibles :


- Date de dernière mise à jour : June 17, 2024

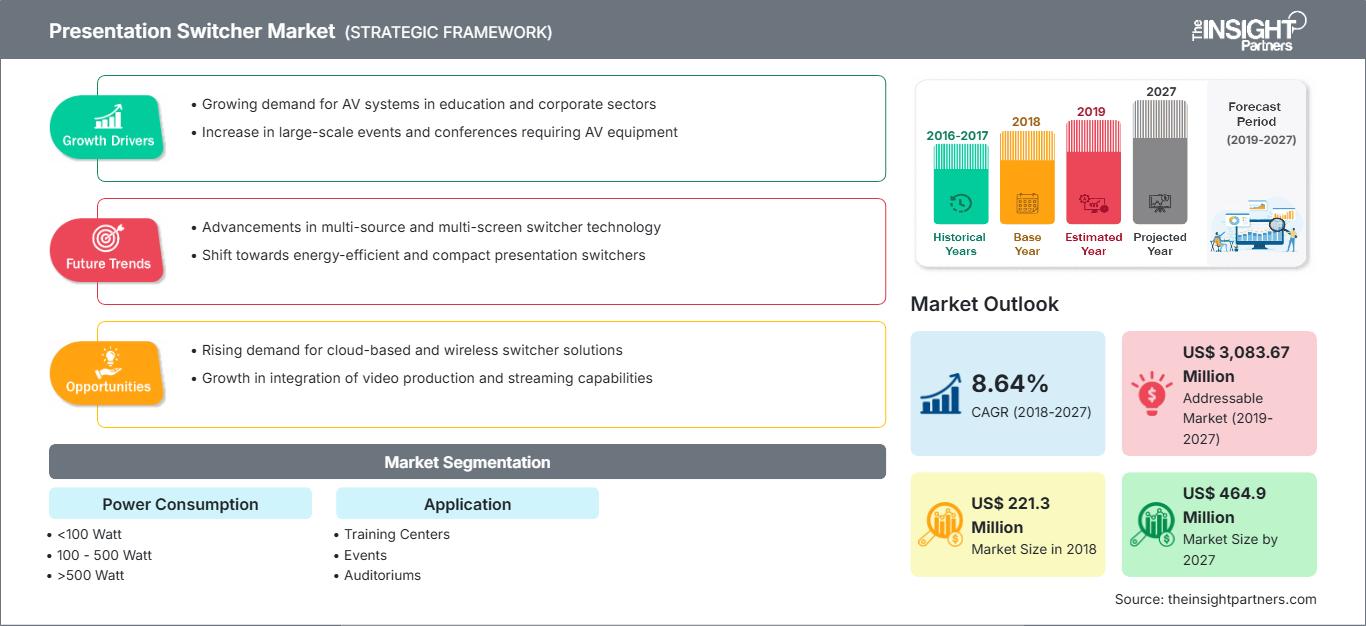
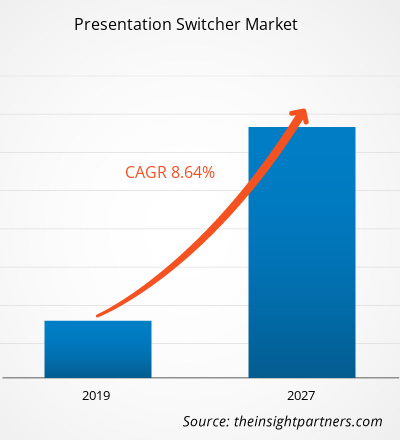
Le marché des commutateurs de présentation représentait 221,3 millions de dollars US en 2018 ; il devrait croître à un TCAC de 8,64 % au cours de la période de prévision, pour atteindre 464,9 millions de dollars US d’ici 2027.
L’Asie-Pacifique représente la plus grande part de ce marché, suivie de l’Europe, puis de l’Amérique du Nord. L’Asie-Pacifique domine le marché des commutateurs de présentation. En raison de la croissance du secteur de l’événementiel dans la région APAC, les spécialistes du marketing recherchent des équipements adaptés à leurs programmes événementiels. Aujourd’hui, avec l’augmentation des investissements dans les centres de formation, les événements, les stades et les arènes, et le développement des technologies et des données, les entreprises se concentrent fortement sur l’adoption de commutateurs de présentation pour produire des effets audio et vidéo avancés. Par ailleurs, la région APAC devrait gagner une part significative du chiffre d’affaires du marché total grâce à la croissance économique et à l’essor des initiatives de numérisation dans la région.
Personnalisez ce rapport en fonction de vos besoins
Vous bénéficierez d’une personnalisation sur n’importe quel rapport - gratuitement - y compris des parties de ce rapport, ou une analyse au niveau du pays, un pack de données Excel, ainsi que de profiter d’offres exceptionnelles et de réductions pour les start-ups et les universités
Marché des commutateurs de présentation: Perspectives stratégiques
-
Obtenez les principales tendances clés du marché de ce rapport.Cet échantillon GRATUIT comprendra une analyse de données, allant des tendances du marché aux estimations et prévisions.
Le nombre de stades augmente à l'échelle mondiale, car l'industrie du sport se concentre sur le nombre d'événements. L'augmentation du nombre de stades et d'arènes à travers le monde favorise le marché des commutateurs de présentation, car chaque stade et arène recherche des technologies de diffusion efficaces. Les commutateurs de présentation offrent plusieurs entrées et sorties via un seul appareil. La diffusion en direct d'événements sportifs implique la transmission longue portée des signaux pour un accès facile aux téléspectateurs distants, et les commutateurs de présentation jouent un rôle important dans les technologies de diffusion conventionnelles. Ainsi, l'augmentation mondiale du nombre de stades et d'arènes stimule le marché des commutateurs de présentation.
La sensibilisation croissante aux commutateurs de présentation dans les pays en développement offre une opportunité prospère au marché des commutateurs de présentation.
Le marché des commutateurs de présentation a atteint sa maturité dans les pays développés d'Amérique du Nord, d'Europe et d'Asie-Pacifique. Cependant, plusieurs pays en développement d'Asie-Pacifique, du Moyen-Orient, d'Afrique et d'Amérique du Sud s'intéressent de plus en plus à la technologie des commutateurs de présentation. Ce facteur constitue une opportunité clé pour les acteurs du marché des commutateurs de présentation d'étendre leur présence mondiale et d'améliorer leurs revenus annuels d'année en année.
Informations sur la consommation d'énergie
Le marché mondial des commutateurs de présentation par consommation d'énergie est classé en <100 watts, 100 à 500 watts et >500 watts. Le segment <100 watts devrait dominer le marché des commutateurs de présentation en 2018, tandis que le déploiement de 101 à 500 watts connaît le TCAC le plus élevé. La demande de commutateurs de présentation d'une consommation d'énergie de 100 à 500 watts devrait exploser dans les années à venir en raison du besoin croissant de commutateurs de présentation dans les stades et les arènes. Plusieurs pays investissent des sommes considérables dans l'agrandissement des stades, ce qui devrait catalyser la demande de commutateurs de présentation de 100 à 500 watts.
Aperçu des applications
Le marché mondial des commutateurs de présentation est segmenté en centres de formation, événements, auditoriums, stades et arènes, musées et planétariums, entre autres. Le segment des centres de formation devrait dominer le marché des commutateurs de présentation tout au long de la période de prévision. Les centres de formation en salle de classe comprennent les magnétoscopes (magnétoscopes), les PC VGA (basés sur une matrice graphique vidéo), les PC équipés de ports HDMI (avec interface multimédia haute définition), les iPad et les tableaux interactifs, qui doivent être intégrés à bas prix. De plus, les salles de conférence sont conçues pour accueillir une grande variété de présentateurs à travers le monde.
La croissance des activités de recherche et développement des fournisseurs de commutateurs de présentation pour l'introduction de technologies futures devrait également contribuer au marché mondial des commutateurs de présentation dans les années à venir. Voici quelques-unes des évolutions récentes :
2019 : Atlona a commencé à livrer un commutateur de présentation matriciel 6×2 dans le cadre des nouvelles offres stratégiques de sa série Omega en pleine expansion.
2018 : Analog Way a annoncé un nouvel accord de distribution avec LANG BARANDAY AG pour la Suisse.
2017 : Presentation Switchers Inc. a lancé le PS105, le premier de sa série AV+IoT de commutateurs de présentation numériques compacts destinés aux espaces de collaboration et aux petites salles de conférence.
Aperçu régional du marché des commutateurs de présentation
Les tendances régionales et les facteurs influençant le marché des commutateurs de présentation tout au long de la période de prévision ont été analysés en détail par les analystes de The Insight Partners. Cette section aborde également les segments et la géographie du marché des commutateurs de présentation en Amérique du Nord, en Europe, en Asie-Pacifique, au Moyen-Orient et en Afrique, ainsi qu'en Amérique du Sud et en Amérique centrale.
Portée du rapport sur le marché des commutateurs de présentation
| Attribut de rapport | Détails |
|---|---|
| Taille du marché en 2018 | US$ 221.3 Million |
| Taille du marché par 2027 | US$ 464.9 Million |
| TCAC mondial (2018 - 2027) | 8.64% |
| Données historiques | 2016-2017 |
| Période de prévision | 2019-2027 |
| Segments couverts |
By Consommation électrique
|
| Régions et pays couverts |
Amérique du Nord
|
| Leaders du marché et profils d'entreprises clés |
|
Densité des acteurs du marché des commutateurs de présentation : comprendre son impact sur la dynamique des entreprises
Le marché des commutateurs de présentation connaît une croissance rapide, porté par une demande croissante des utilisateurs finaux, due à des facteurs tels que l'évolution des préférences des consommateurs, les avancées technologiques et une meilleure connaissance des avantages du produit. Face à cette demande croissante, les entreprises élargissent leur offre, innovent pour répondre aux besoins des consommateurs et capitalisent sur les nouvelles tendances, ce qui alimente la croissance du marché.
- Obtenez le Marché des commutateurs de présentation Aperçu des principaux acteurs clés

Naveen est un professionnel expérimenté des études de marché et du conseil, fort de plus de 9 ans d'expertise dans des projets personnalisés, syndiqués et de conseil. Actuellement vice-président associé, il a géré avec succès les parties prenantes tout au long de la chaîne de valeur des projets et a rédigé plus de 100 rapports de recherche et plus de 30 missions de conseil. Son expertise couvre des projets industriels et gouvernementaux, contribuant significativement à la réussite de ses clients et à la prise de décision fondée sur les données.
Naveen est titulaire d'un diplôme d'ingénieur en électronique et communication de la VTU, Karnataka, et d'un MBA en marketing et opérations de l'Université de Manipal. Membre actif de l'IEEE depuis 9 ans, il a participé à des conférences et des colloques techniques et s'est porté volontaire au niveau des sections et des régions. Avant d'occuper ce poste, il a travaillé comme consultant stratégique associé chez IndustryARC et comme consultant en serveurs industriels chez Hewlett Packard (HP Global).
- Analyse complète de la taille du marché et prévisions
- Analyse détaillée de la segmentation
- Évaluation approfondie de la dynamique du marché
- Aperçus par région et par pays
- Paysage concurrentiel et analyse comparative des entreprises
- Intelligence économique stratégique
Témoignages
Le rapport sur le marché des systèmes SCADA d'Insight Partners est complet et fournit des informations précieuses sur les tendances actuelles et les prévisions. L'équipe a fait preuve d'un grand professionnalisme, d'une grande réactivité et d'un grand soutien tout au long du projet. Nous sommes très satisfaits et recommandons vivement leurs services.
RAN KEDEM Partenaire, Reali Technologies LTDJ'ai demandé un rapport sur un marché logiciel très spécifique et l'équipe l'a produit en quelques jours. Les informations étaient très pertinentes et bien présentées. J'ai ensuite demandé des modifications et des ajouts au rapport. L'équipe a de nouveau été très réactive et j'ai reçu le rapport final en moins d'une semaine.
JEAN-HERVÉ JENN Président, Future AnalyticaNous avons collaboré avec The Insight Partners pour une importante étude de marché et des prévisions. Ils nous ont fourni une vision claire des opportunités et des risques, ce qui nous a aidés à élaborer nos plans. Leurs recherches étaient faciles à utiliser et basées sur des données solides. Elles nous ont permis de prendre des décisions éclairées et en toute confiance. Nous les recommandons vivement.
PIYUSH NAGPAL Vice-président principal, Feux de route mondiauxInsight Partners a réalisé une étude de marché pertinente et bien structurée, avec une solide expertise du domaine. Son équipe a fait preuve de professionnalisme et de réactivité tout au long du projet. Son site web convivial a facilité l'accès aux rapports sectoriels. Nous recommandons vivement ses services d'études fiables et de haute qualité.
YUKIHIKO ADACHI PDG, Bleu profond, LLC.C'est la première fois que j'achète une étude de marché auprès de The Insight Partners. J'étais un peu hésitant au début, mais j'ai consulté leur site web et me suis senti plus à l'aise pour prendre le risque d'acheter une étude de marché. Je suis entièrement satisfait de la qualité du rapport et du service client. J'avais plusieurs questions et commentaires concernant le rapport initial, mais après quelques échanges par e-mail avec leur analyste, je pense avoir obtenu un rapport qui pourra alimenter notre processus de planification stratégique. Merci beaucoup pour votre temps et pour avoir rendu cette expérience positive. Je recommanderai sans hésiter vos services et vous serez mon premier contact lorsque nous aurons besoin de données de marché supplémentaires.
JOHN SUZUKI Président-directeur général, administrateur du conseil d'administration, BK TechnologiesJe tiens à vous remercier pour votre soutien et le professionnalisme dont vous avez fait preuve lors du traitement de ma demande d'informations concernant le marché des dispositifs de diagnostic in vitro (DIV) pour les maladies infectieuses au Nigéria. J'apprécie votre patience, vos conseils et votre volonté d'offrir une réduction, ce qui nous a finalement permis de conclure un accord. Je me réjouis de collaborer à nouveau avec The Insight Partners, grâce à l'impression que vous m'avez laissée suite à cette première rencontre.
DR CHIJIOKE DIRECTEUR GÉNÉRAL D'ONYIA, PineCrest Healthcare Ltd.Raison d'acheter
- Prise de décision éclairée
- Compréhension de la dynamique du marché
- Analyse concurrentielle
- Connaissances clients
- Prévisions de marché
- Atténuation des risques
- Planification stratégique
- Justification des investissements
- Identification des marchés émergents
- Amélioration des stratégies marketing
- Amélioration de l'efficacité opérationnelle
- Alignement sur les tendances réglementaires


