
プレゼンテーションスイッチャー市場レポート 2027 - セグメント、地域、ダイナミクス、最近の開発、戦略的洞察
プレゼンテーションスイッチャー市場:2027年までの世界規模分析と予測(消費電力別:100ワット未満、100~500ワット、500ワット超)、用途(トレーニングセンター、イベント会場、講堂、スタジアム・アリーナ、博物館・プラネタリウム、その他)
- ステータス : 出版
- レポートコード : TIPRE00005588
- カテゴリー : エレクトロニクスおよび半導体
- ページ数 : 141
- 利用可能なレポート形式 :


- 最終更新日 : June 17, 2024

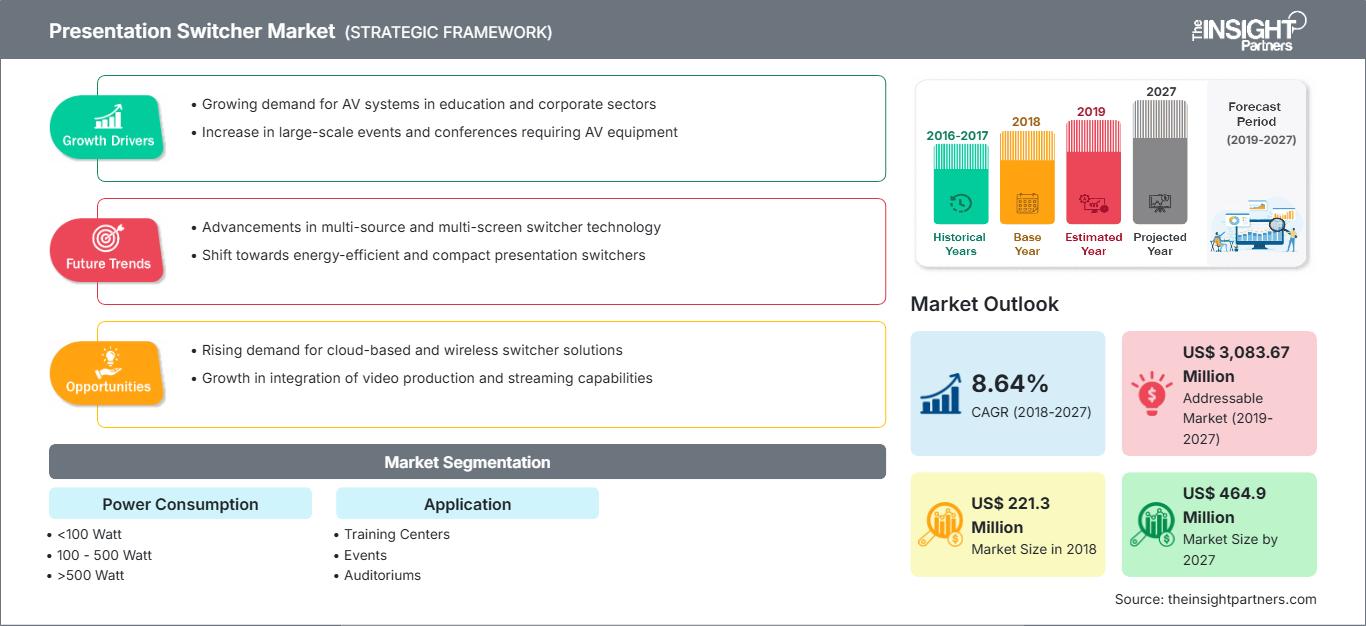
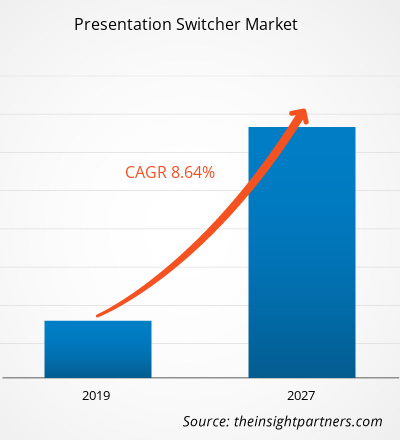
プレゼンテーションスイッチャー市場は、2018年に2億2,130万米ドルに達しました。予測期間中、年平均成長率(CAGR)8.64%で成長し、2027年には4億6,490万米ドルに達すると予想されています。
アジア太平洋地域は、この市場で最も高いシェアを占めており、次いでヨーロッパ、北米となっています。アジア太平洋地域は、イベント産業の成長に伴い、プレゼンテーションスイッチャー市場をリードしており、マーケティング担当者はイベントプログラムに適した機器を求めています。現在、トレーニングセンター、イベント、スタジアム、アリーナへの投資の増加、そしてテクノロジーとデータの発展に伴い、企業は高度なオーディオおよびビデオ効果を提供するプレゼンテーションスイッチャーの導入に注力しています。また、アジア太平洋地域は、経済成長とデジタル化の取り組みの高まりにより、市場全体で大きな収益シェアを獲得すると予測されています。
要件に合わせてレポートをカスタマイズ
レポートの一部、国レベルの分析、Excelデータパックなどを含め、スタートアップ&大学向けに特別オファーや割引もご利用いただけます(無償)
プレゼンテーションスイッチャー市場: 戦略的洞察
-
このレポートの主要な市場動向を入手してください。この無料サンプルには、市場動向から見積もりや予測に至るまでのデータ分析が含まれます。
スポーツ産業がイベント数の面で強調するにつれて、スタジアムの数は世界中で増加しています。世界中のスタジアムとアリーナの数の増加は、すべてのスタジアムとアリーナが効率的な放送技術を求めているため、プレゼンテーションスイッチャー市場を促進しています。プレゼンテーションスイッチャーは、単一のデバイスで複数の入力と出力を提供します。スポーツイベントのライブ放送では、遠くの視聴者に簡単にアクセスできるように信号を長距離伝送する必要があり、プレゼンテーションスイッチャーは従来の放送技術で重要な役割を果たしています。このように、スタジアムとアリーナの数の世界的な増加は、プレゼンテーションスイッチャー市場を強化しています。
発展途上国でのプレゼンテーションスイッチャーに関する意識の高まりは、プレゼンテーションスイッチャー市場に繁栄の機会を提供します
プレゼンテーションスイッチャー市場は、北米、ヨーロッパ、アジア太平洋の先進国で成熟しています。ただし、アジア太平洋、中東、アフリカ、南米のいくつかの発展途上国では、プレゼンテーションスイッチャー技術に関する認識が高まっています。 この要因は、プレゼンテーションスイッチャー市場のプレーヤーにとって、世界的な足跡を拡大し、年間収益を毎年向上させる重要な機会です。
消費電力の洞察
消費電力によって、世界のプレゼンテーションスイッチャー市場は、<100ワット、100~500ワット、>500ワットに分類されます。 100ワット未満のセグメントは2018年にプレゼンテーションスイッチャー市場を支配すると予測されていますが、101~500ワットの展開は最高のCAGRで成長しています。 スタジアムやアリーナでのプレゼンテーションスイッチャーの需要の高まりにより、消費電力が100~500ワットのプレゼンテーションスイッチャーの需要は今後数年間で急増すると予想されます。いくつかの国では、スポーツスタジアムの拡張に多額の投資を行っており、これが 100~500 ワットのプレゼンテーションスイッチャーの需要を促進すると見込まれています。
アプリケーションインサイト
世界のプレゼンテーションスイッチャー市場は、アプリケーション別に、トレーニングセンター、イベント、講堂、スタジアムおよびアリーナ、博物館およびプラネタリウム、その他に分類されています。トレーニングセンターセグメントは、予測期間を通じてプレゼンテーションスイッチャー市場の大部分を占めると予測されています。教室でのトレーニングを含むセンターには、VCR(ビデオカセットレコーダー)、旧式の VGA ベース(ビデオグラフィックアレイベース)の PC、HDMI 搭載(高解像度マルチメディアインターフェイス搭載)の PC、iPad、およびインタラクティブボードが含まれており、低価格で統合する必要があります。さらに、会議室は世界中の多種多様なプレゼンターに対応できるように構築されています。
プレゼンテーションスイッチャーベンダーによる将来技術の導入に向けた研究開発活動の拡大も、今後数年間で世界のプレゼンテーションスイッチャー市場の成長に貢献すると予想されています。最近の開発状況の一部を以下に示します。
2019年:Atlonaは、急成長中のOmegaシリーズの新たな戦略的製品の一部として、6×2マトリックスプレゼンテーションスイッチャーの出荷を開始しました。2018年:Analog Wayは、スイスにおけるLANG BARANDAY AGとの新たな販売契約を発表しました。2017年:Presentation Switchers Inc.は、コラボレーションや小規模会議室スペースを対象としたAV+IoTシリーズのコンパクトデジタルプレゼンテーションスイッチャーの第一弾として、PS105をリリースしました。
プレゼンテーションスイッチャー市場の地域別分析
予測期間を通じてプレゼンテーションスイッチャー市場に影響を与える地域的な傾向と要因は、The Insight Partnersのアナリストによって徹底的に解説されています。このセクションでは、北米、ヨーロッパ、アジア太平洋、中東・アフリカ、中南米におけるプレゼンテーションスイッチャー市場のセグメントと地域についても解説しています。
プレゼンテーションスイッチャー市場レポートの範囲
| レポート属性 | 詳細 |
|---|---|
| の市場規模 2018 | US$ 221.3 Million |
| 市場規模別 2027 | US$ 464.9 Million |
| 世界的なCAGR (2018 - 2027) | 8.64% |
| 過去データ | 2016-2017 |
| 予測期間 | 2019-2027 |
| 対象セグメント |
By 消費電力
|
| 対象地域と国 |
北米
|
| 市場リーダーと主要企業の概要 |
|
プレゼンテーションスイッチャー市場のプレーヤー密度:ビジネスダイナミクスへの影響を理解する
プレゼンテーションスイッチャー市場は、消費者の嗜好の変化、技術の進歩、製品メリットへの認知度の高まりといった要因によるエンドユーザー需要の高まりに牽引され、急速に成長しています。需要が高まるにつれ、企業は製品ラインナップの拡充、消費者ニーズへの対応、そして新たなトレンドの活用を進めており、これが市場の成長をさらに加速させています。
- 入手 プレゼンテーションスイッチャー市場 主要プレーヤーの概要
グローバル プレゼンテーション スイッチャー –市場セグメンテーション
消費電力別
- <100 ワット
- 100 – 500 ワット
- >500 ワット
用途別
- トレーニング センター
- イベント
- 講堂
- スタジアムおよびスタジアムアリーナ
- 美術館と博物館プラネタリウム
- その他
地域別
-
北米
- 米国
- カナダ
- メキシコ
-
ヨーロッパ
- フランス
- ドイツ
- 英国
- イタリア
- ロシア
- その他ヨーロッパ
-
アジア太平洋 (APAC)
- オーストラリア
- 中国
- インド
- 日本
- 韓国
- その他 APAC
-
中東 &アフリカ(MEA)
- サウジアラビア
- 南アフリカ
- UAE
- MEAのその他の地域
-
南米(SAM)
- ブラジル
- SAMのその他の地域
企業プロファイル
- Atlona Inc. (Panduit)
- Analog Way SAS
- Barco NV
- Crestron Electronics, Inc.
- Christie Digital Systems, Inc.
- CYP (UK) Ltd.
- FSR, Inc.
- Harman International Industries
- LogicAV
- Presentation Switchers, Inc.
バリューチェーンのその他の市場プレーヤー:
Kramer Electronics Ltd.、 Extron、ATEN、DVIGear、Inc.、Black Box Corporation はバリュー チェーンの他の市場プレーヤーであり、レポートには記載されていませんが、リクエストに応じてレポートに含めることができます。

Naveenは、カスタム、シンジケート、コンサルティングの各プロジェクトにおいて9年以上の実績を持つ、経験豊富な市場調査およびコンサルティングのプロフェッショナルです。現在はアソシエイトバイスプレジデントを務め、プロジェクトバリューチェーン全体にわたるステークホルダー管理を成功させ、100件以上の調査レポートと30件以上のコンサルティング案件を執筆しています。産業および政府機関のプロジェクトに幅広く携わり、クライアントの成功とデータに基づく意思決定に大きく貢献しています。
Naveenは、カルナータカ州VTUで電子通信工学の学位を取得し、マニパル大学でマーケティング&オペレーションズのMBAを取得しています。IEEEの会員として9年間活動し、会議や技術シンポジウムへの参加、セクションレベルおよび地域レベルでのボランティア活動に積極的に取り組んでいます。現職以前は、IndustryARCでアソシエイト戦略コンサルタント、Hewlett Packard(HP Global)で産業用サーバーコンサルタントを務めていました。
- 包括的な市場規模および予測分析
- 詳細なセグメンテーション分析
- 市場動向(ダイナミクス)の徹底的な評価
- 地域および国別のインサイト
- 競争環境および企業ベンチマーク
- 戦略的ビジネスインテリジェンス
お客様の声
Insight PartnersのSCADAシステム市場レポートは包括的で、現在のトレンドと将来の予測に関する貴重な洞察が含まれています。チームは終始、非常にプロフェッショナルで、対応が早く、サポートも充実していました。私たちは彼らのサービスに非常に満足しており、強くお勧めします。
ラン・ケデム パートナー, レアリテクノロジーズ株式会社非常に特殊なソフトウェア市場に関するレポートを依頼したところ、チームは数日でレポートを作成してくれました。情報は非常に関連性が高く、分かりやすくまとめられていました。その後、レポートにいくつか修正と追加を依頼しましたが、チームは非常に迅速に対応し、1週間も経たないうちに最終レポートを受け取ることができました。
ジャン=エルヴェ・ジェン 会長, フューチャー・アナリティカ重要な市場調査と予測のために、The Insight Partnersと協力しました。彼らは機会とリスクに関する明確な洞察を提供し、私たちの計画策定に役立ちました。彼らの調査は使いやすく、確かなデータに基づいており、賢明で自信に満ちた意思決定に役立ちました。彼らを強くお勧めします。
ピユーシュ・ナグパル 上級副社長, ハイビームグローバルInsight Partnersは、深い専門知識に基づき、洞察力に富み、構造化された市場調査を提供しました。チームは終始プロフェッショナルで、対応力も抜群でした。ユーザーフレンドリーなウェブサイトにより、業界レポートへのアクセスもスムーズでした。信頼性の高い高品質な調査サービスをお探しなら、Insight Partnersを強くお勧めします。
安達幸彦 最高経営責任者(CEO), ディープブルーLLC。The Insight Partnersから市場レポートを購入するのは今回が初めてです。最初は不安でしたが、ウェブサイトを見て、リスクを負ってでも購入してみようという気持ちになりました。レポートの品質とカスタマーサービスには大変満足しています。最初のレポートにはいくつか質問やコメントがありましたが、アナリストとメールで何度かやり取りした結果、戦略策定プロセスへのインプットとして活用できるレポートが完成しました。貴重なお時間を割いていただき、貴重な体験をさせていただき、誠にありがとうございました。他の方にもぜひお勧めしたいですし、今後さらに市場データが必要になった際には、まずThe Insight Partnersにご連絡させていただきます。
ジョン・スズキ 社長兼最高経営責任者、取締役, BKテクノロジーズナイジェリアの感染症IVD市場に関する情報提供依頼に対し、ご対応いただいた際、ご尽力とプロフェッショナルな姿勢に深く感謝申し上げます。忍耐強く、的確なアドバイスをいただき、また、最終的に取引成立に至った割引のご提供にも深く感謝申し上げます。今回の最初の出会いで得た強い印象のおかげで、今後もThe Insight Partnersとの連携を心待ちにしております。
チジオケ博士 オニア マネージングディレクター, パインクレストヘルスケア株式会社購入理由
- 情報に基づいた意思決定
- 市場動向の理解
- 競合分析
- 顧客インサイト
- 市場予測
- リスク軽減
- 戦略計画
- 投資の正当性
- 新興市場の特定
- マーケティング戦略の強化
- 業務効率の向上
- 規制動向への対応


