
Präsentations-Switcher-Marktwachstum, Größe, Anteil, Trends, Analyse der wichtigsten Akteure und Prognose bis 2027
Markt für Präsentationsumschalter bis 2027 – Globale Analyse und Prognosen nach Stromverbrauch (<100 Watt, 100 – 500 Watt, >500 Watt); Anwendung (Schulungszentren, Veranstaltungen, Auditorien, Stadien und Arenen, Museen und Planetarien, Sonstiges)
- Status : Veröffentlicht
- Berichtscode : TIPRE00005588
- Kategorie : Elektronik und Halbleiter
- Anzahl der Seiten : 141
- Verfügbare Berichtsformate :


- Datum der letzten Aktualisierung : June 17, 2024

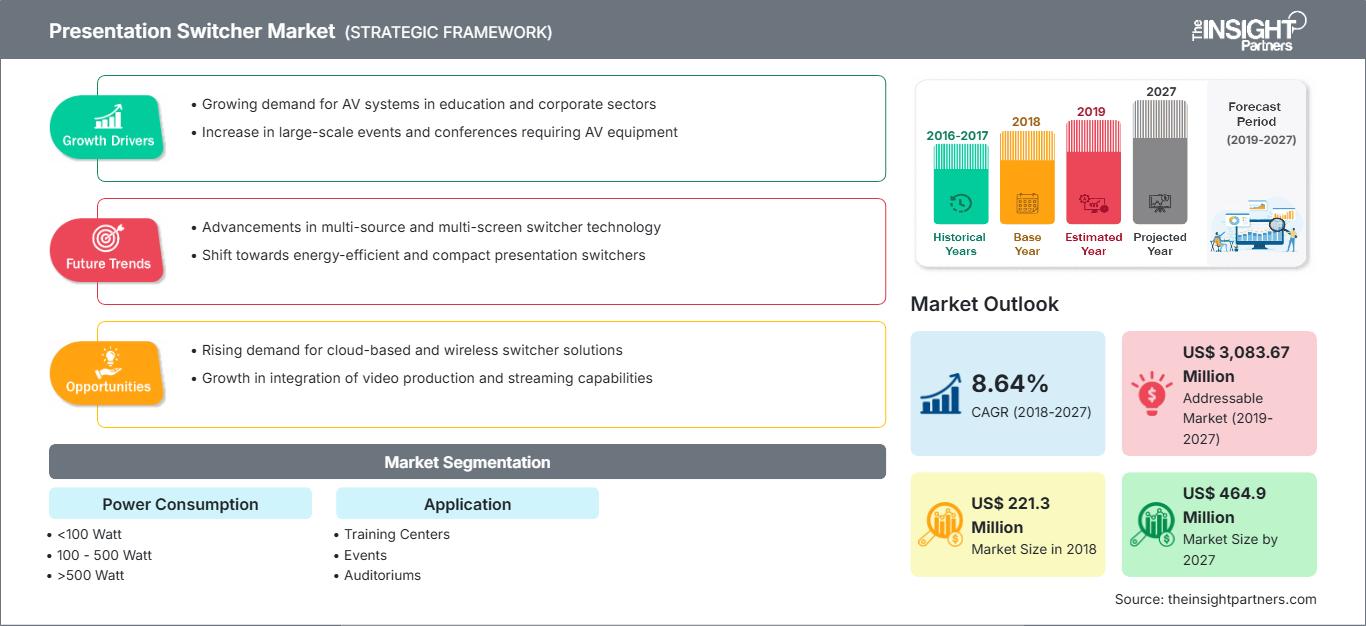
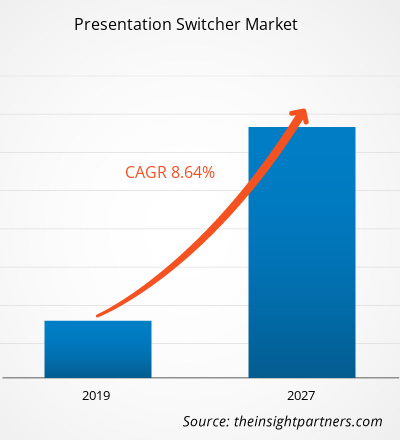
Der Markt für Präsentations-Switcher belief sich 2018 auf 221,3 Millionen US-Dollar. Im Prognosezeitraum wird ein jährliches Wachstum von 8,64 % auf 464,9 Millionen US-Dollar bis 2027 erwartet.
Der asiatisch-pazifische Raum trägt den größten Anteil zu diesem Markt bei, gefolgt von Europa und Nordamerika. Der asiatisch-pazifische Raum ist führend im Markt für Präsentations-Switcher. Aufgrund der wachsenden Veranstaltungsbranche in der Region suchen Vermarkter nach geeigneter Ausrüstung für ihre Veranstaltungsprogramme. Angesichts der steigenden Investitionen in Trainingszentren, Veranstaltungen, Stadien und Arenen sowie der Entwicklung von Technologie und Daten konzentrieren sich Unternehmen heutzutage stark auf die Einführung von Präsentations-Switchern, um fortschrittliche Audio- und Videoeffekte zu erzielen. Darüber hinaus wird erwartet, dass die Region Asien-Pazifik aufgrund der wachsenden Wirtschaft und der zunehmenden Digitalisierungsinitiativen in der Region einen erheblichen Umsatzanteil am Gesamtmarkt erwirtschaftet.
Passen Sie diesen Bericht Ihren Anforderungen an
Sie erhalten kostenlos Anpassungen an jedem Bericht, einschließlich Teilen dieses Berichts oder einer Analyse auf Länderebene, eines Excel-Datenpakets sowie tolle Angebote und Rabatte für Start-ups und Universitäten.
Markt für Präsentationsumschalter: Strategische Einblicke
-
Holen Sie sich die wichtigsten Markttrends aus diesem Bericht.Dieses KOSTENLOSE Beispiel umfasst Datenanalysen, die von Markttrends bis hin zu Schätzungen und Prognosen reichen.
Die Zahl der Stadien steigt weltweit, da die Sportbranche hinsichtlich der Anzahl von Veranstaltungen an Bedeutung gewinnt. Die steigende Zahl von Stadien und Arenen weltweit fördert den Markt für Präsentations-Switcher, da alle Stadien und Arenen nach effizienten Übertragungstechnologien suchen. Präsentations-Switcher bieten mehrere Ein- und Ausgänge über ein einziges Gerät. Bei der Live-Übertragung von Sportereignissen werden Signale über große Entfernungen übertragen, um weit entfernten Zuschauern einen einfachen Zugang zu ermöglichen, und Präsentations-Switcher spielen in herkömmlichen Übertragungstechnologien eine wichtige Rolle. Daher stärkt die weltweite Zunahme der Zahl von Stadien und Arenen den Markt für Präsentations-Switcher.
Das steigende Bewusstsein für Präsentations-Switcher in Entwicklungsländern bietet dem Markt für Präsentations-Switcher lukrative Chancen.
Der Markt für Präsentations-Switcher ist in den Industrieländern Nordamerikas, Europas und im asiatisch-pazifischen Raum ausgereift. Allerdings werden sich auch mehrere Entwicklungsländer im Asien-Pazifik-Raum, im Nahen Osten, in Afrika und Südamerika der Präsentations-Umschalter-Technologie zunehmend bewusst. Für die Akteure auf dem Präsentations-Umschalter-Markt ist dies eine wichtige Chance, ihre globale Präsenz auszuweiten und ihre Jahresumsätze von Jahr zu Jahr zu steigern.
Einblicke in den Stromverbrauch
Der globale Markt für Präsentations-Umschalter wird nach Stromverbrauch in <100 Watt, 100–500 Watt und >500 Watt unterteilt. Das Segment <100 Watt wird 2018 voraussichtlich den Markt für Präsentations-Umschalter dominieren, während der Bereich 101–500 Watt die höchste durchschnittliche jährliche Wachstumsrate aufweist. Die Nachfrage nach Präsentations-Umschaltern mit einem Stromverbrauch von 100–500 Watt wird in den kommenden Jahren voraussichtlich stark ansteigen, da der Bedarf an Präsentations-Umschaltern in Stadien und Arenen steigt. Mehrere Länder investieren beträchtliche Summen in den Ausbau von Sportstadien, was voraussichtlich die Nachfrage nach 100–500-Watt-Präsentationsumschaltern ankurbeln wird.
Anwendungseinblicke
Der globale Markt für Präsentationsumschalter ist nach Anwendung segmentiert in Trainingszentren, Veranstaltungen, Auditorien, Stadien und Arenen, Museen und Planetarien und andere. Das Segment Trainingszentren wird den Markt für Präsentationsumschalter während des gesamten Prognosezeitraums voraussichtlich dominieren. Die Zentren mit Schulungsräumen umfassen Videorekorder (d. h. Videokassettenrekorder), herkömmliche VGA-basierte (d. h. auf Videografik-Arrays basierende) PCs, HDMI-ausgestattete (d. h. mit hochauflösender Multimedia-Schnittstelle ausgestattete) PCs, iPads und interaktive Tafeln, die zu einem niedrigen Preis integriert werden müssen. Darüber hinaus werden Konferenzräume so gebaut, dass sie einer großen Vielfalt an Vortragenden weltweit gerecht werden.
Es wird erwartet, dass auch die zunehmenden Forschungs- und Entwicklungsaktivitäten der Anbieter von Präsentations-Umschaltern zur Einführung zukünftiger Technologien in den kommenden Jahren zum globalen Markt für Präsentations-Umschalter beitragen werden. Einige der jüngsten Entwicklungen sind unten aufgeführt:
2019: Atlona begann mit der Auslieferung eines 6×2-Matrix-Präsentations-Umschalters als Teil der neuen, strategischen Angebote seiner schnell wachsenden Omega-Serie.2018: Analog Way gab seine neue Vertriebsvereinbarung mit der LANG BARANDAY AG für die Schweiz bekannt.2017: Presentation Switchers Inc. brachte PS105 auf den Markt, den ersten seiner AV+IoT-Serie kompakter digitaler Präsentations-Umschalter für die Zusammenarbeit und kleine Konferenzräume.
Präsentations-Umschalter
Regionale Einblicke in den Präsentations-Switcher-MarktDie Analysten von The Insight Partners haben die regionalen Trends und Faktoren, die den Markt für Präsentations-Switcher im Prognosezeitraum beeinflussen, ausführlich erläutert. In diesem Abschnitt werden auch die Marktsegmente und die geografische Lage in Nordamerika, Europa, dem asiatisch-pazifischen Raum, dem Nahen Osten und Afrika sowie Süd- und Mittelamerika erörtert.
Umfang des Marktberichts zu Präsentations-Switchern
| Berichtsattribut | Einzelheiten |
|---|---|
| Marktgröße in 2018 | US$ 221.3 Million |
| Marktgröße nach 2027 | US$ 464.9 Million |
| Globale CAGR (2018 - 2027) | 8.64% |
| Historische Daten | 2016-2017 |
| Prognosezeitraum | 2019-2027 |
| Abgedeckte Segmente |
By Leistungsaufnahme
|
| Abgedeckte Regionen und Länder |
Nordamerika
|
| Marktführer und wichtige Unternehmensprofile |
|
Dichte der Marktteilnehmer für Präsentations-Switcher: Verständnis ihrer Auswirkungen auf die Geschäftsdynamik
Der Markt für Präsentationsumschalter wächst rasant. Dies wird durch die steigende Nachfrage der Endnutzer aufgrund veränderter Verbraucherpräferenzen, technologischer Fortschritte und eines stärkeren Bewusstseins für die Produktvorteile vorangetrieben. Mit der steigenden Nachfrage erweitern Unternehmen ihr Angebot, entwickeln Innovationen, um den Bedürfnissen der Verbraucher gerecht zu werden, und nutzen neue Trends, was das Marktwachstum weiter ankurbelt.
- Holen Sie sich die Markt für Präsentationsumschalter Übersicht der wichtigsten Akteure
GLOBAL PRESENTATION SWITCHER – MARKTSEGMENTIERUNG
Nach Stromverbrauch
- <100 Watt
- 100 – 500 Watt
- >500 Watt
Nach Anwendung
- Schulungszentrum
- Veranstaltungen
- Auditorien
- Stadien & Arenen
- Museen & Planetarien
- Sonstige
Nach Geografie
-
Nordamerika
- USA
- Kanada
- Mexiko
-
Europa
- Frankreich
- Deutschland
- Großbritannien
- Italien
- Russland
- Restliches Europa
-
Asien-Pazifik (APAC)
- Australien
- China
- Indien
- Japan
- Südkorea
- Restliches APAC
-
Naher Osten und Afrika (MEA)
- Saudi-Arabien
- Südafrika
- VAE
- Rest von MEA
-
Südamerika (SAM)
- Brasilien
- Rest von SAM
Firmenprofile
- Atlona Inc. (Panduit)
- Analog Way SAS
- Barco NV
- Crestron Electronics, Inc.
- Christie Digital Systems, Inc.
- CYP (UK) Ltd.
- FSR, Inc.
- Harman International Industries
- LogicAV
- Presentation Switchers, Inc.
Weitere Marktteilnehmer aus der Wertschöpfungskette:
Kramer Electronics Ltd., Extron, ATEN, DVIGear, Inc. und Black Box Corporation sind einige weitere Marktteilnehmer aus der Wertschöpfungskette, die im Bericht nicht porträtiert werden, aber auf Anfrage aufgenommen werden können.

Naveen ist ein erfahrener Marktforschungs- und Beratungsexperte mit über 9 Jahren Erfahrung in kundenspezifischen, syndizierten und Beratungsprojekten. In seiner aktuellen Funktion als Associate Vice President hat er erfolgreich Stakeholder entlang der gesamten Projektwertschöpfungskette gemanagt und ist Autor von über 100 Forschungsberichten und über 30 Beratungsaufträgen. Seine Arbeit erstreckt sich auf Industrie- und Regierungsprojekte und trägt maßgeblich zum Kundenerfolg und zur datengesteuerten Entscheidungsfindung bei.
Naveen hat einen Ingenieursabschluss in Elektronik und Kommunikation von der VTU, Karnataka, und einen MBA in Marketing und Operations von der Manipal University. Er ist seit 9 Jahren aktives IEEE-Mitglied und nimmt an Konferenzen und technischen Symposien teil und engagiert sich ehrenamtlich auf Sektions- und regionaler Ebene. Vor seiner aktuellen Position arbeitete er als Associate Strategic Consultant bei IndustryARC und als Industrial Server Consultant bei Hewlett Packard (HP Global).
- Umfassende Analyse der Marktgröße und Prognosen
- Detaillierte Segmentierungsanalyse
- Tiefgehende Bewertung der Marktdynamik
- Einblicke auf regionaler und nationaler Ebene
- Wettbewerbslandschaft und Unternehmens-Benchmarking
- Strategische Business Intelligence
Erfahrungsberichte
Der SCADA-Systemmarktbericht von Insight Partners ist umfassend und bietet wertvolle Einblicke in aktuelle Trends und Zukunftsprognosen. Das Team war durchweg hochprofessionell, reaktionsschnell und hilfsbereit. Wir sind sehr zufrieden und können die Dienstleistungen wärmstens empfehlen.
RAN KEDEM Partner, Reali Technologies LTDsIch habe einen Bericht über einen sehr spezifischen Softwaremarkt angefordert, und das Team hat ihn innerhalb weniger Tage erstellt. Die Informationen waren sehr relevant und gut präsentiert. Anschließend habe ich einige Änderungen und Ergänzungen zum Bericht angefordert. Das Team reagierte erneut sehr schnell, und ich erhielt den Abschlussbericht in weniger als einer Woche.
JEAN-HERVE JENN Vorsitzende, Future AnalyticaWir haben mit The Insight Partners für eine wichtige Marktstudie und Prognose zusammengearbeitet. Sie gaben uns klare Einblicke in Chancen und Risiken, die uns bei der Gestaltung unserer Pläne halfen. Ihre Recherchen waren benutzerfreundlich und basierten auf soliden Daten. Sie halfen uns, kluge und sichere Entscheidungen zu treffen. Wir können sie wärmstens empfehlen.
PIYUSH NAGPAL Sr. Vizepräsident, Fernlicht GlobalDie Insight Partners lieferten aufschlussreiche, gut strukturierte Marktforschung mit fundierter Fachkompetenz. Ihr Team war durchweg professionell und reaktionsschnell. Die benutzerfreundliche Website ermöglichte den Zugriff auf Branchenberichte. Wir empfehlen sie wärmstens für zuverlässige und hochwertige Forschungsdienstleistungen.
YUKIHIKO ADACHI Geschäftsführer, Deep Blue, LLC.Dies ist das erste Mal, dass ich einen Marktbericht von The Insight Partners erworben habe. Obwohl ich zunächst unsicher war, besuchte ich die Website und fühlte mich dann sicherer, das Risiko einzugehen und einen Marktbericht zu kaufen. Ich bin mit der Qualität des Berichts und dem Kundenservice rundum zufrieden. Ich hatte einige Fragen und Anmerkungen zum ersten Bericht, aber nach einigen E-Mail-Gesprächen mit dem Analysten bin ich überzeugt, dass ich einen Bericht habe, den ich als Input für unseren strategischen Planungsprozess verwenden kann. Vielen Dank, dass Sie sich die Zeit genommen und dies zu einer positiven Erfahrung gemacht haben. Ich werde Ihren Service auf jeden Fall weiterempfehlen und Sie werden meine erste Anlaufstelle sein, wenn wir weitere Marktdaten benötigen.
JOHN SUZUKI Präsident und Chief Executive Officer, Vorstandsmitglied, BK TechnologiesIch möchte mich für Ihre Unterstützung und die Professionalität bedanken, die Sie bei der Bearbeitung meiner Informationsanfrage zum IVD-Markt für Infektionskrankheiten in Nigeria gezeigt haben. Ich schätze Ihre Geduld, Ihre Beratung und die Tatsache, dass Sie bereit waren, einen Rabatt anzubieten, der uns schließlich den Abschluss eines Geschäfts ermöglichte. Ich freue mich darauf, The Insight Partners in Zukunft wieder zu beauftragen, dank des Eindrucks, den Sie bei dieser ersten Begegnung bei mir hinterlassen haben.
DR. CHIJIOKE ONYIA GESCHÄFTSFÜHRERIN, PineCrest Healthcare Ltd.Grund zum Kauf
- Fundierte Entscheidungsfindung
- Marktdynamik verstehen
- Wettbewerbsanalyse
- Kundeneinblicke
- Marktprognosen
- Risikominimierung
- Strategische Planung
- Investitionsbegründung
- Identifizierung neuer Märkte
- Verbesserung von Marketingstrategien
- Steigerung der Betriebseffizienz
- Anpassung an regulatorische Trends


