
Presentation Switcher Market Developments and Forecast by 2027
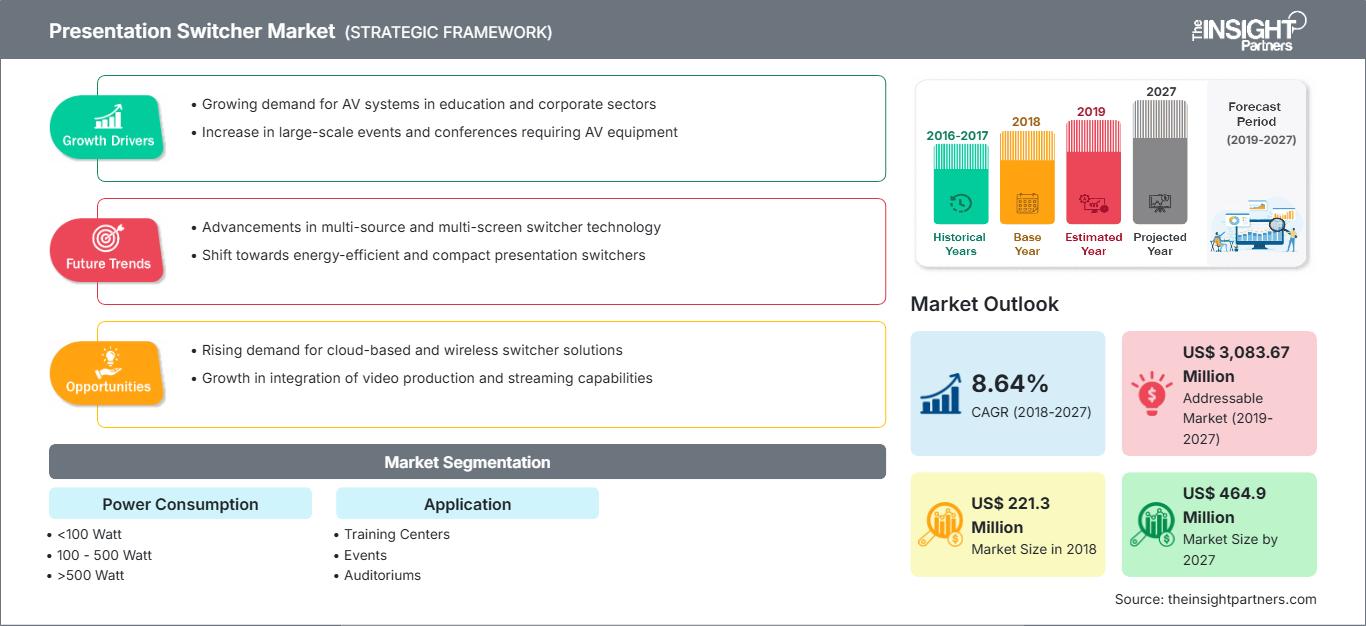
Presentation Switcher Market to 2027 - Industry Analysis and Forecasts by Power Consumption (<100 Watt, 100 - 500 Watt, >500 Watt); Application (Training Centers, Events, Auditoriums, Stadium and Arenas, Museums and Planetariums, Others)
Historic Data: 2016-2017 | Base Year: 2018 | Forecast Period: 2019-2027- Status : Published
- Report Code : TIPRE00005588
- Category : Electronics and Semiconductor
- No. of Pages : 141
- Available Report Formats :


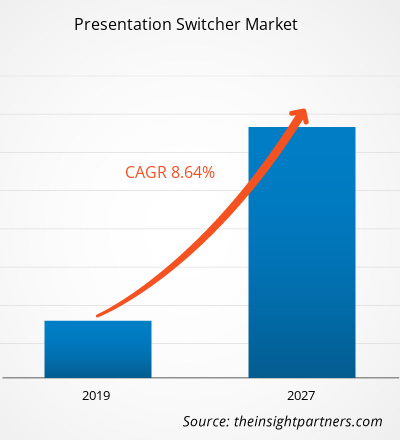
The presentation switcher market accounted at US$ 221.3 Mn in 2018; it is expected to grow at a CAGR of 8.64% during the forecast period, to reach US$ 464.9 Mn by 2027.
The Asia Pacific is contributing the highest share of this market, followed by Europe and then North America. Asia Pacific leads the presentation switcher market, owing to the growing events industry in the APAC region, marketers are looking for appropriate equipment for their event programs. Nowadays, with the increasing investment in the training center, events and stadiums and arenas, and the development of technology and data, businesses are highly focused on adopting a presentation switcher to deliver advanced audio and video effects. Also, APAC is estimated to gain a significant share of revenue in the total market as a result of a growing economy and rising digitalization initiatives in the region.
Customize This Report To Suit Your Requirement
Get FREE CUSTOMIZATIONPresentation Switcher Market: Strategic Insights
-
Get Top Key Market Trends of this report.This FREE sample will include data analysis, ranging from market trends to estimates and forecasts.
Market Insights
The increasing number of stadiums and arenas globally are bolstering the demand for presentation switcher market
The number of stadiums is increasing globally as the sports industry is accentuating in terms of the number of events. The rising number of stadiums and arenas across the world is promoting the presentation switcher market as every stadium and arenas are seeking efficient broadcasting technologies. Presentation switchers offer multiple inputs and outputs through a single device. Live broadcasting of sports events involves the long-range transmission of signals for easy access to distant viewers, and presentation switchers play an important role in conventional broadcasting technologies. Thus, the worldwide increase in the number of stadiums and arenas is bolstering the presentation switcher market.
Rising awareness related to presentation switcher in developing countries offer the prosperous opportunity to the presentation switcher market
The presentation switcher market has matured in the developed countries of North America, Europe, and Asia-Pacific. However, several developing countries in the Asia-Pacific, Middle East, Africa, and South America are gaining awareness related to the presentation switcher technology. This factor is a key opportunity for the presentation switcher market players to expand their global footprints and enhance their annual revenues year over year.
Power Consumption Insights
The global presentation switcher market by power consumption is categorized into <100 Watt, 100–500 watts, and >500 watts. The <100 Watt segment is estimated to dominate the presentation switchers market in 2018, whereas the 101-500 Watt deployment is growing at the highest CAGR. The demand for presentation switchers with power consumption of 100 – 500 Watt is expected to soar in the coming years owing to the rising need for presentation switchers in stadiums and arenas. Several countries are investing substantial amounts in the expansion of sports stadiums, which is foreseen to catalyze the demand for 100 – 500 Watt presentation switchers.
Application Insights
The global presentation switcher market by application is segmented into training centers, events, auditoriums, stadium and arenas, museums and planetariums, and others. The training center segment is projected to dominate the presentation switcher market throughout the forecast period. The centers involving classrooms training include VCRs (i.e., video cassette recorders), legacy VGA-based (i.e., based on video graphics array) PCs, HDMI-equipped (i.e., equipped with high-definition multimedia interface) PCs, iPads, and interactive boards, which need to be integrated at a low price. Additionally, conference rooms are built to cater to an extensive variety of presenters around the globe.
Growth in the research and development activities by the vendors of presentation switchers for the introduction of future technologies is also expected to contribute to the global presentation switcher market in the coming years. Few of the recent developments are listed below:
2019:Atlona started shipping 6×2 matrix presentation switcher as a part of the new, strategic offerings in its rapidly-growing Omega Series.
2018:Analog Way announced their new distribution agreement with LANG BARANDAY AG for Switzerland.
2017:Presentation Switchers Inc. released PS105, the first in its AV+IoT series of compact digital presentation switchers targeting collaboration and small conference room spaces.
Presentation Switcher Market Report Scope
| Report Attribute | Details |
|---|---|
| Market size in 2018 | US$ 221.3 Million |
| Market Size by 2027 | US$ 464.9 Million |
| Global CAGR (2018 - 2027) | 8.64% |
| Historical Data | 2016-2017 |
| Forecast period | 2019-2027 |
| Segments Covered |
By Power Consumption
|
| Regions and Countries Covered |
North America
|
| Market leaders and key company profiles |
|
Presentation Switcher Market Players Density: Understanding Its Impact on Business Dynamics
The Presentation Switcher Market is growing rapidly, driven by increasing end-user demand due to factors such as evolving consumer preferences, technological advancements, and greater awareness of the product's benefits. As demand rises, businesses are expanding their offerings, innovating to meet consumer needs, and capitalizing on emerging trends, which further fuels market growth.
GLOBAL PRESENTATION SWITCHER – MARKET SEGMENTATION
By Power Consumption
- <100 Watt
- 100 – 500 Watt
- >500 Watt
By Application
- Training Center
- Events
- Auditoriums
- Stadiums & Arenas
- Museums & Planetariums
- Others
By Geography
-
North America
- U.S.
- Canada
- Mexico
-
Europe
- France
- Germany
- UK
- Italy
- Russia
- Rest of Europe
-
Asia Pacific (APAC)
- Australia
- China
- India
- Japan
- South Korea
- Rest of APAC
-
Middle East & Africa (MEA)
- Saudi Arabia
- South Africa
- UAE
- Rest of MEA
-
South America (SAM)
- Brazil
- Rest of SAM
Company Profiles
- Atlona Inc. (Panduit)
- Analog Way SAS
- Barco NV
- Crestron Electronics, Inc.
- Christie Digital Systems, Inc.
- CYP (UK) Ltd.
- FSR, Inc.
- Harman International Industries
- LogicAV
- Presentation Switchers, Inc.
Other Market Players from Value Chain:
Kramer Electronics Ltd., Extron, ATEN, DVIGear, Inc., and Black Box Corporation are few other market players from the value chain which are not profiled in the report but the can be included based on request.
Frequently Asked Questions
Continuous rise in the number of auditoriums and training centers in different countries in Asia-Pacific has positively impacted on the growth of the presentation switcher market, and increase in live events, and construction or up-gradation of stadiums across the region is expected to create lucrative business opportunities for presentation switcher market players.

- Historical Analysis (2 Years), Base Year, Forecast (7 Years) with CAGR
- PEST and SWOT Analysis
- Market Size Value / Volume - Global, Regional, Country
- Industry and Competitive Landscape
- Excel Dataset
Recent Reports
Testimonials
The Insight Partners' SCADA System Market report is comprehensive, with valuable insights on current trends and future forecasts. The team was highly professional, responsive, and supportive throughout. We are very satisfied and highly recommend their services.
RAN KEDEM Partner, Reali Technologies LTDsI requested a report on a very specific software market and the team produced the report in a few days. The information was very relevant and well presented. I then requested some changes and additions to the report. The team was again very responsive and I got the final report in less than a week.
JEAN-HERVE JENN Chairman, Future AnalyticaWe worked with The Insight Partners for an important market study and forecast. They gave us clear insights into opportunities and risks, which helped shape our plans. Their research was easy to use and based on solid data. It helped us make smart, confident decisions. We highly recommend them.
PIYUSH NAGPAL Sr. Vice President, High Beam GlobalThe Insight Partners delivered insightful, well-structured market research with strong domain expertise. Their team was professional and responsive throughout. The user-friendly website made accessing industry reports seamless. We highly recommend them for reliable, high-quality research services
YUKIHIKO ADACHI CEO, Deep Blue, LLC.This is the first time I have purchased a market report from The Insight Partners.While I was unsure at first, I visited their web site and felt more comfortable to take the risk and purchase a market report.I am completely satisfied with the quality of the report and customer service. I had several questions and comments with the initial report, but after a couple of dialogs over email with their analyst I believe I have a report that I can use as input to our strategic planning process.Thank you so much for taking the extra time and making this a positive experience.I will definitely recommend your service to others and you will be my first call when we need further market data.
JOHN SUZUKI President and Chief Executive Officer, Board Director, BK TechnologiesI wish to appreciate your support and the professionalism you displayed in the course of attending to my request for information regarding to infectious disease IVD market in Nigeria. I appreciate your patience, your guidance, and the fact that you were willing to offer a discount, which eventually made it possible for us to close a deal. I look forward to engaging The Insight Partners in the future, all thanks to the impression you have created in me as a result of this first encounter.
DR CHIJIOKE ONYIA MANAGING DIRECTOR, PineCrest Healthcare Ltd.Reason to Buy
- Informed Decision-Making
- Understanding Market Dynamics
- Competitive Analysis
- Identifying Emerging Markets
- Customer Insights
- Market Forecasts
- Risk Mitigation
- Boosting Operational Efficiency
- Strategic Planning
- Investment Justification
- Tracking Industry Innovations
- Aligning with Regulatory Trends
Unlock Exclusive Report Discounts
Enquire Now


 Get Free Sample For