
Rapporto sul mercato Switcher di presentazione 2027 per segmenti, geografia, dinamiche, sviluppi recenti e approfondimenti strategici
Mercato dei commutatori di presentazione fino al 2027 - Analisi e previsioni globali per consumo energetico (<100 Watt, 100 - 500 Watt, >500 Watt); Applicazione (centri di formazione, eventi, auditorium, stadi e arene, musei e planetari, altri)
- Stato : Edito
- Codice del report : TIPRE00005588
- Categoria : Elettronica e semiconduttori
- Numero di pagine : 141
- Formati di report disponibili :


- Data dell'ultimo aggiornamento : June 17, 2024

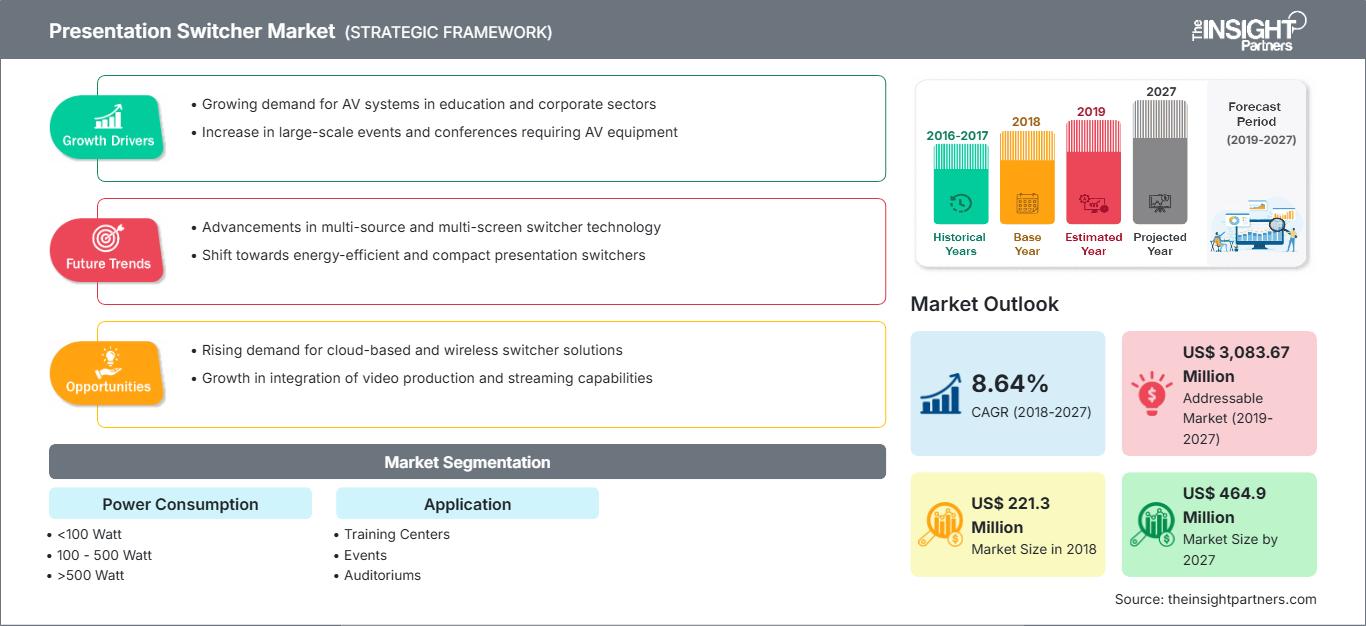
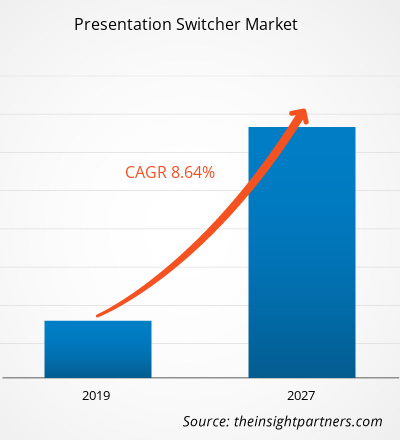
Il mercato dei commutatori di presentazione ha rappresentato 221,3 milioni di dollari nel 2018; si prevede una crescita a un CAGR dell'8,64% durante il periodo di previsione, per raggiungere i 464,9 milioni di dollari entro il 2027.
L'Asia-Pacifico contribuisce con la quota maggiore a questo mercato, seguita dall'Europa e dal Nord America. L'Asia-Pacifico è leader nel mercato dei commutatori di presentazione e, a causa della crescita del settore degli eventi nella regione APAC, gli operatori del marketing sono alla ricerca di attrezzature adeguate per i loro programmi di eventi. Oggigiorno, con i crescenti investimenti in centri di formazione, eventi, stadi e arene, e lo sviluppo di tecnologia e dati, le aziende sono fortemente concentrate sull'adozione di un commutatore di presentazione per offrire effetti audio e video avanzati. Inoltre, si stima che l'APAC acquisirà una quota significativa di fatturato nel mercato totale grazie alla crescita economica e alle crescenti iniziative di digitalizzazione nella regione.
Personalizza questo rapporto in base alle tue esigenze
Potrai personalizzare gratuitamente qualsiasi rapporto, comprese parti di questo rapporto, o analisi a livello di paese, pacchetto dati Excel, oltre a usufruire di grandi offerte e sconti per start-up e università
Mercato dei commutatori di presentazione: Approfondimenti strategici
-
Ottieni le principali tendenze chiave del mercato di questo rapporto.Questo campione GRATUITO includerà l'analisi dei dati, che vanno dalle tendenze di mercato alle stime e alle previsioni.
Il numero di stadi è in aumento a livello globale, poiché l'industria sportiva sta intensificando il numero di eventi. Il crescente numero di stadi e arene in tutto il mondo sta promuovendo il mercato degli switcher di presentazione, poiché ogni stadio e arena è alla ricerca di tecnologie di trasmissione efficienti. Gli switcher di presentazione offrono più ingressi e uscite tramite un unico dispositivo. La trasmissione in diretta di eventi sportivi comporta la trasmissione di segnali a lungo raggio per un facile accesso a spettatori distanti e gli switcher di presentazione svolgono un ruolo importante nelle tecnologie di trasmissione convenzionali. Pertanto, l'aumento mondiale del numero di stadi e arene sta rafforzando il mercato degli switcher di presentazione.
La crescente consapevolezza relativa agli switcher di presentazione nei paesi in via di sviluppo offre prospere opportunità al mercato degli switcher di presentazione
Il mercato degli switcher di presentazione è maturato nei paesi sviluppati di Nord America, Europa e Asia-Pacifico. Tuttavia, diversi paesi in via di sviluppo nell'area Asia-Pacifico, Medio Oriente, Africa e Sud America stanno acquisendo consapevolezza della tecnologia dei commutatori di presentazione. Questo fattore rappresenta un'opportunità chiave per gli operatori del mercato dei commutatori di presentazione per espandere la propria presenza globale e aumentare i propri ricavi annuali anno dopo anno.
Approfondimenti sul consumo energetico
Il mercato globale dei commutatori di presentazione in base al consumo energetico è suddiviso in <100 Watt, 100-500 Watt e >500 Watt. Si stima che il segmento <100 Watt dominerà il mercato dei commutatori di presentazione nel 2018, mentre la distribuzione da 101 a 500 Watt sta crescendo al CAGR più elevato. Si prevede che la domanda di commutatori di presentazione con consumo energetico da 100 a 500 Watt aumenterà vertiginosamente nei prossimi anni a causa della crescente necessità di commutatori di presentazione in stadi e arene. Diversi paesi stanno investendo ingenti somme nell'ampliamento degli stadi sportivi, il che dovrebbe catalizzare la domanda di switcher di presentazione da 100 a 500 Watt.
Approfondimenti sulle applicazioni
Il mercato globale degli switcher di presentazione, per applicazione, è segmentato in centri di formazione, eventi, auditorium, stadi e arene, musei e planetari e altri. Si prevede che il segmento dei centri di formazione dominerà il mercato degli switcher di presentazione per tutto il periodo di previsione. I centri che ospitano corsi di formazione in aula includono videoregistratori (ovvero videoregistratori), PC legacy basati su VGA (ovvero basati su array grafici video), PC dotati di HDMI (ovvero dotati di interfaccia multimediale ad alta definizione), iPad e lavagne interattive, che devono essere integrati a un prezzo contenuto. Inoltre, le sale conferenze sono costruite per soddisfare un'ampia varietà di relatori in tutto il mondo.
Si prevede che anche la crescita delle attività di ricerca e sviluppo da parte dei fornitori di commutatori di presentazione per l'introduzione di tecnologie future contribuirà allo sviluppo del mercato globale dei commutatori di presentazione nei prossimi anni. Di seguito sono elencati alcuni degli sviluppi recenti:
2019: Atlona ha iniziato a distribuire il commutatore di presentazione a matrice 6x2 come parte delle nuove offerte strategiche della sua serie Omega in rapida crescita. 2018: Analog Way ha annunciato il suo nuovo accordo di distribuzione con LANG BARANDAY AG per la Svizzera. 2017: Presentation Switchers Inc. ha lanciato PS105, il primo della sua serie AV+IoT di commutatori di presentazione digitali compatti, pensato per la collaborazione e le piccole sale conferenze.
Approfondimenti regionali sul mercato di Presentation Switcher
Le tendenze regionali e i fattori che influenzano il mercato dei Presentation Switcher durante il periodo di previsione sono stati ampiamente spiegati dagli analisti di The Insight Partners. Questa sezione illustra anche i segmenti e la geografia del mercato dei Presentation Switcher in Nord America, Europa, Asia-Pacifico, Medio Oriente e Africa, America Meridionale e Centrale.
Ambito del rapporto di mercato di Presentation Switcher
| Attributo del rapporto | Dettagli |
|---|---|
| Dimensioni del mercato in 2018 | US$ 221.3 Million |
| Dimensioni del mercato per 2027 | US$ 464.9 Million |
| CAGR globale (2018 - 2027) | 8.64% |
| Dati storici | 2016-2017 |
| Periodo di previsione | 2019-2027 |
| Segmenti coperti |
By Consumo energetico
|
| Regioni e paesi coperti |
Nord America
|
| Leader di mercato e profili aziendali chiave |
|
Presentazione Switcher Densità degli attori del mercato: comprendere il suo impatto sulle dinamiche aziendali
Il mercato dei commutatori di presentazione è in rapida crescita, trainato dalla crescente domanda degli utenti finali, dovuta a fattori quali l'evoluzione delle preferenze dei consumatori, i progressi tecnologici e una maggiore consapevolezza dei vantaggi del prodotto. Con l'aumento della domanda, le aziende stanno ampliando la propria offerta, innovando per soddisfare le esigenze dei consumatori e sfruttando le tendenze emergenti, alimentando ulteriormente la crescita del mercato.
- Ottieni il Mercato dei commutatori di presentazione Panoramica dei principali attori chiave
CAMBIO PRESENTAZIONE GLOBALE: – SEGMENTAZIONE DEL MERCATO
Per consumo energetico
- <100 Watt
- 100 - 500 Watt
- >500 Watt
Per applicazione
- Centro di formazione
- Eventi
- Auditorium
- Stadi e amp; Arene
- Musei e musei Planetari
- Altri
Per area geografica
-
Nord America
- Stati Uniti
- Canada
- Messico
-
Europa
- Francia
- Germania
- Regno Unito
- Italia
- Russia
- Resto d'Europa
-
Asia Pacifico (APAC)
- Australia
- Cina
- India
- Giappone
- Corea del Sud
- Resto dell'APAC
-
Medio Oriente e Africa (MEA)
- Arabia Saudita
- Sudafrica
- Emirati Arabi Uniti
- Resto del MEA
-
Sud America (SAM)
- Brasile
- Resto del SAM
Profili aziendali
- Atlona Inc. (Panduit)
- Analog Way SAS
- Barco NV
- Crestron Electronics, Inc.
- Christie Digital Systems, Inc.
- CYP (UK) Ltd.
- FSR, Inc.
- Harman International Industries
- LogicAV
- Presentation Switchers, Inc.
Altri attori del mercato della catena del valore:
Kramer Electronics Ltd., Extron, ATEN, DVIGear, Inc. e Black Box Corporation sono alcuni degli altri attori del mercato della catena del valore che non sono descritti nel rapporto, ma che possono essere inclusi su richiesta.

Naveen è un professionista esperto in ricerche di mercato e consulenza con oltre 9 anni di esperienza in progetti personalizzati, sindacati e di consulenza. Attualmente Vicepresidente Associato, ha gestito con successo gli stakeholder lungo l'intera catena del valore del progetto e ha redatto oltre 100 report di ricerca e oltre 30 incarichi di consulenza. Il suo lavoro spazia tra progetti industriali e governativi, contribuendo in modo significativo al successo dei clienti e al processo decisionale basato sui dati.
Naveen ha conseguito una laurea in Ingegneria Elettronica e delle Comunicazioni presso la VTU, Karnataka, e un MBA in Marketing e Operations presso la Manipal University. È membro attivo dell'IEEE da 9 anni, partecipando a conferenze, simposi tecnici e svolgendo attività di volontariato sia a livello di sezione che regionale. Prima del suo attuale ruolo, ha lavorato come Consulente Strategico Associato presso IndustryARC e come Consulente Server Industriali presso Hewlett Packard (HP Global).
- Analisi completa delle dimensioni e delle previsioni di mercato
- Analisi dettagliata della segmentazione
- Valutazione approfondita delle dinamiche di mercato
- Approfondimenti a livello regionale e nazionale
- Analisi del panorama competitivo e benchmarking aziendale
- Business intelligence strategica
Testimonianze
Il report di mercato sui sistemi SCADA di Insight Partners è completo, con preziosi spunti sulle tendenze attuali e sulle previsioni future. Il team si è dimostrato altamente professionale, reattivo e disponibile in ogni fase del progetto. Siamo molto soddisfatti e consigliamo vivamente i loro servizi.
RAN KEDEM Partner, Reali Technologies LTDsHo richiesto un report su un mercato software molto specifico e il team lo ha prodotto in pochi giorni. Le informazioni erano molto pertinenti e ben presentate. Ho quindi richiesto alcune modifiche e aggiunte al report. Il team è stato ancora una volta molto reattivo e ho ricevuto il report finale in meno di una settimana.
JEAN-HERVE JENN Presidente, Future AnalyticaAbbiamo collaborato con The Insight Partners per un importante studio di mercato e una previsione. Ci hanno fornito informazioni chiare su opportunità e rischi, che ci hanno aiutato a definire i nostri piani. La loro ricerca è stata facile da usare e basata su dati solidi. Ci ha aiutato a prendere decisioni intelligenti e consapevoli. Li consigliamo vivamente.
PIYUSH NAGPAL Vicepresidente senior, Abbaglianti globaliInsight Partners ha fornito ricerche di mercato approfondite e ben strutturate, con una solida competenza nel settore. Il loro team si è dimostrato professionale e reattivo in ogni fase. Il sito web intuitivo ha reso l'accesso ai report di settore semplice e immediato. Li consigliamo vivamente per servizi di ricerca affidabili e di alta qualità.
YUKIHIKO ADACHI Amministratore delegato, Deep Blue, LLC.Questa è la prima volta che acquisto un report di mercato da The Insight Partners. Sebbene inizialmente fossi indeciso, ho visitato il loro sito web e mi sono sentito più a mio agio nell'acquistare un report di mercato. Sono completamente soddisfatto della qualità del report e del servizio clienti. Avevo diverse domande e commenti sul report iniziale, ma dopo un paio di conversazioni via email con il loro analista credo di avere un report che posso utilizzare come input per il nostro processo di pianificazione strategica. Grazie mille per aver dedicato del tempo extra e aver reso questa esperienza positiva. Consiglierò sicuramente il vostro servizio ad altri e sarete la mia prima persona a cui rivolgermi quando avremo bisogno di ulteriori dati di mercato.
GIOVANNI SUZUKI Presidente e Amministratore Delegato, Consigliere di Amministrazione, Tecnologie BKDesidero esprimere la mia gratitudine per il supporto e la professionalità dimostrati nel rispondere alla mia richiesta di informazioni sul mercato dei dispositivi medici in vitro per malattie infettive in Nigeria. Apprezzo la vostra pazienza, la vostra guida e la vostra disponibilità a offrirmi uno sconto, che alla fine ci ha permesso di concludere l'affare. Non vedo l'ora di collaborare con The Insight Partners in futuro, grazie anche all'impressione che mi avete lasciato dopo questo primo incontro.
Dott. Chijioke AMMINISTRATORE DELEGATO DI ONYIA, PineCrest Healthcare Ltd.Motivo dell'acquisto
- Processo decisionale informato
- Comprensione delle dinamiche di mercato
- Analisi competitiva
- Analisi dei clienti
- Previsioni di mercato
- Mitigazione del rischio
- Pianificazione strategica
- Giustificazione degli investimenti
- Identificazione dei mercati emergenti
- Miglioramento delle strategie di marketing
- Aumento dell'efficienza operativa
- Allineamento alle tendenze normative


