
2027 年演示切换器市场报告(按细分市场、地域、动态、最新发展和战略见解)
演示切换器市场至 2027 年——全球分析与预测,按功耗(<100 瓦、100 - 500 瓦、>500 瓦);应用(培训中心、活动、礼堂、体育场和竞技场、博物馆和天文馆、其他)
- 状态 : 已发布
- 报告代码 : TIPRE00005588
- 类别 : 电子和半导体
- 页数 : 141
- 可用报告格式 :


- 最后更新日期 : June 17, 2024

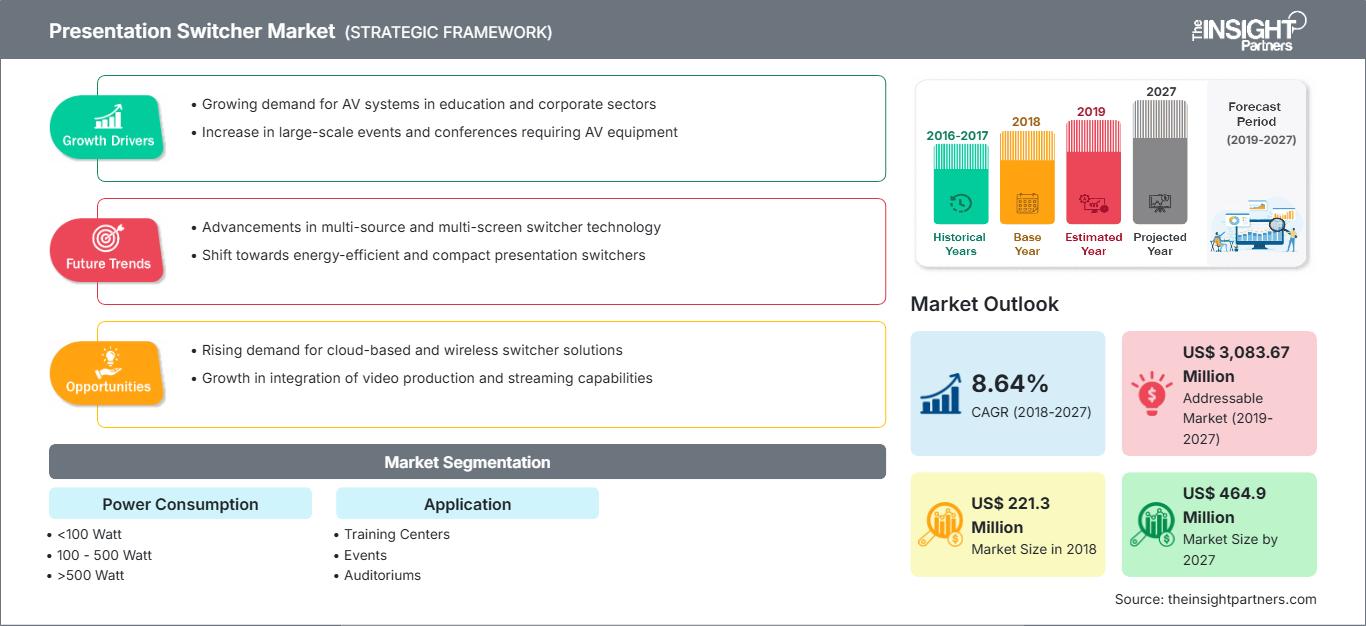
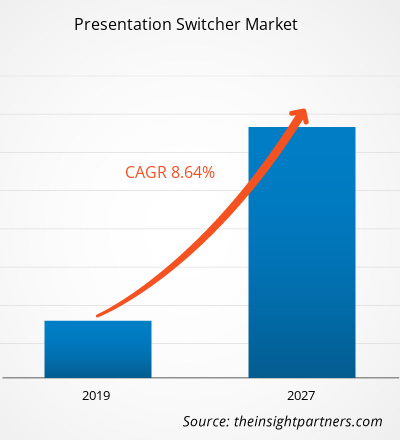
2018 年,演示切换器市场规模为 2.213 亿美元;预计在预测期内,该市场规模将以 8.64% 的复合年增长率增长,到 2027 年将达到 4.649 亿美元。
亚太地区占据了该市场的最大份额,其次是欧洲,然后是北美。亚太地区引领演示切换器市场,这得益于该地区活动行业的蓬勃发展,营销人员正在为其活动项目寻找合适的设备。如今,随着对培训中心、活动、体育场馆的投资不断增加,以及技术和数据的发展,企业高度重视采用演示切换器来提供先进的音频和视频效果。此外,由于亚太地区经济的增长和数字化举措的不断推进,预计该地区将在整个市场中获得相当大的收入份额。
自定义此报告以满足您的要求
您将免费获得任何报告的定制,包括本报告的部分内容,或国家级分析、Excel 数据包,以及为初创企业和大学提供超值优惠和折扣
演示切换器市场: 战略洞察
-
获取本报告的主要市场趋势。这个免费样本将包括数据分析,从市场趋势到估计和预测。
随着体育产业在赛事数量方面的不断增加,全球体育场馆的数量也在不断增加。全球体育场馆数量的不断增加推动了演示切换器市场的发展,因为每个体育场馆都在寻求高效的广播技术。演示切换器通过单个设备提供多个输入和输出。体育赛事的现场直播涉及信号的远距离传输,以便于远距离观众收看,而演示切换器在传统广播技术中发挥着重要作用。因此,全球体育场馆数量的增加正在推动演示切换器市场的发展。
发展中国家对演示切换器认识的不断提高为演示切换器市场提供了繁荣的机会
演示切换器市场在北美、欧洲和亚太地区的发达国家已经成熟。然而,亚太、中东、非洲和南美洲的一些发展中国家正在逐渐提高对演示切换器技术的认识。这对演示切换器市场参与者来说是扩大全球影响力、逐年提高年收入的关键机遇。
功耗洞察
全球演示切换器市场按功耗分为<100瓦、100-500瓦和>500瓦。预计<100瓦市场将在2018年主导演示切换器市场,而101-500瓦的部署正以最高的复合年增长率增长。由于体育场馆对演示切换器的需求不断增长,预计未来几年对功耗为100-500瓦的演示切换器的需求将飙升。一些国家正在大力投资扩建体育场馆,预计这将刺激对 100 至 500 瓦演示切换器的需求。
应用洞察
全球演示切换器市场按应用细分为培训中心、活动、礼堂、体育场馆、博物馆和天文馆等。预计在整个预测期内,培训中心将主导演示切换器市场。涉及教室培训的中心包括 VCR(即录像机)、基于传统 VGA(即基于视频图形阵列)的个人电脑、配备 HDMI(即配备高清多媒体接口)的个人电脑、iPad 和交互式白板,这些都需要以低成本进行集成。此外,会议室的建造是为了满足全球各类演示者的需求。
演示切换器供应商为引入未来技术而加大研发力度,预计也将在未来几年推动全球演示切换器市场的发展。以下列出了一些近期发展:
2019年:Atlona 开始发售 6×2 矩阵演示切换器,作为其快速增长的 Omega 系列全新战略产品的一部分。2018年:Analog Way 宣布与 LANG BARANDAY AG 签署新的瑞士分销协议。2017年:Presentation Switchers Inc. 发布了 PS105,这是其 AV+IoT 系列紧凑型数字演示切换器中的首款产品,主要面向协作和小型会议室空间。
演示切换器市场区域洞察
The Insight Partners 的分析师已详尽阐述了预测期内演示切换器市场的区域趋势和影响因素。本节还讨论了北美、欧洲、亚太地区、中东和非洲以及南美和中美洲的演示切换器市场细分和地域分布。
演示切换器市场报告范围
| 报告属性 | 细节 |
|---|---|
| 市场规模 2018 | US$ 221.3 Million |
| 市场规模 2027 | US$ 464.9 Million |
| 全球复合年增长率 (2018 - 2027) | 8.64% |
| 历史数据 | 2016-2017 |
| 预测期 | 2019-2027 |
| 涵盖的领域 |
By 功耗
|
| 覆盖地区和国家 |
北美
|
| 市场领导者和主要公司简介 |
|
演示切换器市场参与者密度:了解其对业务动态的影响
演示切换器市场正在快速增长,这得益于终端用户需求的不断增长,而这些需求的驱动因素包括消费者偏好的不断变化、技术进步以及对产品优势的认知度不断提高。随着需求的增长,企业正在扩展其产品线,不断创新以满足消费者需求,并抓住新兴趋势,从而进一步推动市场增长。
- 获取 演示切换器市场 主要参与者概述
全局演示切换器 -市场细分
按功耗
- <100瓦
- 100 – 500 瓦
- >500 瓦
按申请
- 培训中心
- 活动
- 礼堂
- 体育场馆和体育馆阿里纳斯
- 博物馆和博物馆天文馆
- 其他
按地理位置
-
北美洲
- 美国
- 加拿大
- 墨西哥
-
欧洲
- 法国
- 德国
- 英国
- 意大利
- 俄罗斯
- 欧洲其他地区
-
亚太地区 (APAC)
- 澳大利亚
- 中国
- 印度
- 日本
- 韩国
- 亚太地区其他地区
-
中东和非洲 (MEA)
- 沙特阿拉伯
- 南非
- 阿联酋
- MEA 其他地区
-
南美洲 (SAM)
- 巴西
- SAM 其他地区
公司简介
- Atlona Inc. (Panduit)
- Analog Way SAS
- Barco NV
- Crestron Electronics, Inc.
- Christie Digital Systems, Inc.
- CYP (UK) Ltd.
- FSR, Inc.
- Harman International Industries
- LogicAV
- Presentation Switchers, Inc.
来自价值链的其他市场参与者:
Kramer Electronics Ltd.、Extron、ATEN、 DVIGear, Inc. 和 Black Box Corporation 是价值链中其他几家市场参与者,报告中没有介绍,但可以根据要求将其包括在内。

Naveen 是一位经验丰富的市场研究和咨询专业人士,在定制项目、联合项目和咨询项目方面拥有超过 9 年的专业经验。他目前担任副总裁,成功管理了项目价值链中的利益相关者,撰写了 100 多份研究报告和 30 多项咨询项目。他的工作涵盖工业和政府项目,为客户的成功和数据驱动的决策做出了重要贡献。
Naveen 拥有卡纳塔克邦 VTU 的电子与通信工程学位,以及马尼帕尔大学的市场营销与运营 MBA 学位。他已担任 IEEE 会员 9 年,积极参与各种会议、技术研讨会,并在分部和地区层面担任志愿者。在此之前,他曾担任 IndustryARC 的助理战略顾问和惠普(惠普全球)的工业服务器顾问。
- 全面的市场规模与预测分析
- 详细的细分市场分析
- 深入的市场动态评估
- 区域及国家级洞察
- 竞争格局与企业对标分析
- 战略性商业情报
客户评价
Insight Partners 的 SCADA 系统市场报告内容全面,对当前趋势和未来预测提供了宝贵的见解。该团队始终高度专业、响应迅速且乐于助人。我们非常满意,强烈推荐他们的服务。
兰·凯德姆 伙伴, Reali Technologies LTD我请求一份关于特定软件市场的报告,团队在几天内就完成了。报告信息非常相关,而且呈现得非常出色。之后,我请求对报告进行一些修改和补充。团队再次迅速响应,不到一周我就收到了最终报告。
让-埃尔韦·詹恩 主席, 未来分析公司我们与 Insight Partners 合作进行了一项重要的市场研究和预测。他们清晰地洞察了机遇和风险,帮助我们制定了计划。他们的研究简单易用,数据可靠,帮助我们做出了明智而自信的决策。我们强烈推荐他们。
皮尤什·纳格帕尔 高级副总裁, 远光全球Insight Partners 凭借其深厚的行业专业知识,提供了富有洞察力、结构合理的市场研究。他们的团队始终专业且响应迅速。用户友好的网站让访问行业报告变得顺畅无阻。我们强烈推荐他们可靠、高质量的研究服务。
安达幸彦 首席执行官, 深蓝有限责任公司这是我第一次从The Insight Partners购买市场报告。起初我有些犹豫,但访问了他们的网站后,我更放心地冒险购买市场报告。我对报告的质量和客户服务非常满意。我对最初的报告有一些疑问和意见,但在与他们的分析师通过电子邮件沟通了几次后,我相信这份报告可以作为我们战略规划流程的参考。非常感谢您抽出宝贵的时间,让这次体验如此愉快。我一定会向其他人推荐你们的服务,当我们需要更多市场数据时,你们将是我的首选。
约翰·铃木 总裁兼首席执行官、董事会董事, BK科技感谢您在处理我关于尼日利亚传染病体外诊断市场信息请求的过程中所展现的支持和专业精神。感谢您的耐心、指导,以及您愿意提供的折扣,最终促成了这笔交易。我期待未来与 Insight Partners 继续合作,这一切都要归功于您与我初次接触后留下的良好印象。
奇吉奥克博士 ONYIA 董事总经理, PineCrest 医疗保健有限公司购买理由
- 明智的决策
- 了解市场动态
- 竞争分析
- 客户洞察
- 市场预测
- 风险规避
- 战略规划
- 投资论证
- 识别新兴市场
- 优化营销策略
- 提升运营效率
- 顺应监管趋势


