Aperçu du marché des logiciels académiques, croissance, tendances, analyse, rapport de recherche (2021-2027)
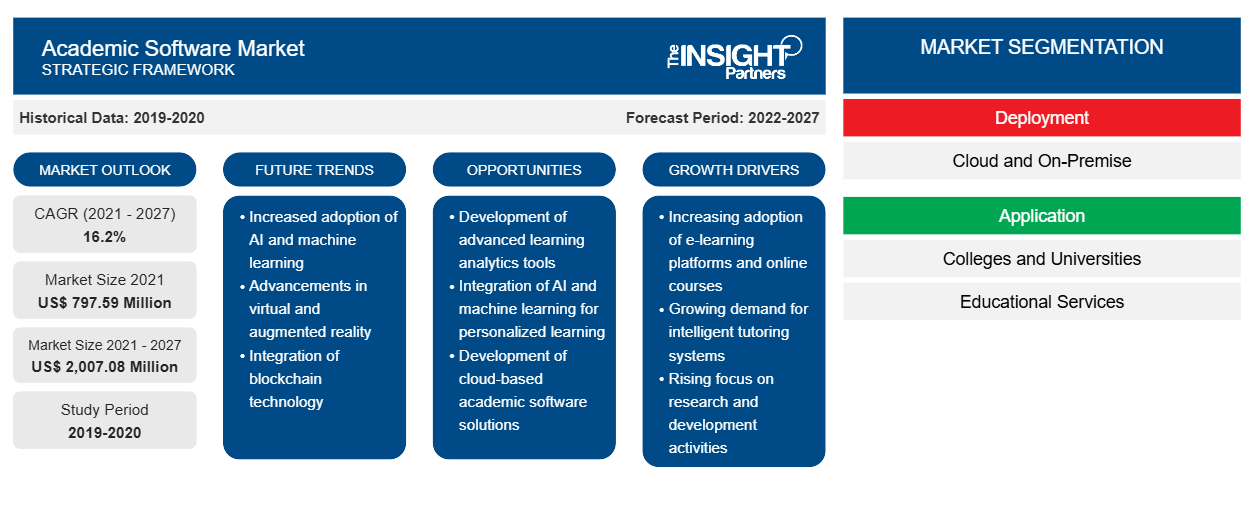
Données historiques : 2019-2020 | Année de référence : 2021 | Période de prévision : 2022-2027Prévisions du marché des logiciels universitaires jusqu'en 2027 - Impact de la COVID-19 et analyse globale par déploiement (cloud et sur site) et application (collèges et universités, services éducatifs et autres)
- Statut : Publié
- Code du rapport : TIPRE00013179
- Catégorie : Technologie, médias et télécommunications
- Nombre de pages : 141
- Formats de rapport disponibles :


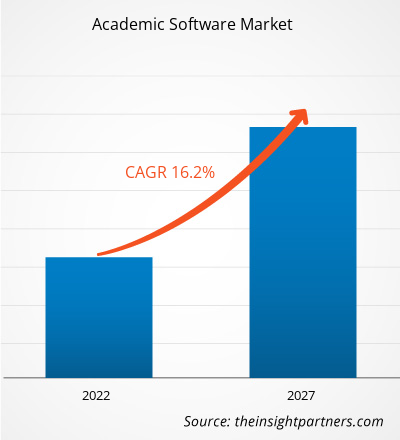
Le marché des logiciels académiques devrait passer de 797,59 millions USD en 2021 à 2 007,08 millions USD en 2027. Le marché des logiciels académiques devrait croître à un TCAC de 16,2 % au cours de la période de prévision de 2021 à 2027.
L’adoption croissante de l’apprentissage en ligne dans les établissements est le facteur clé de la croissance du marché des logiciels universitaires. Dans l’apprentissage en ligne, la lecture ou le visionnage de contenu modifie la manière dont l’enseignement est dispensé. Plusieurs cours d’apprentissage en ligne tels que les animations, les podcasts et les vidéos créent un environnement d’apprentissage multimodal et réaliste. L’apprentissage en ligne, le contenu éducatif, ouvre plusieurs opportunités d’apprentissage immersif pour les apprenants via des ordinateurs, des ordinateurs portables, des tablettes ou des smartphones. Au lieu d’être dans un environnement passif, les étudiants peuvent choisir ce dont ils ont besoin pour apprendre facilement et rapidement. Ces avantages augmentent la demande de logiciels universitaires dans le monde entier.
La pandémie de COVID-19 a gravement affecté le secteur de l'éducation dans le monde entier. Elle a également favorisé l'adoption de systèmes d'éducation en ligne dans toutes les grandes économies du monde, influençant ainsi l'adoption de logiciels pour diverses applications, telles que la diffusion de cours, la gestion des étudiants et d'autres activités opérationnelles à distance. Ainsi, l'adoption croissante de solutions technologiquement avancées dans l'ensemble du secteur devrait avoir un impact positif sur la croissance du marché des logiciels universitaires pendant la pandémie.
En fonction du déploiement, le marché des logiciels universitaires est segmenté en cloud et sur site. En 2019, le segment cloud représentait une part plus élevée du marché. Ces dernières années, l'industrie technologique a régulièrement connu une augmentation majeure de l'adoption de l'informatique basée sur le cloud. Cela est dû au fait que l'informatique basée sur le cloud simplifie le temps de mise en œuvre et réduit considérablement les coûts de déploiement. Cet avantage a attiré un grand nombre d'utilisateurs finaux ; ainsi, la majorité des acteurs du marché des logiciels universitaires fournissent des produits basés sur le cloud en conjonction avec la demande croissante de logiciels basés sur le cloud. En outre, l'infrastructure Internet des pays développés a évolué et prospère dans de nombreux pays en développement, permettant aux utilisateurs finaux d'accéder aux solutions basées sur le cloud dans les pays développés et en développement
Personnalisez ce rapport en fonction de vos besoins
Vous bénéficierez d'une personnalisation gratuite de n'importe quel rapport, y compris de certaines parties de ce rapport, d'une analyse au niveau des pays, d'un pack de données Excel, ainsi que d'offres et de remises exceptionnelles pour les start-ups et les universités.
Marché des logiciels universitaires : perspectives stratégiques
-
Obtenez les principales tendances clés du marché de ce rapport.Cet échantillon GRATUIT comprendra une analyse de données, allant des tendances du marché aux estimations et prévisions.
Informations sur le marché des logiciels universitaires
Intégration de technologies telles que l'intelligence artificielle avec des solutions logicielles académiques
L’intelligence artificielle (IA) est une technologie qui donne aux ordinateurs la capacité, de la même manière que les humains, de communiquer avec les gens, de comprendre les événements, d’apprendre et de réagir à ceux-ci. Au fil des ans, l’intelligence artificielle a non seulement eu d’énormes applications dans de nombreux secteurs, tels que la sécurité, la surveillance et les technologies de l’information, mais elle a également connu une adoption croissante des technologies dans le secteur de l’éducation. L’IA est adoptée dans les écoles, les collèges et les universités pour automatiser les tâches répétitives, telles que la notation, l’analyse financière et les processus d’admission. Par exemple, l’IA peut être calibrée pour apprendre et modéliser les actions des enseignants pendant la notation, grâce à des programmes informatiques avancés, tels que la notation automatique, pour une attribution automatique des notes à l’avenir. Au fil du temps, le programme apprendrait les compétences académiques de plusieurs étudiants et, en fonction de leurs performances, préparerait des plans de formation personnalisés.
Informations sur le marché basées sur le déploiement
En fonction du type de déploiement, le marché mondial des logiciels universitaires est segmenté en cloud et sur site. Les logiciels universitaires basés sur le cloud connaissent une forte demande par rapport aux logiciels universitaires sur site. Le segment du cloud génère la majorité de la demande car il est comparativement moins cher en raison de la solide infrastructure réseau des pays développés. En outre, les fournisseurs de logiciels universitaires basés sur le cloud se concentrent fortement sur le développement d'un correctif de sécurité de haut niveau afin d'éliminer le risque de cyberattaques. Ce facteur crée également une demande importante de la part des utilisateurs finaux, ce qui stimule le marché des logiciels universitaires.
Informations sur le marché basées sur les applications
En fonction des applications, le marché des logiciels universitaires est segmenté en collèges et universités, services éducatifs et autres. L'adoption croissante de solutions modernes dans les établissements d'enseignement et les universités pour offrir des cours en ligne et hors ligne aux étudiants, associée à l'initiative visant à mettre des solutions avancées à la disposition de l'ensemble du personnel et des étudiants, influence l'adoption de logiciels universitaires. Cela alimente la croissance du marché au fil des ans.
Les acteurs opérant sur le marché des logiciels académiques se concentrent sur des stratégies, telles que des initiatives de marché, des acquisitions et des lancements de produits, pour maintenir leurs positions sur le marché des logiciels académiques. Voici quelques développements des principaux acteurs du marché des logiciels académiques :
En décembre 2020, la plateforme de système d'information des étudiants Alma a introduit la fonction de moyenne pondérée cumulative (GPA) qui a été ajoutée à l'outil de carnet de notes. La notation basée sur les normes (SBG) repose sur l'alignement des commentaires des étudiants et de la mesure des progrès par rapport aux compétences particulières enseignées et évaluées, plutôt que sur l'utilisation d'un score unique pour couvrir plusieurs sujets ou normes.
En juillet 2020, ConexED a mis à jour son application iOS 2.2.3 pour une expérience plus conviviale. Cette application permet aux étudiants, au personnel et aux professeurs de participer à des réunions virtuelles et à des vidéoconférences sur leurs appareils mobiles.
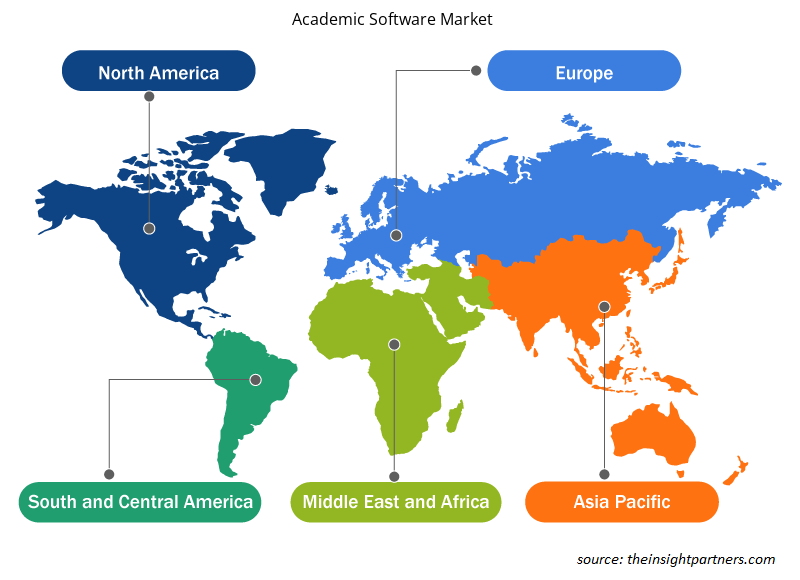
Aperçu régional du marché des logiciels universitaires
Les tendances et facteurs régionaux influençant le marché des logiciels académiques tout au long de la période de prévision ont été expliqués en détail par les analystes d’Insight Partners. Cette section traite également des segments et de la géographie du marché des logiciels académiques en Amérique du Nord, en Europe, en Asie-Pacifique, au Moyen-Orient et en Afrique, ainsi qu’en Amérique du Sud et en Amérique centrale.
- Obtenez les données régionales spécifiques au marché des logiciels académiques
Portée du rapport sur le marché des logiciels universitaires
| Attribut de rapport | Détails |
|---|---|
| Taille du marché en 2021 | 797,59 millions de dollars américains |
| Taille du marché d'ici 2027 | 2 007,08 millions de dollars américains |
| Taux de croissance annuel moyen mondial (2021-2027) | 16,2% |
| Données historiques | 2019-2020 |
| Période de prévision | 2022-2027 |
| Segments couverts |
Par déploiement
|
| Régions et pays couverts |
Amérique du Nord
|
| Leaders du marché et profils d'entreprises clés |
|
Densité des acteurs du marché des logiciels universitaires : comprendre son impact sur la dynamique des entreprises
Le marché des logiciels universitaires connaît une croissance rapide, tirée par la demande croissante des utilisateurs finaux en raison de facteurs tels que l'évolution des préférences des consommateurs, les avancées technologiques et une plus grande sensibilisation aux avantages du produit. À mesure que la demande augmente, les entreprises élargissent leurs offres, innovent pour répondre aux besoins des consommateurs et capitalisent sur les tendances émergentes, ce qui alimente davantage la croissance du marché.
La densité des acteurs du marché fait référence à la répartition des entreprises ou des sociétés opérant sur un marché ou un secteur particulier. Elle indique le nombre de concurrents (acteurs du marché) présents sur un marché donné par rapport à sa taille ou à sa valeur marchande totale.
Les principales entreprises opérant sur le marché des logiciels académiques sont :
- Alma
- LOGICIEL CAMPUS CAFÉ
- ConexED
- Envisio Solutions Inc.
- TISSU COMPLET
Avis de non-responsabilité : les sociétés répertoriées ci-dessus ne sont pas classées dans un ordre particulier.
- Obtenez un aperçu des principaux acteurs du marché des logiciels académiques
Marché des logiciels académiques – par déploiement
- Nuage
- Sur site
Marché des logiciels académiques – par application
- Collèges et universités
- Services éducatifs
- Autres
Marché des logiciels académiques – par géographie
-
Amérique du Nord
- NOUS
- Canada
- Mexique
-
Europe
- France
- Allemagne
- Russie
- ROYAUME-UNI
- Italie
- Reste de l'Europe
-
Asie-Pacifique (APAC)
- Chine
- Inde
- Japon
- Australie
- Corée du Sud
- Reste de l'APAC
-
AEM
- Arabie Saoudite
- Émirats arabes unis
- Afrique du Sud
- Reste de la MEA
-
SAM
- Brésil
- Argentine
- Reste de SAM
Marché des logiciels académiques – Profils d’entreprises
- Alma
- LOGICIEL CAMPUS CAFÉ
- ConexED
- Envisio Solutions Inc.
- TISSU COMPLET
- Logiciel PowerVista, Inc.
- Qualtrics SARL
- Société Tophatmonocle
- TrueDialog
- Ruche Wize

Ankita est une professionnelle dynamique des études de marché et du conseil, forte de plus de 8 ans d'expérience dans les secteurs des technologies, des médias, des TIC, de l'électronique et des semi-conducteurs. Elle a dirigé et réalisé avec succès plus de 100 missions de conseil et d'études pour des clients internationaux tels que Microsoft, Oracle, NEC Corporation, SAP, KPMG et Expeditors International. Ses compétences clés incluent l'analyse de marché, l'analyse de données, la prévision, la formulation de stratégies, la veille concurrentielle et la rédaction de rapports.
Ankita maîtrise parfaitement la gestion de cycles de projet complets, de la conception de propositions avant-vente et des discussions avec les clients jusqu'à la fourniture d'informations exploitables après-vente. Elle maîtrise la gestion d'équipes transverses, la structuration de modules d'études complexes et l'alignement des solutions sur les objectifs commerciaux spécifiques de chaque client. Ses excellentes compétences en communication, leadership et présentation lui ont permis de fournir systématiquement des résultats à forte valeur ajoutée dans des environnements de marché dynamiques et en constante évolution.
- Analyse historique (2 ans), année de base, prévision (7 ans) avec TCAC
- Analyse PEST et SWOT
- Taille du marché Valeur / Volume - Mondial, Régional, Pays
- Industrie et paysage concurrentiel
- Ensemble de données Excel
Témoignages
Le rapport sur le marché des systèmes SCADA d'Insight Partners est complet et fournit des informations précieuses sur les tendances actuelles et les prévisions. L'équipe a fait preuve d'un grand professionnalisme, d'une grande réactivité et d'un grand soutien tout au long du projet. Nous sommes très satisfaits et recommandons vivement leurs services.
RAN KEDEM Partenaire, Reali Technologies LTDJ'ai demandé un rapport sur un marché logiciel très spécifique et l'équipe l'a produit en quelques jours. Les informations étaient très pertinentes et bien présentées. J'ai ensuite demandé des modifications et des ajouts au rapport. L'équipe a de nouveau été très réactive et j'ai reçu le rapport final en moins d'une semaine.
JEAN-HERVÉ JENN Président, Future AnalyticaNous avons collaboré avec The Insight Partners pour une importante étude de marché et des prévisions. Ils nous ont fourni une vision claire des opportunités et des risques, ce qui nous a aidés à élaborer nos plans. Leurs recherches étaient faciles à utiliser et basées sur des données solides. Elles nous ont permis de prendre des décisions éclairées et en toute confiance. Nous les recommandons vivement.
PIYUSH NAGPAL Vice-président principal, Feux de route mondiauxInsight Partners a réalisé une étude de marché pertinente et bien structurée, avec une solide expertise du domaine. Son équipe a fait preuve de professionnalisme et de réactivité tout au long du projet. Son site web convivial a facilité l'accès aux rapports sectoriels. Nous recommandons vivement ses services d'études fiables et de haute qualité.
YUKIHIKO ADACHI PDG, Bleu profond, LLC.C'est la première fois que j'achète une étude de marché auprès de The Insight Partners. J'étais un peu hésitant au début, mais j'ai consulté leur site web et me suis senti plus à l'aise pour prendre le risque d'acheter une étude de marché. Je suis entièrement satisfait de la qualité du rapport et du service client. J'avais plusieurs questions et commentaires concernant le rapport initial, mais après quelques échanges par e-mail avec leur analyste, je pense avoir obtenu un rapport qui pourra alimenter notre processus de planification stratégique. Merci beaucoup pour votre temps et pour avoir rendu cette expérience positive. Je recommanderai sans hésiter vos services et vous serez mon premier contact lorsque nous aurons besoin de données de marché supplémentaires.
JOHN SUZUKI Président-directeur général, administrateur du conseil d'administration, BK TechnologiesJe tiens à vous remercier pour votre soutien et le professionnalisme dont vous avez fait preuve lors du traitement de ma demande d'informations concernant le marché des dispositifs de diagnostic in vitro (DIV) pour les maladies infectieuses au Nigéria. J'apprécie votre patience, vos conseils et votre volonté d'offrir une réduction, ce qui nous a finalement permis de conclure un accord. Je me réjouis de collaborer à nouveau avec The Insight Partners, grâce à l'impression que vous m'avez laissée suite à cette première rencontre.
DR CHIJIOKE DIRECTEUR GÉNÉRAL D'ONYIA, PineCrest Healthcare Ltd.Raison d'acheter
- Prise de décision éclairée
- Compréhension de la dynamique du marché
- Analyse concurrentielle
- Connaissances clients
- Prévisions de marché
- Atténuation des risques
- Planification stratégique
- Justification des investissements
- Identification des marchés émergents
- Amélioration des stratégies marketing
- Amélioration de l'efficacité opérationnelle
- Alignement sur les tendances réglementaires


Débloquez des remises exclusives sur les rapports
Demander maintenant


 Obtenez un échantillon gratuit pour - Marché des logiciels académiques