Rapport sur le marché de l’affichage interactif 2031 par segments, géographie, dynamique, développements récents et informations stratégiques
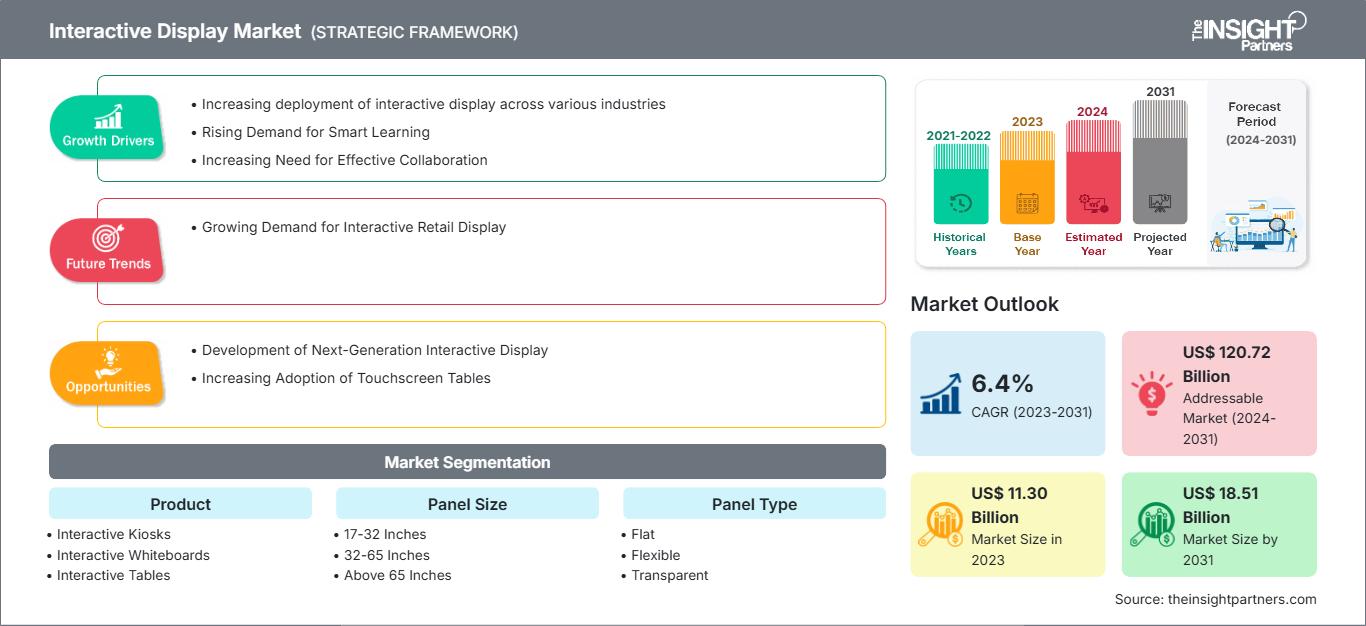
Données historiques : 2021-2022 | Année de référence : 2023 | Période de prévision : 2024-2031Taille et prévisions du marché des écrans interactifs (2021-2031), parts mondiales et régionales, tendances et opportunités de croissance. Rapport d'analyse : par produit (bornes interactives, tableaux blancs interactifs, tables interactives, murs vidéo interactifs et moniteurs interactifs), taille de panneau (17 à 32 pouces, 32 à 65 pouces et plus de 65 pouces), type de panneau (plat, flexible et transparent), secteur d'activité (commerce de détail et hôtellerie, santé, BFSI, éducation, divertissement et autres) et géographie.
- Statut : Publié
- Code du rapport : TIPTE100000263
- Catégorie : Électronique et semi-conducteurs
- Nombre de pages : 209
- Formats de rapport disponibles :


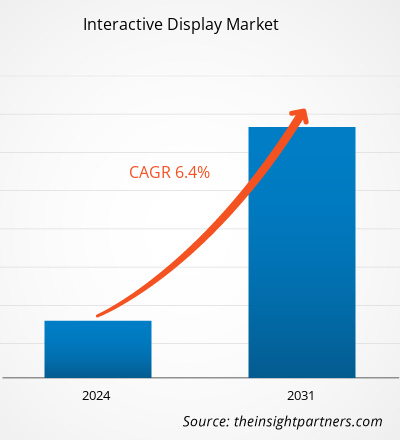
Le marché de l'affichage interactif devrait atteindre 18,51 milliards de dollars américains d'ici 2031, contre 11,30 milliards de dollars américains en 2023. Le marché devrait enregistrer un TCAC de 6,4 % entre 2023 et 2031. La demande croissante d'écrans interactifs pour la vente au détail devrait être la principale tendance du marché de l'affichage interactif au cours de la période de prévision.
Analyse du marché de l'affichage interactif
L'augmentation des applications de l'affichage interactif devrait contribuer à la croissance du marché de l'affichage interactif. L'augmentation des investissements dans les technologies de l'IA et l'expansion des secteurs de l'éducation, des BFSI et de la vente au détail devraient propulser le marché de l'affichage interactif au cours de la période de prévision. De plus, l'adoption croissante de technologies avancées telles que l'IA et les produits de nouvelle génération devrait favoriser la croissance du marché des écrans interactifs.
Aperçu du marché des écrans interactifs
Un écran interactif, également appelé écran tactile interactif, est un grand appareil mural doté d'une entrée tactile numérique permettant aux utilisateurs de créer des présentations visuelles et de manipuler des données à l'écran. Un écran interactif est une grande tablette qui offre des opportunités dynamiques aux élèves et aux enseignants en leur offrant un accès familier aux instructions. Ces appareils sont le plus souvent utilisés dans les salles de classe, les salles de réunion et autres environnements collaboratifs, car ils renforcent l'engagement et facilitent l'apprentissage interactif et la collaboration entre les utilisateurs. La numérisation croissante et l'expansion de nombreux secteurs tels que l'éducation, la vente au détail et le commerce électronique, les entreprises, les services financiers et les loisirs (BFSI) et le divertissement stimulent la croissance du marché des écrans interactifs.
Personnalisez ce rapport en fonction de vos besoins
Vous bénéficierez d’une personnalisation sur n’importe quel rapport - gratuitement - y compris des parties de ce rapport, ou une analyse au niveau du pays, un pack de données Excel, ainsi que de profiter d’offres exceptionnelles et de réductions pour les start-ups et les universités
Marché de l'affichage interactif: Perspectives stratégiques
-
Obtenez les principales tendances clés du marché de ce rapport.Cet échantillon GRATUIT comprendra une analyse de données, allant des tendances du marché aux estimations et prévisions.
Moteurs et opportunités du marché des écrans interactifs
Déploiement croissant des écrans interactifs dans divers secteurs pour stimuler le marché
Les écrans interactifs jouent un rôle important dans la compréhension des besoins, des envies, des goûts et des aversions des consommateurs. Ces machines aident les entreprises à obtenir des informations précieuses et à comprendre le comportement d'achat de leurs clients. Les principaux acteurs du marché développent des produits innovants ou ajoutent des fonctionnalités à leurs gammes existantes, telles que l'optimisation des couleurs et les assistants vocaux. Ces fonctionnalités supplémentaires aident les entreprises à attirer de nouveaux clients à travers le monde. De plus, la demande et l'adoption croissantes des écrans interactifs dans divers secteurs tels que l'éducation, la vente au détail, les services financiers, la santé et les transports stimulent le marché. Par exemple, en janvier 2023, l'aéroport de Queenstown a modernisé son terminal en installant un libre-service à usage commun (CUSS) afin d'améliorer l'expérience des passagers à l'aéroport. Le CUSS est une borne partagée qui facilite l'enregistrement et minimise les files d'attente. La numérisation croissante et la demande croissante de plateformes d'apprentissage numérique auprès des consommateurs ont également stimulé l'adoption des écrans interactifs dans le secteur de l'éducation. Ces tableaux permettent aux apprenants de visualiser et de comprendre facilement les concepts. De plus, la pandémie a profondément transformé le secteur de l'éducation, entraînant une augmentation des plateformes d'apprentissage numérique et de l'utilisation des tableaux d'affichage. L'évolution de la technologie SMART Board dans le secteur de l'éducation contribue à améliorer les performances et l'apprentissage des élèves, ce qui devrait stimuler le marché global dans un avenir proche.
Développement d'écrans interactifs nouvelle génération
Les technologies avancées telles que l'intelligence artificielle (IA) et l'Internet des objets (IoT) sont largement adoptées par les entreprises pour rationaliser leurs opérations et attirer de nouveaux clients. L'IA améliore l'affichage interactif en ajoutant des fonctionnalités importantes telles que les recommandations de contenu personnalisées, la reconnaissance gestuelle et les interfaces utilisateur adaptatives. Cela améliore l'interaction client en créant des expériences dynamiques et engageantes basées sur les comportements et les préférences. L'intégration de la technologie IA dans les écrans interactifs permet aux utilisateurs d'analyser les données pour obtenir des informations précieuses et d'affiner la diffusion du contenu en rendant les écrans interactifs plus réactifs.
Les fabricants d'écrans interactifs prennent des initiatives telles que la collaboration et le partenariat pour développer des écrans interactifs basés sur l'IA et de nouvelle génération afin de soutenir les secteurs, notamment la vente au détail et le commerce électronique, les entreprises, les services financiers et les services d'information, la santé et l'éducation, ce qui génère d'importantes opportunités sur le marché. Par exemple :
- En juin 2023, Hitachi Ltd s'est associé à LG Electronics Inc. pour lancer un nouvel écran IA destiné au secteur de la vente au détail et du commerce électronique. Les deux entreprises développent un écran tactile de 29 pouces doté de l'infrastructure biométrique et de l'authentification par clé publique, avec de nombreuses fonctionnalités supplémentaires telles qu'une caméra haute définition, une technologie de reconnaissance faciale et un système de surveillance en temps réel. L'écran interactif basé sur l'IA est conçu pour répondre aux exigences de divers clients, des commerces de détail aux restaurants, en passant par les bureaux, les salles de sport, les secteurs résidentiels et les centres de conférence.
- En octobre 2022, OTI Lumionics a levé 55 millions de dollars américains pour développer des matériaux d'affichage destinés aux fabricants d'écrans interactifs. Ce matériau permet aux fabricants de créer des écrans plein écran sans découpes pour les capteurs et les composants. La technologie d'affichage révolutionne l'industrie des smartphones en modifiant les processus de fabrication des écrans interactifs.
L'augmentation des investissements en R&D pour développer de nouvelles technologies crée également des opportunités pour les acteurs du marché. Par exemple, en octobre 2022, des chercheurs de l'Institut indien de technologie (IIT) de Madras ont développé un nouveau dispositif d'affichage, l'écran tactile interactif (iTad). Cet appareil est capable de simuler des textures telles que des bords tranchants et des surfaces rugueuses. Cette nouvelle technologie d'affichage intègre un capteur multi-touch qui détecte le mouvement d'un doigt grâce à un logiciel qui contrôle les champs électriques par électro-adhésion. Ainsi, l'augmentation des investissements en R&D pour le développement de produits de nouvelle génération devrait offrir des opportunités lucratives au marché de l'affichage interactif au cours de la période de prévision.
Analyse de segmentation du rapport sur le marché de l'affichage interactif
Les segments clés qui ont contribué à l'élaboration de l'analyse du marché de l'affichage interactif sont le produit, la taille du panneau, le type de panneau et le secteur vertical de l'industrie.
- Sur la base du produit, le marché de l'affichage interactif est segmenté en bornes interactives, tableaux blancs interactifs, tables interactives, murs vidéo interactifs et moniteurs interactifs. Français Le segment des bornes interactives devrait détenir une part de marché significative de l'affichage interactif d'ici 2030. La numérisation croissante et le déploiement croissant d'écrans d'affichage dans les centres commerciaux, les magasins de détail, les hôtels et les écoles stimulent la croissance du segment des bornes interactives.
- En fonction de la taille du panneau, le marché de l'affichage interactif est classé en 17 à 32 pouces, 32 à 65 pouces et plus de 65 pouces.
- En fonction du type de panneau, le marché est divisé en plat, flexible et transparent.
- En fonction du secteur vertical, le marché est divisé en commerce de détail et hôtellerie, soins de santé, BFSI, éducation, divertissement et autres.
Analyse des parts de marché de l'affichage interactif par géographie
La portée géographique du rapport sur le marché de l'affichage interactif est principalement divisée en cinq régions : Amérique du Nord, Asie-Pacifique, Europe, Moyen-Orient et Afrique, et Afrique du Sud et Amérique centrale.
L'Asie-Pacifique a dominé le marché de l'affichage interactif en 2023, grâce à la présence d'acteurs clés tels que Samsung Electronics Co Ltd, LG Electronics Inc, Panasonic Holdings Corp, Sharp Electronics Corp, Hitachi Ltd, BenQ Corporation et BOE Technology Group Co Ltd. Ces acteurs développent des produits avancés pour différents secteurs. Par exemple, en mai 2023, LG Electronics Inc. a lancé la solution de tableau blanc interactif LG CreateBoard, idéale pour les salles de classe numériques. Ce tableau blanc interactif intègre 40 points tactiles multipoints qui offrent à l'utilisateur une expérience de dessin et d'écriture interactive et fluide. De plus, les investissements croissants dans le secteur de l'éducation et les avancées technologiques constantes stimulent le marché de l'affichage interactif, en particulier dans les pays les plus avancés technologiquement au monde, comme la Chine, le Japon et la Corée du Sud.
Aperçu régional du marché des écrans interactifs
Les tendances régionales et les facteurs influençant le marché de l'affichage interactif tout au long de la période de prévision ont été analysés en détail par les analystes de The Insight Partners. Cette section aborde également les segments et la géographie du marché de l'affichage interactif en Amérique du Nord, en Europe, en Asie-Pacifique, au Moyen-Orient et en Afrique, ainsi qu'en Amérique du Sud et en Amérique centrale.
Portée du rapport sur le marché de l'affichage interactif
| Attribut de rapport | Détails |
|---|---|
| Taille du marché en 2023 | US$ 11.30 Billion |
| Taille du marché par 2031 | US$ 18.51 Billion |
| TCAC mondial (2023 - 2031) | 6.4% |
| Données historiques | 2021-2022 |
| Période de prévision | 2024-2031 |
| Segments couverts |
By Produits
|
| Régions et pays couverts |
Amérique du Nord
|
| Leaders du marché et profils d'entreprises clés |
|
Densité des acteurs du marché de l'affichage interactif : comprendre son impact sur la dynamique des entreprises
Le marché des écrans interactifs connaît une croissance rapide, portée par une demande croissante des utilisateurs finaux, due à des facteurs tels que l'évolution des préférences des consommateurs, les avancées technologiques et une meilleure connaissance des avantages du produit. Face à cette demande croissante, les entreprises élargissent leur offre, innovent pour répondre aux besoins des consommateurs et capitalisent sur les nouvelles tendances, ce qui alimente la croissance du marché.
- Obtenez le Marché de l'affichage interactif Aperçu des principaux acteurs clés

Naveen est un professionnel expérimenté des études de marché et du conseil, fort de plus de 9 ans d'expertise dans des projets personnalisés, syndiqués et de conseil. Actuellement vice-président associé, il a géré avec succès les parties prenantes tout au long de la chaîne de valeur des projets et a rédigé plus de 100 rapports de recherche et plus de 30 missions de conseil. Son expertise couvre des projets industriels et gouvernementaux, contribuant significativement à la réussite de ses clients et à la prise de décision fondée sur les données.
Naveen est titulaire d'un diplôme d'ingénieur en électronique et communication de la VTU, Karnataka, et d'un MBA en marketing et opérations de l'Université de Manipal. Membre actif de l'IEEE depuis 9 ans, il a participé à des conférences et des colloques techniques et s'est porté volontaire au niveau des sections et des régions. Avant d'occuper ce poste, il a travaillé comme consultant stratégique associé chez IndustryARC et comme consultant en serveurs industriels chez Hewlett Packard (HP Global).
- Analyse historique (2 ans), année de base, prévision (7 ans) avec TCAC
- Analyse PEST et SWOT
- Taille du marché Valeur / Volume - Mondial, Régional, Pays
- Industrie et paysage concurrentiel
- Ensemble de données Excel
Témoignages
Le rapport sur le marché des systèmes SCADA d'Insight Partners est complet et fournit des informations précieuses sur les tendances actuelles et les prévisions. L'équipe a fait preuve d'un grand professionnalisme, d'une grande réactivité et d'un grand soutien tout au long du projet. Nous sommes très satisfaits et recommandons vivement leurs services.
RAN KEDEM Partenaire, Reali Technologies LTDJ'ai demandé un rapport sur un marché logiciel très spécifique et l'équipe l'a produit en quelques jours. Les informations étaient très pertinentes et bien présentées. J'ai ensuite demandé des modifications et des ajouts au rapport. L'équipe a de nouveau été très réactive et j'ai reçu le rapport final en moins d'une semaine.
JEAN-HERVÉ JENN Président, Future AnalyticaNous avons collaboré avec The Insight Partners pour une importante étude de marché et des prévisions. Ils nous ont fourni une vision claire des opportunités et des risques, ce qui nous a aidés à élaborer nos plans. Leurs recherches étaient faciles à utiliser et basées sur des données solides. Elles nous ont permis de prendre des décisions éclairées et en toute confiance. Nous les recommandons vivement.
PIYUSH NAGPAL Vice-président principal, Feux de route mondiauxInsight Partners a réalisé une étude de marché pertinente et bien structurée, avec une solide expertise du domaine. Son équipe a fait preuve de professionnalisme et de réactivité tout au long du projet. Son site web convivial a facilité l'accès aux rapports sectoriels. Nous recommandons vivement ses services d'études fiables et de haute qualité.
YUKIHIKO ADACHI PDG, Bleu profond, LLC.C'est la première fois que j'achète une étude de marché auprès de The Insight Partners. J'étais un peu hésitant au début, mais j'ai consulté leur site web et me suis senti plus à l'aise pour prendre le risque d'acheter une étude de marché. Je suis entièrement satisfait de la qualité du rapport et du service client. J'avais plusieurs questions et commentaires concernant le rapport initial, mais après quelques échanges par e-mail avec leur analyste, je pense avoir obtenu un rapport qui pourra alimenter notre processus de planification stratégique. Merci beaucoup pour votre temps et pour avoir rendu cette expérience positive. Je recommanderai sans hésiter vos services et vous serez mon premier contact lorsque nous aurons besoin de données de marché supplémentaires.
JOHN SUZUKI Président-directeur général, administrateur du conseil d'administration, BK TechnologiesJe tiens à vous remercier pour votre soutien et le professionnalisme dont vous avez fait preuve lors du traitement de ma demande d'informations concernant le marché des dispositifs de diagnostic in vitro (DIV) pour les maladies infectieuses au Nigéria. J'apprécie votre patience, vos conseils et votre volonté d'offrir une réduction, ce qui nous a finalement permis de conclure un accord. Je me réjouis de collaborer à nouveau avec The Insight Partners, grâce à l'impression que vous m'avez laissée suite à cette première rencontre.
DR CHIJIOKE DIRECTEUR GÉNÉRAL D'ONYIA, PineCrest Healthcare Ltd.Raison d'acheter
- Prise de décision éclairée
- Compréhension de la dynamique du marché
- Analyse concurrentielle
- Connaissances clients
- Prévisions de marché
- Atténuation des risques
- Planification stratégique
- Justification des investissements
- Identification des marchés émergents
- Amélioration des stratégies marketing
- Amélioration de l'efficacité opérationnelle
- Alignement sur les tendances réglementaires


Débloquez des remises exclusives sur les rapports
Demander maintenant


 Obtenez un échantillon gratuit pour - Marché de l'affichage interactif