
Previsioni di mercato per la fatturazione e la gestione dei ricavi delle telecomunicazioni nel 2034
Dimensioni e previsioni del mercato della fatturazione e della gestione dei ricavi delle telecomunicazioni (2021-2034), quota globale e regionale, trend e opportunità di crescita. Copertura del rapporto di analisi: per tipo (fatturazione delle telecomunicazioni, fatturazione cloud e fatturazione IoT); componente (soluzione e servizi); tipo di distribuzione (cloud, on-premise e ibrido); e geografia
- Stato : Dati rilasciati
- Codice del report : TIPTE100000103
- Categoria : Tecnologia, media e telecomunicazioni
- Numero di pagine : 150
- Formati di report disponibili :


- Data dell'ultimo aggiornamento : January 19, 2026

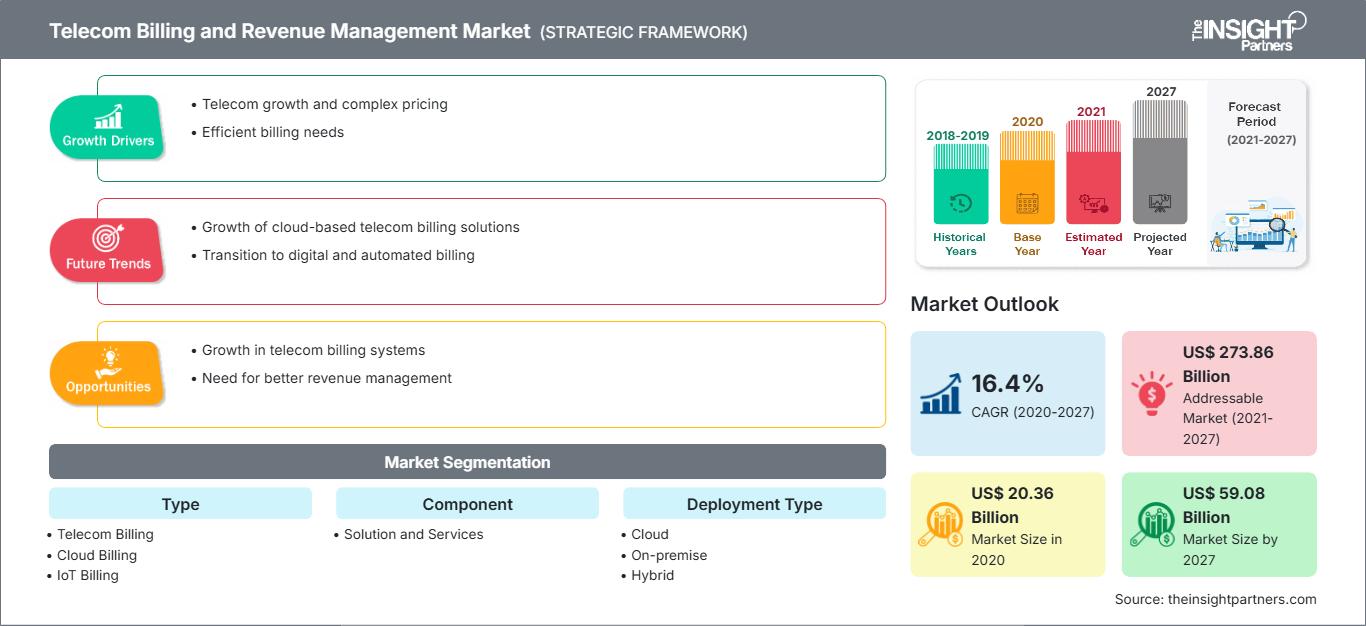
Si prevede che il mercato della fatturazione e della gestione dei ricavi delle telecomunicazioni raggiungerà i 133,89 miliardi di dollari entro il 2034, rispetto ai 39,89 miliardi di dollari del 2025, registrando un CAGR del 14,4% nel periodo 2026-2034.
Analisi di mercato della fatturazione e della gestione dei ricavi delle telecomunicazioni
Si prevede che il mercato della fatturazione e della gestione dei ricavi (BRM) nel settore delle telecomunicazioni crescerà notevolmente, trainato dalla rapida digitalizzazione delle telecomunicazioni, dalla proliferazione dei servizi dati (come 5G e IoT) e dalla crescente domanda di fatturazione in tempo reale e revenue assurance. Le soluzioni BRM basate su cloud vengono sempre più adottate dagli operatori di telecomunicazioni che ricercano efficienza operativa, flessibilità e scalabilità. Inoltre, la necessità di ridurre perdite di fatturato, frodi e imprecisioni nella fatturazione sta spingendo le aziende di telecomunicazioni a investire maggiormente in piattaforme avanzate di fatturazione, mediazione e revenue assurance.
Panoramica del mercato della fatturazione e della gestione dei ricavi delle telecomunicazioni
I sistemi di fatturazione e gestione dei ricavi (BRM) per le telecomunicazioni sono soluzioni software e di servizio essenziali che consentono ai fornitori di servizi di telecomunicazione (CSP) di gestire fatturazione, addebiti, gestione degli account, interconnessioni con i partner, prevenzione delle frodi e garanzia dei ricavi. Questi sistemi aiutano i CSP a gestire l'elaborazione di transazioni ad alto volume, la fatturazione degli abbonati, il monitoraggio in tempo reale dell'utilizzo e le transazioni tra operatori. Le piattaforme BRM sono essenziali per mantenere l'integrità finanziaria, ottimizzare i flussi di ricavi e garantire un'efficiente monetizzazione dei servizi (voce, dati, IoT, cloud, ecc.).
Automatizzando e consolidando i processi di fatturazione e di fatturato, i sistemi BRM consentono ai fornitori di servizi di telecomunicazioni di concentrarsi sull'innovazione e sull'esperienza del cliente, riducendo al minimo la perdita di fatturato e il rischio di conformità.
Personalizza questo report in base alle tue esigenze
Ottieni la PERSONALIZZAZIONE GRATUITAMercato della fatturazione e della gestione dei ricavi delle telecomunicazioni: approfondimenti strategici
-
Scopri le principali tendenze di mercato di questo rapporto.Questo campione GRATUITO includerà analisi dei dati, che spaziano dalle tendenze di mercato alle stime e alle previsioni.
Driver e opportunità del mercato della fatturazione e della gestione dei ricavi delle telecomunicazioni
Fattori trainanti del mercato:
- Crescita della base di abbonati e del traffico dati: con l'aumento degli abbonamenti alla telefonia mobile e alla banda larga, i CSP necessitano di sistemi di fatturazione e di gestione dei ricavi solidi per gestire elevati volumi di transazioni e un utilizzo diversificato dei servizi.
- Adozione di BRM basato su cloud: gli operatori di telecomunicazioni stanno orientandosi verso l'implementazione cloud per ottenere scalabilità, ridurre le spese in conto capitale e supportare una rapida crescita aziendale.
- Esigenze di garanzia dei ricavi e prevenzione delle frodi: la crescente complessità dei servizi di telecomunicazione (come roaming, interconnessione, IoT) richiede sistemi efficaci per prevenire perdite di ricavi e rilevare le frodi.
- Trasformazione digitale e fatturazione in tempo reale: con il 5G, l'IoT e i servizi convergenti, la fatturazione e l'addebito in tempo reale diventano fondamentali per la monetizzazione e la soddisfazione del cliente.
Opportunità di mercato:
- IoT e nuovi modelli di servizio: la crescita dell'IoT (Internet of Things) offre ai CSP l'opportunità di monetizzare l'utilizzo tramite modelli di fatturazione dinamici (ad esempio, basati sull'utilizzo, in abbonamento) e fatturazione dei partner.
- Integrazione di intelligenza artificiale e analisi: sfruttare l'intelligenza artificiale e l'apprendimento automatico per prevedere perdite di fatturato, ottimizzare i prezzi, rilevare anomalie e personalizzare la fatturazione può favorire la differenziazione.
- Mercati emergenti: le regioni ad alta crescita (in particolare nell'area Asia-Pacifico, in Medio Oriente e in Africa) stanno investendo in moderni sistemi BRM, con l'aumento della penetrazione delle telecomunicazioni.
- Modelli di distribuzione ibridi: le aziende di telecomunicazioni stanno adottando sempre più architetture BRM ibride (cloud + on-premise) per bilanciare controllo, conformità e flessibilità.
Analisi della segmentazione del rapporto di mercato sulla fatturazione e gestione dei ricavi delle telecomunicazioni
Il mercato è segmentato nel modo seguente (in linea con la tassonomia del rapporto):
Per tipo:
- Fatturazione delle telecomunicazioni
- Fatturazione cloud
- Fatturazione IoT
Per componente:
- Soluzione
- Servizi
Per tipo di distribuzione:
- In sede
- Basato su cloud
- Ibrido
Per geografia:
- America del Nord
- Europa
- Asia-Pacifico
- Medio Oriente e Africa
- America meridionale e centrale
Approfondimenti regionali sul mercato della fatturazione e della gestione dei ricavi delle telecomunicazioni
Le tendenze e i fattori regionali che influenzano il mercato della fatturazione e della gestione dei ricavi delle telecomunicazioni durante il periodo di previsione sono stati ampiamente spiegati dagli analisti di The Insight Partners. Questa sezione analizza anche i segmenti e l'area geografica del mercato della fatturazione e della gestione dei ricavi delle telecomunicazioni in Nord America, Europa, Asia-Pacifico, Medio Oriente e Africa, America Meridionale e Centrale.
Ambito del rapporto di mercato sulla fatturazione e la gestione dei ricavi delle telecomunicazioni
| Attributo del report | Dettagli |
|---|---|
| Dimensioni del mercato nel 2025 | 39,89 miliardi di dollari USA |
| Dimensioni del mercato entro il 2034 | 133,89 miliardi di dollari USA |
| CAGR globale (2026 - 2034) | 14,4% |
| Dati storici | 2021-2024 |
| Periodo di previsione | 2026-2034 |
| Segmenti coperti |
Per tipo
|
| Regioni e paesi coperti |
America del Nord
|
| Leader di mercato e profili aziendali chiave |
|
Densità degli operatori del mercato della fatturazione e della gestione dei ricavi delle telecomunicazioni: comprendere il suo impatto sulle dinamiche aziendali
Il mercato della fatturazione e della gestione dei ricavi nel settore delle telecomunicazioni è in rapida crescita, trainato dalla crescente domanda degli utenti finali, dovuta a fattori quali l'evoluzione delle preferenze dei consumatori, i progressi tecnologici e una maggiore consapevolezza dei vantaggi del prodotto. Con l'aumento della domanda, le aziende stanno ampliando la propria offerta, innovando per soddisfare le esigenze dei consumatori e sfruttando le tendenze emergenti, alimentando ulteriormente la crescita del mercato.
- Ottieni una panoramica dei principali attori del mercato della fatturazione e della gestione dei ricavi delle telecomunicazioni
Analisi della quota di mercato della fatturazione e della gestione dei ricavi delle telecomunicazioni per area geografica
- Nord America: forte presenza grazie a un'infrastruttura di telecomunicazioni matura, all'elevata adozione di soluzioni di revenue assurance e al consolidamento dei fornitori di servizi.
- Europa: crescita moderata, trainata dalla conformità normativa, dalla modernizzazione dei sistemi legacy e dalle implementazioni 5G.
- Asia-Pacifico: si prevede una rapida crescita dovuta alla crescente penetrazione delle telecomunicazioni, alle iniziative di trasformazione digitale e all'elevata adozione dell'IoT.
- Medio Oriente e Africa: opportunità emergenti man mano che gli operatori di telecomunicazioni aggiornano l'infrastruttura di fatturazione per una migliore monetizzazione ed efficienza.
- America meridionale e centrale: potenziale di crescita derivante dall'aumento degli abbonati alla telefonia mobile, degli MVNO e degli investimenti in sistemi di fatturazione moderni.
Densità degli operatori del mercato della fatturazione e della gestione dei ricavi delle telecomunicazioni: comprendere il suo impatto sulle dinamiche aziendali
Il mercato BRM è moderatamente concentrato, con un mix di grandi fornitori globali di BSS/OSS e operatori di nicchia. I principali fornitori competono in termini di sofisticatezza delle soluzioni (fatturazione in tempo reale, gestione delle frodi), architetture cloud-native e servizi gestiti.
La differenziazione competitiva è guidata da:
- Supporto per la fatturazione convergente e l'addebito in tempo reale
- Distribuzione cloud scalabile
- Garanzia dei ricavi e rilevamento delle anomalie basati sull'intelligenza artificiale
- Capacità di interconnessione e fatturazione dei partner
Le mosse strategiche che i giocatori stanno facendo o possono fare includono:
- Collaborazione con i CSP per iniziative di trasformazione digitale
- Integrazione di AI/ML per ridurre le perdite di fatturato e automatizzare il rilevamento delle frodi
- Miglioramento delle offerte BRM cloud per operatori più piccoli e mercati emergenti
- Offrire implementazioni BRM ibride per bilanciare investimenti legacy e flessibilità
Principali aziende operanti nel mercato della fatturazione e della gestione dei ricavi delle telecomunicazioni
Tra i principali attori di questo mercato figurano (in base all'analisi di The Insight Partners):
- Amdocs, Inc.
- CSG Systems International, Inc.
- Ericsson
- Hewlett-Packard Development Company, LP
- Huawei Technologies Co., Ltd.
- Accenture PLC
- Cerillion PLC
- goTransverse International, Inc.
- Alcatel-Lucent SA
Altri giocatori degni di nota analizzati:
- Oracle Corporation
- Fornitori di Netcracker / BSS
- Optiva, Subex, ecc.
Notizie e sviluppi recenti sul mercato della fatturazione e della gestione dei ricavi delle telecomunicazioni
- Adozione di Cloud BRM: gli operatori di telecomunicazioni stanno migrando sempre più verso soluzioni di fatturazione basate su cloud per supportare modelli di servizio dinamici e scalare le operazioni.
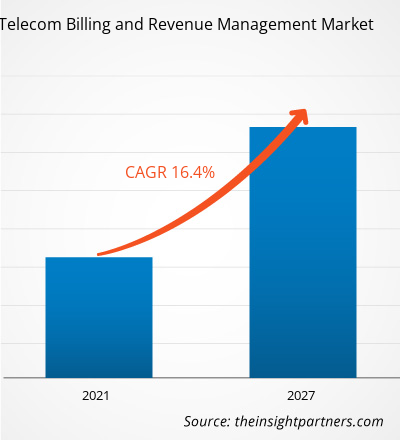
- Previsioni di crescita elevata: secondo The Insight Partners, si prevede che il mercato BRM raggiungerà i 59,08 miliardi di dollari entro il 2027, con un CAGR del 16,4%.
- Attenzione crescente all'intelligenza artificiale e all'automazione: per combattere le frodi, ridurre le perdite di fatturato e supportare la fatturazione in tempo reale, i fornitori di BRM stanno integrando analisi basate sull'intelligenza artificiale nelle loro piattaforme.
- Espansione nelle regioni emergenti: i crescenti investimenti nelle telecomunicazioni nell'area APAC e MEA stanno spingendo i fornitori di BRM a rafforzare la loro presenza in questi mercati.
Copertura e risultati del rapporto di mercato sulla fatturazione e la gestione dei ricavi delle telecomunicazioni
Il rapporto "Telecom Billing and Revenue Management Market – Forecast to 2027" di The Insight Partners offre:
- Dimensioni e previsioni del mercato a livello globale, regionale e nazionale per tutti i principali segmenti.
- Tendenze, fattori trainanti, vincoli e opportunità del mercato.
- Analisi PEST e SWOT dettagliate del mercato.
- Panorama competitivo: analisi della concentrazione, mappa di calore dei fornitori, attori chiave e sviluppi recenti.
- Profili aziendali: panoramica aziendale, portafoglio prodotti, dati finanziari, strategia.

Ankita è una dinamica professionista della ricerca di mercato e della consulenza con oltre 8 anni di esperienza nei settori della tecnologia, dei media, dell'ICT, dell'elettronica e dei semiconduttori. Ha guidato e portato a termine con successo oltre 100 incarichi di consulenza e ricerca per clienti globali come Microsoft, Oracle, NEC Corporation, SAP, KPMG ed Expeditors International. Le sue competenze principali includono la valutazione del mercato, l'analisi dei dati, le previsioni, la formulazione di strategie, l'intelligence competitiva e la redazione di report.
Ankita è esperta nella gestione di cicli di progetto completi, dalla progettazione di proposte pre-vendita e discussioni con i clienti fino alla fornitura di insight fruibili post-vendita. È esperta nella gestione di team interfunzionali, nella strutturazione di moduli di ricerca complessi e nell'allineamento delle soluzioni agli obiettivi aziendali specifici del cliente. Le sue eccellenti capacità di comunicazione, leadership e presentazione le hanno permesso di fornire costantemente risultati orientati al valore in contesti di mercato in rapida evoluzione.
- Analisi completa delle dimensioni e delle previsioni di mercato
- Analisi dettagliata della segmentazione
- Valutazione approfondita delle dinamiche di mercato
- Approfondimenti a livello regionale e nazionale
- Analisi del panorama competitivo e benchmarking aziendale
- Business intelligence strategica
Testimonianze
Il report di mercato sui sistemi SCADA di Insight Partners è completo, con preziosi spunti sulle tendenze attuali e sulle previsioni future. Il team si è dimostrato altamente professionale, reattivo e disponibile in ogni fase del progetto. Siamo molto soddisfatti e consigliamo vivamente i loro servizi.
RAN KEDEM Partner, Reali Technologies LTDsHo richiesto un report su un mercato software molto specifico e il team lo ha prodotto in pochi giorni. Le informazioni erano molto pertinenti e ben presentate. Ho quindi richiesto alcune modifiche e aggiunte al report. Il team è stato ancora una volta molto reattivo e ho ricevuto il report finale in meno di una settimana.
JEAN-HERVE JENN Presidente, Future AnalyticaAbbiamo collaborato con The Insight Partners per un importante studio di mercato e una previsione. Ci hanno fornito informazioni chiare su opportunità e rischi, che ci hanno aiutato a definire i nostri piani. La loro ricerca è stata facile da usare e basata su dati solidi. Ci ha aiutato a prendere decisioni intelligenti e consapevoli. Li consigliamo vivamente.
PIYUSH NAGPAL Vicepresidente senior, Abbaglianti globaliInsight Partners ha fornito ricerche di mercato approfondite e ben strutturate, con una solida competenza nel settore. Il loro team si è dimostrato professionale e reattivo in ogni fase. Il sito web intuitivo ha reso l'accesso ai report di settore semplice e immediato. Li consigliamo vivamente per servizi di ricerca affidabili e di alta qualità.
YUKIHIKO ADACHI Amministratore delegato, Deep Blue, LLC.Questa è la prima volta che acquisto un report di mercato da The Insight Partners. Sebbene inizialmente fossi indeciso, ho visitato il loro sito web e mi sono sentito più a mio agio nell'acquistare un report di mercato. Sono completamente soddisfatto della qualità del report e del servizio clienti. Avevo diverse domande e commenti sul report iniziale, ma dopo un paio di conversazioni via email con il loro analista credo di avere un report che posso utilizzare come input per il nostro processo di pianificazione strategica. Grazie mille per aver dedicato del tempo extra e aver reso questa esperienza positiva. Consiglierò sicuramente il vostro servizio ad altri e sarete la mia prima persona a cui rivolgermi quando avremo bisogno di ulteriori dati di mercato.
GIOVANNI SUZUKI Presidente e Amministratore Delegato, Consigliere di Amministrazione, Tecnologie BKDesidero esprimere la mia gratitudine per il supporto e la professionalità dimostrati nel rispondere alla mia richiesta di informazioni sul mercato dei dispositivi medici in vitro per malattie infettive in Nigeria. Apprezzo la vostra pazienza, la vostra guida e la vostra disponibilità a offrirmi uno sconto, che alla fine ci ha permesso di concludere l'affare. Non vedo l'ora di collaborare con The Insight Partners in futuro, grazie anche all'impressione che mi avete lasciato dopo questo primo incontro.
Dott. Chijioke AMMINISTRATORE DELEGATO DI ONYIA, PineCrest Healthcare Ltd.Motivo dell'acquisto
- Processo decisionale informato
- Comprensione delle dinamiche di mercato
- Analisi competitiva
- Analisi dei clienti
- Previsioni di mercato
- Mitigazione del rischio
- Pianificazione strategica
- Giustificazione degli investimenti
- Identificazione dei mercati emergenti
- Miglioramento delle strategie di marketing
- Aumento dell'efficienza operativa
- Allineamento alle tendenze normative


