
Pronóstico del mercado de facturación y gestión de ingresos de telecomunicaciones para 2034
Informe de tamaño y pronóstico del mercado de facturación y gestión de ingresos de telecomunicaciones (2021-2034), participación global y regional, tendencias y análisis de oportunidades de crecimiento. Cobertura: por tipo (facturación de telecomunicaciones, facturación en la nube y facturación de IoT); componente (solución y servicios); tipo de implementación (nube, local e híbrida); y geografía.
- Estado : Datos publicados
- Código de informe : TIPTE100000103
- Categoría : Tecnología, medios y telecomunicaciones
- Número de páginas : 150
- Formatos de informe disponibles :


- Fecha de última actualización : January 19, 2026

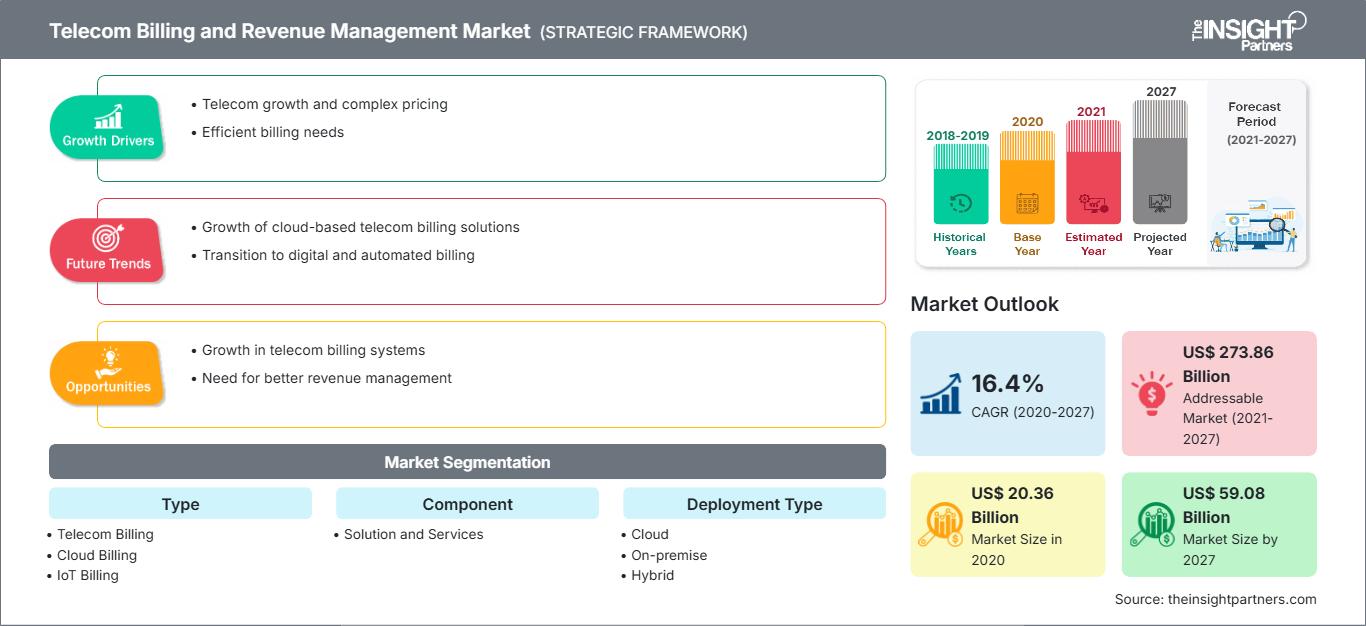
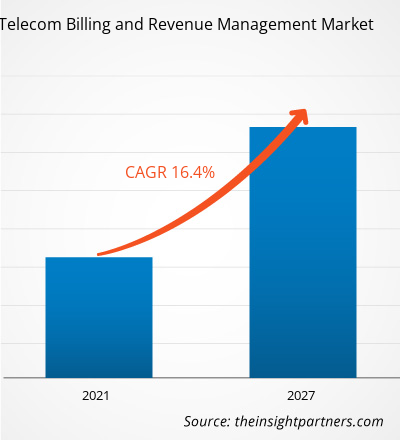
Se espera que el tamaño del mercado de facturación y gestión de ingresos de telecomunicaciones alcance los 133.890 millones de dólares en 2034, desde los 39.890 millones de dólares en 2025, registrando una CAGR del 14,4 % durante 2026-2034.
Análisis del mercado de facturación y gestión de ingresos de telecomunicaciones
Se prevé un fuerte crecimiento del mercado de facturación y gestión de ingresos (BRM) en telecomunicaciones, impulsado por la rápida digitalización de las telecomunicaciones, la proliferación de servicios de datos (como 5G e IoT) y la creciente demanda de facturación y aseguramiento de ingresos en tiempo real. Las soluciones BRM basadas en la nube son cada vez más adoptadas por los operadores de telecomunicaciones que buscan eficiencia operativa, flexibilidad y escalabilidad. Además, la necesidad de reducir las fugas de ingresos, el fraude y las imprecisiones en la facturación impulsa a las empresas de telecomunicaciones a invertir más en plataformas avanzadas de facturación, mediación y aseguramiento de ingresos.
Descripción general del mercado de facturación y gestión de ingresos de telecomunicaciones
Los sistemas de Facturación y Gestión de Ingresos de Telecomunicaciones (BRM) son soluciones críticas de software y servicios que permiten a los proveedores de servicios de telecomunicaciones (CSP) gestionar la facturación, los cobros, la gestión de cuentas, las interconexiones con socios, el fraude y la garantía de ingresos. Estos sistemas ayudan a los CSP a gestionar el procesamiento de transacciones de alto volumen, la facturación de suscriptores, la monitorización del uso en tiempo real y las liquidaciones entre operadores. Las plataformas BRM son esenciales para mantener la integridad financiera, optimizar los flujos de ingresos y garantizar la monetización eficiente de los servicios (voz, datos, IoT, nube, etc.).
Al automatizar y consolidar los procesos de facturación e ingresos, los sistemas BRM permiten a los proveedores de telecomunicaciones centrarse en la innovación y la experiencia del cliente, al tiempo que minimizan la fuga de ingresos y el riesgo de incumplimiento.
Personalice este informe según sus necesidades
Obtenga PERSONALIZACIÓN GRATUITAMercado de facturación y gestión de ingresos de telecomunicaciones: perspectivas estratégicas
-
Obtenga las principales tendencias clave del mercado de este informe.Esta muestra GRATUITA incluirá análisis de datos, desde tendencias del mercado hasta estimaciones y pronósticos.
Impulsores y oportunidades del mercado de facturación y gestión de ingresos de telecomunicaciones
Factores impulsores del mercado:
- Creciente base de suscriptores y tráfico de datos: a medida que aumentan las suscripciones a servicios móviles y de banda ancha, los CSP necesitan sistemas de facturación e ingresos sólidos para gestionar grandes volúmenes de transacciones y un uso diverso de los servicios.
- Adopción de BRM basado en la nube: los operadores de telecomunicaciones están cambiando hacia la implementación en la nube para ganar escalabilidad, reducir el gasto de capital y respaldar el rápido crecimiento empresarial.
- Necesidades de garantía de ingresos y prevención de fraude: la creciente complejidad de los servicios de telecomunicaciones (como roaming, interconexión, IoT) exige sistemas sólidos para prevenir fugas de ingresos y detectar fraudes.
- Transformación digital y facturación en tiempo real: con 5G, IoT y servicios convergentes, la facturación y el cobro en tiempo real se vuelven fundamentales para la monetización y la satisfacción del cliente.
Oportunidades de mercado:
- IoT y nuevos modelos de servicio: el crecimiento de IoT (Internet de las cosas) abre oportunidades para que los CSP moneticen el uso a través de modelos de facturación dinámicos (por ejemplo, basados en el uso, suscripción) y facturación de socios.
- Integración de IA y análisis: aprovechar la IA y el aprendizaje automático para predecir fugas de ingresos, optimizar precios, detectar anomalías y personalizar la facturación puede impulsar la diferenciación.
- Mercados emergentes: Las regiones de alto crecimiento (especialmente en APAC, Medio Oriente y África) están invirtiendo en sistemas BRM modernos a medida que aumenta la penetración de las telecomunicaciones.
- Modelos de implementación híbridos: las empresas de telecomunicaciones están adoptando cada vez más arquitecturas BRM híbridas (nube + local) para equilibrar el control, el cumplimiento y la flexibilidad.
Análisis de segmentación del informe de mercado de facturación y gestión de ingresos de telecomunicaciones
El mercado está segmentado de la siguiente manera (de acuerdo con la taxonomía del informe):
Por tipo:
- Facturación de telecomunicaciones
- Facturación en la nube
- Facturación de IoT
Por componente:
- Solución
- Servicios
Por tipo de implementación:
- Local
- Basado en la nube
- Híbrido
Por geografía:
- América del norte
- Europa
- Asia-Pacífico
- Oriente Medio y África
- América del Sur y Central
Perspectivas regionales del mercado de facturación y gestión de ingresos de telecomunicaciones
Los analistas de The Insight Partners han explicado detalladamente las tendencias y los factores regionales que influyen en el mercado de facturación y gestión de ingresos de telecomunicaciones durante el período de pronóstico. Esta sección también analiza los segmentos y la geografía del mercado de facturación y gestión de ingresos de telecomunicaciones en Norteamérica, Europa, Asia Pacífico, Oriente Medio y África, y Sudamérica y Centroamérica.
Alcance del informe de mercado sobre facturación y gestión de ingresos de telecomunicaciones
| Atributo del informe | Detalles |
|---|---|
| Tamaño del mercado en 2025 | US$ 39.89 mil millones |
| Tamaño del mercado en 2034 | US$ 133.89 mil millones |
| CAGR global (2026-2034) | 14,4% |
| Datos históricos | 2021-2024 |
| Período de pronóstico | 2026-2034 |
| Segmentos cubiertos |
Por tipo
|
| Regiones y países cubiertos |
América del norte
|
| Líderes del mercado y perfiles de empresas clave |
|
Densidad de actores del mercado de facturación y gestión de ingresos de telecomunicaciones: comprensión de su impacto en la dinámica empresarial
El mercado de facturación y gestión de ingresos de telecomunicaciones está creciendo rápidamente, impulsado por la creciente demanda de los usuarios finales debido a factores como la evolución de las preferencias de los consumidores, los avances tecnológicos y un mayor conocimiento de los beneficios del producto. A medida que aumenta la demanda, las empresas amplían su oferta, innovan para satisfacer las necesidades de los consumidores y aprovechan las tendencias emergentes, lo que impulsa aún más el crecimiento del mercado.
- Obtenga una descripción general de los principales actores clave del mercado de gestión de ingresos y facturación de telecomunicaciones
Análisis de la cuota de mercado de facturación y gestión de ingresos de telecomunicaciones por geografía
- América del Norte: Fuerte presencia debido a una infraestructura de telecomunicaciones madura, alta adopción de garantía de ingresos y consolidación de proveedores de servicios.
- Europa: crecimiento moderado, impulsado por el cumplimiento normativo, la modernización de sistemas heredados y las implementaciones de 5G.
- Asia Pacífico: Se espera que sea testigo de un rápido crecimiento debido a la creciente penetración de las telecomunicaciones, las iniciativas de transformación digital y la alta adopción de IoT.
- Medio Oriente y África: Oportunidades emergentes a medida que los operadores de telecomunicaciones actualizan la infraestructura de facturación para lograr una mejor monetización y eficiencia.
- América del Sur y Central: Potencial de crecimiento gracias al aumento de suscriptores móviles, OMV e inversión en sistemas de facturación modernos.
Densidad de actores del mercado de facturación y gestión de ingresos de telecomunicaciones: comprensión de su impacto en la dinámica empresarial
El mercado de BRM está moderadamente concentrado, con una combinación de grandes proveedores globales de BSS/OSS y actores de nicho. Los principales proveedores compiten en la sofisticación de sus soluciones (facturación en tiempo real, gestión del fraude), arquitecturas nativas de la nube y servicios gestionados.
La diferenciación competitiva está impulsada por:
- Soporte para facturación convergente y cobro en tiempo real
- Implementación escalable en la nube
- Garantía de ingresos y detección de anomalías impulsadas por IA
- Capacidades de interconexión y facturación de socios
Los movimientos estratégicos que los jugadores están realizando o pueden realizar incluyen:
- Asociación con CSP para iniciativas de transformación digital
- Integración de IA/ML para reducir las fugas de ingresos y automatizar la detección de fraudes
- Mejorar las ofertas de BRM en la nube para operadores más pequeños y mercados emergentes
- Ofreciendo implementaciones BRM híbridas para equilibrar las inversiones heredadas y la flexibilidad
Principales empresas que operan en el mercado de facturación y gestión de ingresos de telecomunicaciones
Algunos de los actores clave en este mercado incluyen (según el análisis de The Insight Partners):
- Amdocs, Inc.
- CSG Systems Internacional, Inc.
- Ericsson
- Compañía de desarrollo Hewlett-Packard, LP
- Huawei Technologies Co., Ltd.
- Accenture PLC
- Cerillion PLC
- goTransverse International, Inc.
- Alcatel-Lucent SA
Otros jugadores destacados analizados:
- Corporación Oracle
- Proveedores de Netcracker/BSS
- Optiva, Subex, etc.
Noticias y desarrollos recientes del mercado de facturación y gestión de ingresos de telecomunicaciones
- Adopción de BRM en la nube: los operadores de telecomunicaciones están migrando cada vez más a soluciones de facturación basadas en la nube para respaldar modelos de servicio dinámicos y escalar operaciones.
- Pronósticos de alto crecimiento: según The Insight Partners, se espera que el mercado de BRM alcance los USD 59,08 mil millones para 2027, creciendo a una CAGR del 16,4%.
- Enfoque emergente en IA y automatización: para combatir el fraude, reducir la fuga de ingresos y respaldar la facturación en tiempo real, los proveedores de BRM están integrando análisis impulsados por IA en sus plataformas.
- Expansión en regiones emergentes: la creciente inversión en telecomunicaciones en APAC y MEA está impulsando a los proveedores de BRM a fortalecer su presencia en estos mercados.
Informe de mercado sobre facturación y gestión de ingresos de telecomunicaciones: cobertura y resultados
El informe "Mercado de facturación y gestión de ingresos de telecomunicaciones: pronóstico hasta 2027" de The Insight Partners ofrece:
- Tamaño del mercado y pronóstico a nivel global, regional y nacional para todos los segmentos principales.
- Tendencias del mercado, impulsores, restricciones y oportunidades.
- Análisis detallado PEST y FODA del mercado.
- Panorama competitivo: análisis de concentración, mapa de calor de proveedores, actores clave y desarrollos recientes.
- Perfiles de empresas: descripción del negocio, cartera de productos, finanzas, estrategia.

Ankita es una profesional dinámica en investigación de mercados y consultoría con más de 8 años de experiencia en los sectores de tecnología, medios de comunicación, TIC, electrónica y semiconductores. Ha liderado y ejecutado con éxito más de 100 proyectos de consultoría e investigación para clientes globales como Microsoft, Oracle, NEC Corporation, SAP, KPMG y Expeditors International. Sus principales competencias incluyen la evaluación de mercado, el análisis de datos, la previsión, la formulación de estrategias, la inteligencia competitiva y la redacción de informes.
Ankita es experta en la gestión de ciclos completos de proyecto, desde el diseño de propuestas de preventa y las conversaciones con los clientes hasta la entrega de información práctica posventa. Es experta en la gestión de equipos multifuncionales, la estructuración de módulos de investigación complejos y la alineación de soluciones con los objetivos de negocio específicos del cliente. Sus excelentes habilidades de comunicación, liderazgo y presentación le han permitido obtener constantemente resultados orientados al valor en entornos de mercado dinámicos y en constante evolución.
- Análisis exhaustivo del tamaño del mercado y previsiones
- Análisis detallado de la segmentación
- Evaluación en profundidad de la dinámica del mercado
- Información a nivel regional y nacional
- Panorama competitivo y análisis comparativo de empresas
- Inteligencia empresarial estratégica
Testimonios
El informe de mercado de sistemas SCADA de Insight Partners es completo y ofrece información valiosa sobre las tendencias actuales y las previsiones futuras. El equipo fue altamente profesional, receptivo y me brindó un gran apoyo en todo momento. Estamos muy satisfechos y recomendamos ampliamente sus servicios.
RAN KEDEM Socio, Reali Technologies LTDsSolicité un informe sobre un mercado de software muy específico y el equipo lo elaboró en pocos días. La información era muy relevante y estaba bien presentada. Posteriormente, solicité algunos cambios y adiciones al informe. El equipo fue muy receptivo y recibí el informe final en menos de una semana.
JEAN-HERVE JENN Presidente, Future AnalyticaTrabajamos con The Insight Partners para un importante estudio y pronóstico de mercado. Nos brindaron una visión clara de las oportunidades y los riesgos, lo que nos ayudó a definir nuestros planes. Su investigación fue fácil de usar y se basó en datos sólidos. Nos ayudó a tomar decisiones inteligentes y seguras. Los recomendamos ampliamente.
PIYUSH NAGPAL Vicepresidente Sénior, , High Beam GlobalThe Insight Partners realizó una investigación de mercado profunda y bien estructurada con una sólida experiencia en el sector. Su equipo fue profesional y receptivo en todo momento. El sitio web, fácil de usar, facilitó el acceso a los informes del sector. Los recomendamos ampliamente por sus servicios de investigación confiables y de alta calidad.
YUKIHIKO ADACHI Director Ejecutivo, , Deep Blue, LLCEsta es la primera vez que compro un informe de mercado de The Insight Partners. Aunque al principio tenía dudas, visité su sitio web y me sentí más cómodo al arriesgarme y comprarlo. Estoy completamente satisfecho con la calidad del informe y el servicio al cliente. Tenía varias preguntas y comentarios sobre el informe inicial, pero después de un par de conversaciones por correo electrónico con su analista, creo que tengo un informe que puedo usar como base para nuestro proceso de planificación estratégica. Muchas gracias por tomarse el tiempo y hacer de esta una experiencia positiva. Sin duda, recomendaré sus servicios y serán mi primera opción cuando necesitemos más datos de mercado.
JOHN SUZUKI Presidente y Director Ejecutivo, Director de la Junta Directiva, BK TechnologiesAgradezco su apoyo y la profesionalidad que demostraron al atender mi solicitud de información sobre el mercado de diagnóstico in vitro (IVD) para enfermedades infecciosas en Nigeria. Agradezco su paciencia, su orientación y su disposición a ofrecerme un descuento, lo que finalmente nos permitió cerrar un trato. Espero poder colaborar con The Insight Partners en el futuro, gracias a la impresión que me causó este primer encuentro.
DRA. CHIJIOKE ONYIA, DIRECTORA GENERAL, PineCrest Healthcare Ltd.Razón para comprar
- Toma de decisiones informada
- Comprensión de la dinámica del mercado
- Análisis competitivo
- Información sobre clientes
- Pronósticos del mercado
- Mitigación de riesgos
- Planificación estratégica
- Justificación de la inversión
- Identificación de mercados emergentes
- Mejora de las estrategias de marketing
- Impulso de la eficiencia operativa
- Alineación con las tendencias regulatorias


