拡張知能市場の需要、シェア、成長率(2034年まで)
拡張知能市場規模と予測(2021年~2034年)、世界および地域別シェア、トレンド、成長機会分析レポートの対象範囲:技術別(機械学習、自然言語処理、マシンビジョン、コンテキスト認識コンピューティング、その他)、企業規模別(大企業および中小企業)、エンドユーザー別(ITおよび通信、小売およびEコマース、BFSI、ヘルスケア、その他)、および地域別
- ステータス : 公開されたデータ
- レポートコード : TIPRE00008793
- カテゴリー : テクノロジー、メディア、通信
- ページ数 : 150
- 利用可能なレポート形式 :


- 最終更新日 : April 09, 2026


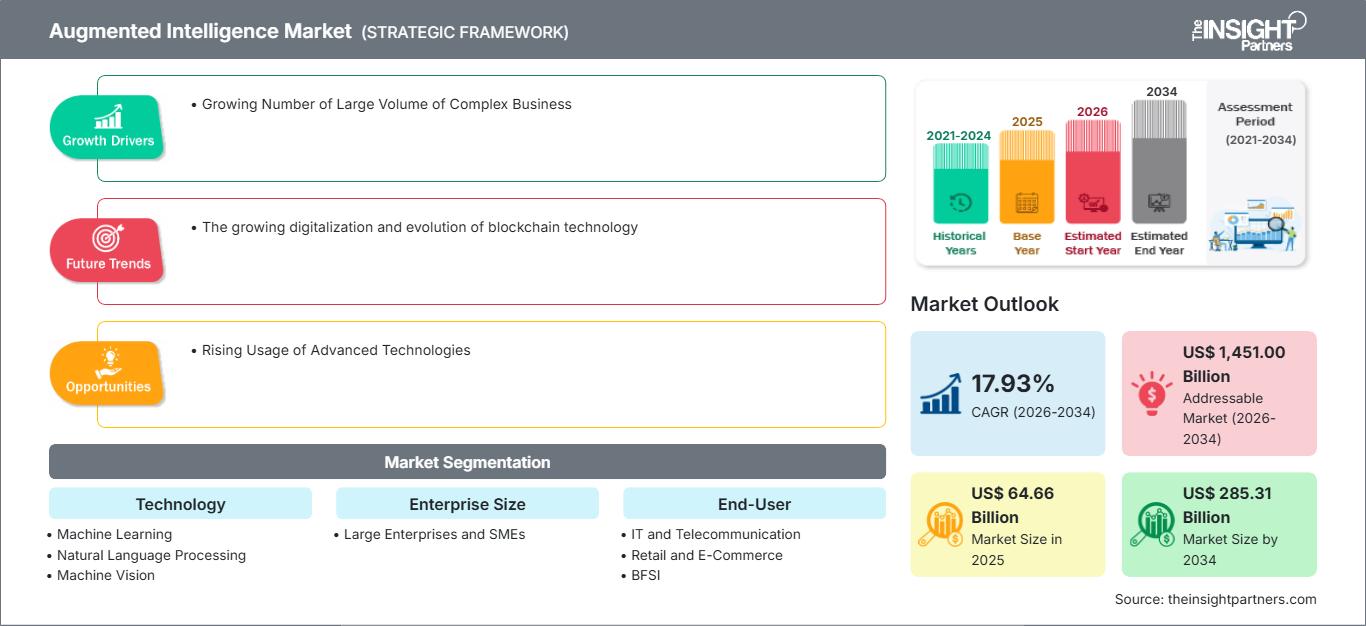
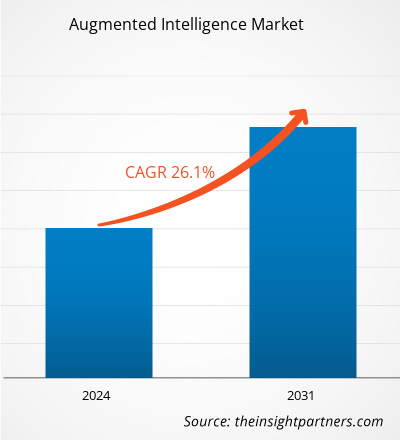
拡張知能市場規模は、2025年の646億6000万米ドルから、2034年には2853億1000万米ドルに達すると予測されています。また、2026年から2034年の予測期間において、年平均成長率(CAGR)は17.93%になると見込まれています。
拡張知能市場分析
複雑なビジネスデータの量が増加し、金融サービス、IT・通信、小売・eコマース業界が拡大していることから、拡張知能市場は急速に成長しています。中小企業における拡張知能の導入拡大が市場を牽引し、着実に成長を続けています。さらに、企業における先進技術の利用拡大とクラウドベースソリューションの採用増加も、市場成長にとって魅力的な機会となっています。
拡張知能市場の概要
拡張知能は、人工知能の支援機能に焦点を当てた人工知能の一種です。さらに、拡張知能は、企業がビジネスや日常生活において、より正確なデータに基づいた意思決定を行えるよう支援するために開発されています。また、企業は拡張知能を活用して従業員のパフォーマンスを向上させ、従業員の改善点を把握することで市場を牽引しています。加えて、拡張知能は、企業に予測分析を提供することで、膨大なセキュリティデータを活用し、優先順位付けを行うための最も効果的な手法です。
市場調査のハイライト
- 拡張知能の世界市場規模は、2025年には646億6000万米ドルと評価された。
- 年間市場規模は2034年までに2,853億1,000万米ドルに達すると予測されている。
- 2026年から2034年までの潜在市場規模(TAM)は、約1兆4510億米ドルに達すると予測されています。
- 市場は予測期間中に年平均成長率(CAGR)17.93%を記録すると予想されている。
- 米国は、複雑なビジネスが大規模かつ多量に展開されるケースの増加と、業界のダイナミクスの変化に支えられ、重要な市場となっている。
- 市場分析は、北米、ヨーロッパ、アジア太平洋、南米、中米、中東、アフリカを対象とし、予測期間全体にわたる成長を評価しています。
- 先進技術の利用拡大などの市場機会は、市場のダイナミクスと対象市場に影響を与えると予想される。
- 本レポートでは、IBM Corporation、Microsoft Corporation、SAP SE、TIBCO Software Inc.、Sisense Inc.、Salesforce.com, Inc.、QlikTech International AB、Cosmo Tech、CognitiveScale、MicroStrategy Incorporated.などの業界参加企業を紹介するとともに、競争戦略とイノベーションの動向を分析しています。
お客様のご要望に合わせてこのレポートをカスタマイズしてください
無料カスタマイズ拡張知能市場:戦略的洞察
-
本レポートの主要市場トレンドをご覧ください。この無料サンプルには、市場動向から予測、見通しまで、幅広いデータ分析が含まれています。
拡張知能市場の推進要因と機会
複雑なビジネスデータの大量増加が市場を牽引している
機械学習や自然言語処理といった拡張知能技術は、データ分析においてますます重要性を増している。拡張知能は、企業内に蓄積された組織化されたデータ、半構造化データ、非構造化データの分析を可能にする。産業の拡大と企業活動におけるデジタル技術の進化に伴い、今後数年間で生成されるデータの種類と量は大幅に増加すると予測されている。これにより、企業は大量のデータを効果的かつ効率的に管理するために、拡張知能ソリューションへの需要を高めている。しかし、複雑なデータ量の増加は、予測期間中、拡張知能市場を牽引すると見込まれている。
先進技術の利用拡大 ― 拡張知能市場におけるチャンス
人工知能、機械学習、自然言語処理技術などの先進技術の利用拡大は、予測期間中の市場成長の機会を生み出しています。IT・通信、小売・eコマース、金融サービス、ヘルスケアなど、多くの業界が膨大な量のデータを生成しており、これらのデータをリアルタイムで分析するための高度な技術を必要としています。これにより、拡張知能ソリューションの需要が高まっています。業界は、リアルタイムで効果的な意思決定を行うために、人工知能、機械学習、自然言語処理などの新技術を採用し、膨大なデータを分析しています。これらのツールは、データから洞察を抽出するプロセスを簡素化し、その普及を促進し、市場に新たな機会を生み出しています。
拡張知能市場レポートのセグメンテーション分析
拡張知能市場分析の導出に貢献した主要セグメントは、テクノロジー、企業規模、エンドユーザーである。
- 技術面に基づくと、拡張知能市場は機械学習、自然言語処理、マシンビジョン、コンテキスト認識コンピューティング、その他に分類される。2023年には機械学習分野が最大の市場シェアを占めた。
- 企業規模の観点から見ると、市場は大手企業と中小企業に区分される。2023年には中小企業セグメントがより大きな市場シェアを占めた。
- エンドユーザー別に見ると、市場はIT・通信、小売・eコマース、金融サービス、ヘルスケア、その他に分類される。2023年には金融サービス分野が最大の市場シェアを占めた。
拡張知能市場の地域別シェア分析
拡張知能市場レポートの地理的範囲は、主に北米、アジア太平洋、ヨーロッパ、中東・アフリカ、南米/中南米の5つの地域に分けられます。
収益面では、北米が拡張知能市場で最大のシェアを占めています。これは、IBM、Microsoft、TIBCO Software、Salesforce.com、MicroStrategyなどの主要企業の存在に加え、技術革新が進んでいるためです。これらの企業は、AI、ML、NLPといった先進技術の導入に多額の投資を行い、機能追加などを通じてこれらの技術開発に継続的に取り組んでいます。IT・通信、金融サービス、小売・eコマース、ヘルスケアなど、様々な業界におけるクラウドベースの拡張知能への需要の高まりが、北米市場の成長を後押しすると予測されています。
拡張知能市場レポートの範囲
| レポート属性 | 詳細 |
|---|---|
| 2025年の市場規模 | 646億6000万米ドル |
| 2034年までの市場規模 | 2,853億1,000万米ドル |
| 世界の年間平均成長率(2026年~2034年) | 17.93% |
| 履歴データ | 2021年~2024年 |
| 予測期間 | 2026年~2034年 |
| 対象分野 |
テクノロジーによって
|
| 対象地域および国 |
北米
|
| 市場リーダーと主要企業の概要 |
|
拡張知能市場のプレーヤー密度:ビジネスダイナミクスへの影響を理解する
拡張知能市場は、消費者の嗜好の変化、技術革新、製品のメリットに対する認識の高まりといった要因によるエンドユーザー需要の増加を背景に、急速に成長しています。需要の高まりに伴い、企業は製品・サービスの提供範囲を拡大し、消費者のニーズに応えるべく革新を進め、新たなトレンドを活用することで、市場の成長をさらに加速させています。
拡張知能市場のニュースと最新動向
拡張知能市場は、主要な企業出版物、業界団体のデータ、データベースなどを含む一次調査および二次調査後の定性的データと定量的データを収集することによって評価されます。以下は、拡張知能市場における動向と戦略の一覧です。
- オラクル社は本日、2023年9月にOracle Analytics Cloudに搭載された新たなAI機能を発表しました。生成型AIアシスタントや拡張分析などの新しいセルフサービスAI機能は、組織がデータによる意思決定への影響を改善するのに役立ちます。(出典:オラクル社、プレスリリース、2023年)
拡張知能市場レポートの対象範囲と成果物
「拡張知能市場規模と予測(2021年~2031年)」レポートは、以下の分野を網羅した市場の詳細な分析を提供します。
- 調査範囲に含まれるすべての主要市場セグメントについて、世界、地域、国レベルでの市場規模と予測
- 市場の動向(推進要因、阻害要因、主要な機会など)
- 将来の主要トレンド
- 詳細なPEST分析/ポーターの5つの力分析およびSWOT分析
- 主要な市場動向、主要企業、規制、および最近の市場動向を網羅した、グローバルおよび地域市場の分析。
- 市場集中度、ヒートマップ分析、主要企業、最近の動向などを網羅した業界概況および競争分析
- 詳細な企業プロフィール

アンキタは、テクノロジー、メディア、ICT、エレクトロニクス・半導体の各分野で8年以上の経験を持つ、ダイナミックな市場調査およびコンサルティングのプロフェッショナルです。Microsoft、Oracle、NEC、SAP、KPMG、Expeditors Internationalといったグローバルクライアントに対し、100件以上のコンサルティングおよび調査案件を主導・遂行してきました。彼女のコアコンピテンシーは、市場評価、データ分析、予測、戦略策定、競合情報、レポート作成です。
アンキタは、販売前の提案書作成やクライアントとの協議から、販売後の実用的なインサイトの提供まで、プロジェクトサイクル全体を巧みに管理することに長けています。彼女は、部門横断的なチームの管理、複雑な調査モジュールの構築、そしてクライアント固有のビジネス目標に合わせたソリューションの調整に長けています。優れたコミュニケーション能力、リーダーシップ、そしてプレゼンテーション能力により、急速に変化する市場環境において、常に価値主導の成果を生み出しています。
- 包括的な市場規模および予測分析
- 詳細なセグメンテーション分析
- 市場動向(ダイナミクス)の徹底的な評価
- 地域および国別のインサイト
- 競争環境および企業ベンチマーク
- 戦略的ビジネスインテリジェンス
お客様の声
Insight PartnersのSCADAシステム市場レポートは包括的で、現在のトレンドと将来の予測に関する貴重な洞察が含まれています。チームは終始、非常にプロフェッショナルで、対応が早く、サポートも充実していました。私たちは彼らのサービスに非常に満足しており、強くお勧めします。
ラン・ケデム パートナー, レアリテクノロジーズ株式会社非常に特殊なソフトウェア市場に関するレポートを依頼したところ、チームは数日でレポートを作成してくれました。情報は非常に関連性が高く、分かりやすくまとめられていました。その後、レポートにいくつか修正と追加を依頼しましたが、チームは非常に迅速に対応し、1週間も経たないうちに最終レポートを受け取ることができました。
ジャン=エルヴェ・ジェン 会長, フューチャー・アナリティカ重要な市場調査と予測のために、The Insight Partnersと協力しました。彼らは機会とリスクに関する明確な洞察を提供し、私たちの計画策定に役立ちました。彼らの調査は使いやすく、確かなデータに基づいており、賢明で自信に満ちた意思決定に役立ちました。彼らを強くお勧めします。
ピユーシュ・ナグパル 上級副社長, ハイビームグローバルInsight Partnersは、深い専門知識に基づき、洞察力に富み、構造化された市場調査を提供しました。チームは終始プロフェッショナルで、対応力も抜群でした。ユーザーフレンドリーなウェブサイトにより、業界レポートへのアクセスもスムーズでした。信頼性の高い高品質な調査サービスをお探しなら、Insight Partnersを強くお勧めします。
安達幸彦 最高経営責任者(CEO), ディープブルーLLC。The Insight Partnersから市場レポートを購入するのは今回が初めてです。最初は不安でしたが、ウェブサイトを見て、リスクを負ってでも購入してみようという気持ちになりました。レポートの品質とカスタマーサービスには大変満足しています。最初のレポートにはいくつか質問やコメントがありましたが、アナリストとメールで何度かやり取りした結果、戦略策定プロセスへのインプットとして活用できるレポートが完成しました。貴重なお時間を割いていただき、貴重な体験をさせていただき、誠にありがとうございました。他の方にもぜひお勧めしたいですし、今後さらに市場データが必要になった際には、まずThe Insight Partnersにご連絡させていただきます。
ジョン・スズキ 社長兼最高経営責任者、取締役, BKテクノロジーズナイジェリアの感染症IVD市場に関する情報提供依頼に対し、ご対応いただいた際、ご尽力とプロフェッショナルな姿勢に深く感謝申し上げます。忍耐強く、的確なアドバイスをいただき、また、最終的に取引成立に至った割引のご提供にも深く感謝申し上げます。今回の最初の出会いで得た強い印象のおかげで、今後もThe Insight Partnersとの連携を心待ちにしております。
チジオケ博士 オニア マネージングディレクター, パインクレストヘルスケア株式会社購入理由
- 情報に基づいた意思決定
- 市場動向の理解
- 競合分析
- 顧客インサイト
- 市場予測
- リスク軽減
- 戦略計画
- 投資の正当性
- 新興市場の特定
- マーケティング戦略の強化
- 業務効率の向上
- 規制動向への対応


