放送インフラ市場レポート 2028 - セグメント、地域、動向、最近の動向、戦略的洞察
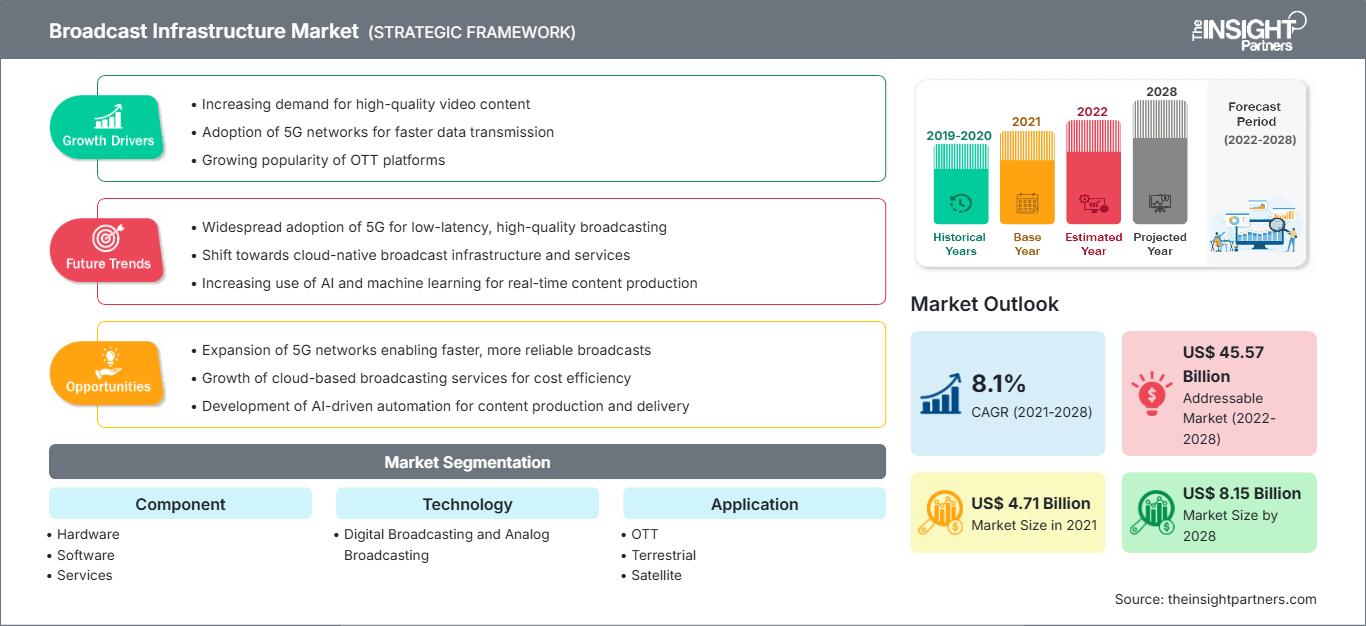
過去データ : 2019-2020 | 基準年 : 2021 | 予測期間 : 2022-20282028年までの放送インフラ市場予測 - COVID-19の影響とコンポーネント(ハードウェア、ソフトウェア、サービス)、テクノロジー(デジタル放送とアナログ放送)、アプリケーション(OTT、地上波、衛星放送、IPTV、その他)別のグローバル分析
- ステータス : 出版
- レポートコード : TIPRE00010798
- カテゴリー : エレクトロニクスおよび半導体
- ページ数 : 198
- 利用可能なレポート形式 :


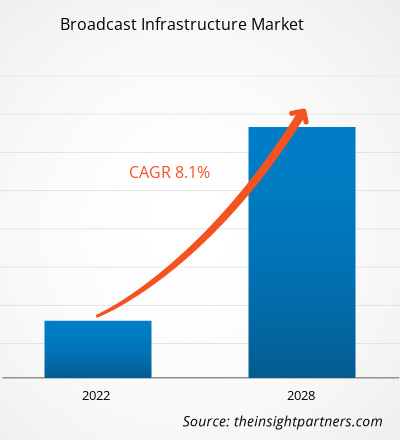
[調査レポート]放送インフラ市場は2021年に47億1,370万米ドルと評価され、2028年には81億4,570万米ドルに達すると予測されています。2021年から2028年にかけて年平均成長率(CAGR)8.1%で成長すると見込まれています。
放送業界はアナログ技術からデジタル技術へのパラダイムシフトにより、高度な放送インフラを導入しましたが、これは比較的複雑です。放送業界では、インターネットプロトコルテレビ(IPTV)、ウェブテレビ、高精細テレビ(HDTV)、ペイパービューなどの新しい放送技術への需要が高まっています。より充実したビデオ体験への需要は、世界中の放送局、特にアジアの放送局にとって大きな道を開くと予想されています。放送インフラ市場を牽引するもう一つの重要な要素は、サーバー、セットトップボックス、動画コンテンツ保護システム、そして適切なツール、ミドルウェア、課金システムで構成される統合プラットフォームです。これらのプラットフォームにより、IPネットワークとDSLまたは光アクセスシステムを組み合わせた基盤上で、ビデオオンデマンド、ストリーミング、タイムシフトTVなど、様々な形式のTVサービスの提供が可能になります。現在、放送用ハードウェアインフラの高コスト、メンテナンスコストの高さ、そして頻繁なハードウェアアップグレードを理由に、ベンダーはハードウェアベースのインフラからソフトウェアベースのインフラへと移行しつつあります。放送業界は、ユーザーエクスペリエンスの向上と放送インフラベンダーにとってのビジネスチャンスの創出を目指し、技術開発による革新的なイノベーションを進めています。
要件に合わせてレポートをカスタマイズ
レポートの一部、国レベルの分析、Excelデータパックなどを含め、スタートアップ&大学向けに特別オファーや割引もご利用いただけます(無償)
放送インフラ市場: 戦略的洞察
-
このレポートの主要な市場動向を入手してください。この無料サンプルには、市場動向から見積もりや予測に至るまでのデータ分析が含まれます。
COVID-19パンデミックでは、膨大な数の人々が在宅勤務をし、オンラインで過ごす時間を増やし、デジタルへの移行を誇示しています。このデジタルリソースの需要は、多くのソフトウェアおよびプラットフォーム組織のシステムにさらなる負担をかけ、信頼性と品質を備えたサービスを提供する能力を妨げています。しかし、COVID-19の発生は、ビジネスの停止と労働力不足により、エンドユーザーへのビデオコンテンツ配信に関与するプレーヤーに悪影響を及ぼしています。COVID-19危機はまた、ビジネスの封鎖、渡航禁止、サプライチェーンの混乱により、サプライヤーネットワークから顧客配信エクスペリエンスまで、バリューチェーン全体の業務を劇的に混乱させました。
市場洞察 - 放送インフラ市場:新しい放送技術の採用が増加
デジタル化の継続的な改善と可処分所得の増加により、市場ではIPTVとHDTVの採用率が高まっています。充実した動画体験への需要は、世界中の放送局、特にアジアにおいて、放送業界にとって大きな前進となることが期待されています。オンデマンド視聴の増加に伴い、アジア太平洋地域全体でブロードバンドの普及が進んでいます。さらに、Netflixなどのサブスクリプション型のOTT(Over The Top)プラットフォームもアジアで人気を集めています。クラウドベースのインフラ、クラウドベースのソリューションとマネージドサービス、ハイブリッドネットワークへの政府支出の増加は、放送インフラ市場の成長を後押しすると予想されます。セキュリティへの懸念の高まりと顧客の信頼維持は、放送局が新しい配信モデルを採用することを促すでしょう。これらの進歩と開発はすべて、予測期間中の市場成長にプラスの影響を与える可能性が高いでしょう。
コンポーネントベースの洞察
コンポーネントに基づいて、放送インフラ市場はハードウェア、ソフトウェア、サービスの3つに分類されます。2020年にはソフトウェアセグメントが最大の市場シェアを占めました。
放送インフラ市場
予測期間全体を通して放送インフラ市場に影響を与える地域的な動向と要因については、The Insight Partnersのアナリストが詳細に解説しています。このセクションでは、北米、ヨーロッパ、アジア太平洋、中東・アフリカ、中南米における放送インフラ市場のセグメントと地域についても解説しています。
放送インフラ市場レポートのスコープ
| レポート属性 | 詳細 |
|---|---|
| の市場規模 2021 | US$ 4.71 Billion |
| 市場規模別 2028 | US$ 8.15 Billion |
| 世界的なCAGR (2021 - 2028) | 8.1% |
| 過去データ | 2019-2020 |
| 予測期間 | 2022-2028 |
| 対象セグメント |
By コンポーネント
|
| 対象地域と国 |
北米
|
| 市場リーダーと主要企業の概要 |
|
放送インフラ市場におけるプレーヤーの密度:ビジネスダイナミクスへの影響を理解する
放送インフラ市場は、消費者の嗜好の変化、技術の進歩、製品メリットへの認知度の高まりといった要因によるエンドユーザー需要の高まりに牽引され、急速に成長しています。需要の増加に伴い、企業は提供内容の拡充、消費者ニーズへの対応のためのイノベーション、そして新たなトレンドの活用を進めており、これが市場の成長をさらに加速させています。
- 入手 放送インフラ市場 主要プレーヤーの概要
放送インフラ市場で事業を展開している企業は、高度で効率的な製品の開発に主に焦点を当てています。
- 2021年6月、放送およびニューメディア制作向けのライブビデオ技術の大手プロバイダーであるEVSは、Gravity Mediaとの提携を発表しました。この提携により、同社の新しい統合ビデオ判定および通信ソリューションの中核技術として、Xeebraマルチカメラレビューシステムが提供されます。
- 2021年6月、Ross Videoは、メディアアセットワークフローソリューション企業であるPrimestreamの買収を発表しました。これらのソリューションは、エンタープライズ、デジタルメディア、スポーツ、放送など、さまざまな市場分野の顧客によって使用されています。同社のソリューションは、各市場における独特でますます複雑化するクリエイティブ、ビジネス、テクノロジーの課題を解決するように設計されています。この買収を通じて、Rossは当然のことながら、Streamlineメディアアセット管理ソリューションをPrimestream製品と徐々に融合させ、完全に統合されたグラフィックスおよび制作アセット管理プラットフォームを構築していく予定です。
放送インフラ市場は、次のようにセグメント化されています。コンポーネント別
- ハードウェア
- ソフトウェア
- サービス
放送インフラ市場 – 技術別
- デジタル放送
- アナログ放送
放送インフラ市場 – アプリケーション別
- OTT
- 地上波
- 衛星放送
- IPTV
- その他
放送インフラ市場 –地域別
- 北米
- 米国
- カナダ
- メキシコ
- ヨーロッパ
- ドイツ
- フランス
- イタリア
- 英国
- ロシア
- その他ヨーロッパ
- アジア太平洋 (APAC)
- オーストラリア
- 中国
- インド
- 日本
- 韓国
- その他 APAC
- 中東 &アフリカ (MEA)
- サウジアラビア
- UAE
- 南アフリカ
- MEA のその他の国
- 南米 (SAM)
- ブラジル
- アルゼンチン
- SAM のその他の国
放送インフラ市場 – 企業プロファイル
- Cisco Systems, Inc.
- Clyde Broadcast Technology
- CS Computer Systems Ltd.
- Dacast Inc.
- EVS Broadcast Equipment SA
- Grass Valley
- Kaltura
- Nevion
- Ross Video Ltd
- Zixi

Naveenは、カスタム、シンジケート、コンサルティングの各プロジェクトにおいて9年以上の実績を持つ、経験豊富な市場調査およびコンサルティングのプロフェッショナルです。現在はアソシエイトバイスプレジデントを務め、プロジェクトバリューチェーン全体にわたるステークホルダー管理を成功させ、100件以上の調査レポートと30件以上のコンサルティング案件を執筆しています。産業および政府機関のプロジェクトに幅広く携わり、クライアントの成功とデータに基づく意思決定に大きく貢献しています。
Naveenは、カルナータカ州VTUで電子通信工学の学位を取得し、マニパル大学でマーケティング&オペレーションズのMBAを取得しています。IEEEの会員として9年間活動し、会議や技術シンポジウムへの参加、セクションレベルおよび地域レベルでのボランティア活動に積極的に取り組んでいます。現職以前は、IndustryARCでアソシエイト戦略コンサルタント、Hewlett Packard(HP Global)で産業用サーバーコンサルタントを務めていました。
- 過去2年間の分析、基準年、CAGRによる予測(7年間)
- PEST分析とSWOT分析
- 市場規模価値/数量 - 世界、地域、国
- 業界と競争環境
- Excel データセット
お客様の声
Insight PartnersのSCADAシステム市場レポートは包括的で、現在のトレンドと将来の予測に関する貴重な洞察が含まれています。チームは終始、非常にプロフェッショナルで、対応が早く、サポートも充実していました。私たちは彼らのサービスに非常に満足しており、強くお勧めします。
ラン・ケデム パートナー, レアリテクノロジーズ株式会社非常に特殊なソフトウェア市場に関するレポートを依頼したところ、チームは数日でレポートを作成してくれました。情報は非常に関連性が高く、分かりやすくまとめられていました。その後、レポートにいくつか修正と追加を依頼しましたが、チームは非常に迅速に対応し、1週間も経たないうちに最終レポートを受け取ることができました。
ジャン=エルヴェ・ジェン 会長, フューチャー・アナリティカ重要な市場調査と予測のために、The Insight Partnersと協力しました。彼らは機会とリスクに関する明確な洞察を提供し、私たちの計画策定に役立ちました。彼らの調査は使いやすく、確かなデータに基づいており、賢明で自信に満ちた意思決定に役立ちました。彼らを強くお勧めします。
ピユーシュ・ナグパル 上級副社長, ハイビームグローバルInsight Partnersは、深い専門知識に基づき、洞察力に富み、構造化された市場調査を提供しました。チームは終始プロフェッショナルで、対応力も抜群でした。ユーザーフレンドリーなウェブサイトにより、業界レポートへのアクセスもスムーズでした。信頼性の高い高品質な調査サービスをお探しなら、Insight Partnersを強くお勧めします。
安達幸彦 最高経営責任者(CEO), ディープブルーLLC。The Insight Partnersから市場レポートを購入するのは今回が初めてです。最初は不安でしたが、ウェブサイトを見て、リスクを負ってでも購入してみようという気持ちになりました。レポートの品質とカスタマーサービスには大変満足しています。最初のレポートにはいくつか質問やコメントがありましたが、アナリストとメールで何度かやり取りした結果、戦略策定プロセスへのインプットとして活用できるレポートが完成しました。貴重なお時間を割いていただき、貴重な体験をさせていただき、誠にありがとうございました。他の方にもぜひお勧めしたいですし、今後さらに市場データが必要になった際には、まずThe Insight Partnersにご連絡させていただきます。
ジョン・スズキ 社長兼最高経営責任者、取締役, BKテクノロジーズナイジェリアの感染症IVD市場に関する情報提供依頼に対し、ご対応いただいた際、ご尽力とプロフェッショナルな姿勢に深く感謝申し上げます。忍耐強く、的確なアドバイスをいただき、また、最終的に取引成立に至った割引のご提供にも深く感謝申し上げます。今回の最初の出会いで得た強い印象のおかげで、今後もThe Insight Partnersとの連携を心待ちにしております。
チジオケ博士 オニア マネージングディレクター, パインクレストヘルスケア株式会社購入理由
- 情報に基づいた意思決定
- 市場動向の理解
- 競合分析
- 顧客インサイト
- 市場予測
- リスク軽減
- 戦略計画
- 投資の正当性
- 新興市場の特定
- マーケティング戦略の強化
- 業務効率の向上
- 規制動向への対応


 無料サンプルを入手 - 放送インフラ市場