ビジュアル分析市場レポート 2025 - セグメント、地域、動向、最近の動向、戦略的洞察
過去データ : 2015-2016 | 基準年 : 2017 | 予測期間 : 2018-20252025年までのビジュアル分析市場 - 導入モデル(オンプレミスとクラウド)、ビジネス機能(営業・マーケティング、オペレーション、財務、サプライチェーン、情報技術、CRM、人事)、業種(小売・消費財、IT・通信、BFSI、製造、エネルギー・公益事業、ヘルスケア、政府機関)別のグローバル分析と予測
- ステータス : 出版
- レポートコード : TIPTE100000740
- カテゴリー : テクノロジー、メディア、通信
- ページ数 : 154
- 利用可能なレポート形式 :


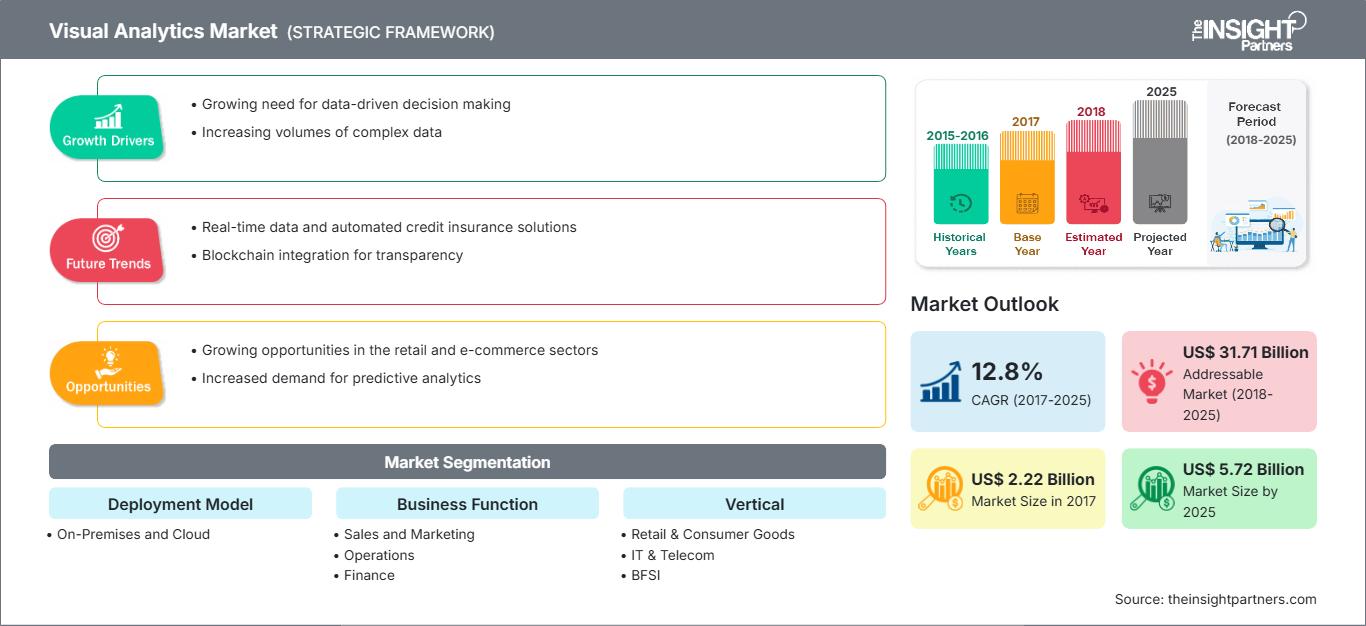
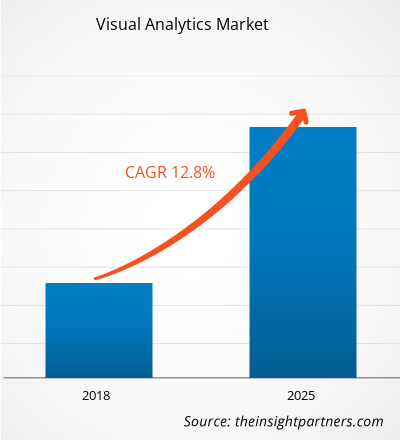
[調査レポート]ビジュアル分析市場は2017年に2億2,150万米ドルと評価され、2025年には5億7,1860万米ドルに達すると予測されています。ビジュアル分析市場は、2017年から2025年の予測期間中に12.8%のCAGRで成長すると見込まれています。
視覚化とインタラクティブ分析を組み合わせて大規模なデータセットを探索することが、ビジュアル分析ソリューションの全体的な目標です。言い換えれば、ビジュアル分析とは、インタラクティブなビジュアルインターフェースによって促進される分析的推論の科学です。より正確に言うと、ビジュアル分析は、情報収集、データ前処理、知識表現、対話、意思決定を含む反復的なプロセスです。最終的な目標は、異種のソースからの膨大な量の科学的、法医学的、またはビジネスデータによって説明される目の前の問題に対する洞察を得ることです。この目標を達成するために、ビジュアル分析は機械の強みと人間の強みを組み合わせています。データベースにおける知識発見(KDD)、統計、数学などの手法が自動分析の原動力となっている一方で、人間の知覚、関連付け、結論を出す能力は、ビジュアル分析を非常に有望な研究分野へと変えています。今日では、単なるデータ視覚化だけでは不十分であり、企業はデータ視覚化と統合されたデータ駆動型分析機能を期待しています。ビジュアル分析は、手作業による情報操作と組み合わされた知的なビジュアルメタファーの形成として説明できます。
ビジュアル分析市場は、導入モデル、業務機能、および垂直市場に基づいて細分化されています。導入モデルに基づいて、ビジュアル分析市場はオンプレミスとクラウドに分類されています。業務機能に基づいて、ビジュアル分析市場は営業・マーケティング、運用、財務、サプライチェーン、情報技術、CRM、人事に分類されています。市場はさらに垂直市場に基づいて、小売・消費財、IT・通信、BFSI、製造、エネルギー・公益事業、ヘルスケア、政府機関に分類されています。地理的に見ると、市場は北米、ヨーロッパ、アジア太平洋、中東およびアフリカ、南米の 5 つの地域に分かれています。
要件に合わせてレポートをカスタマイズ
レポートの一部、国レベルの分析、Excelデータパックなどを含め、スタートアップ&大学向けに特別オファーや割引もご利用いただけます(無償)
ビジュアルアナリティクス市場: 戦略的洞察
-
このレポートの主要な市場動向を入手してください。この無料サンプルには、市場動向から見積もりや予測に至るまでのデータ分析が含まれます。
今日のデータ視覚化と分析のイノベーションに影響を与える最大のトレンドは、人工知能(AI)と機械学習の普及です。人間の制御を手放すことにためらいを抱くIT部門やアナリストにとっては恐ろしいように聞こえるかもしれませんが、AIとML機能を備えた分析プラットフォームは、実際には現代のアナリストにとって非常に効果的なアシスタントとして機能するでしょう。置き換えられるのではないかという懸念もあるかもしれませんが、機械学習は実際にはアナリストの能力を大幅に強化し、より効率的で、より正確になり、ビジネスへの影響力を高めます。機械学習テクノロジーを恐れるのではなく、それがもたらす機会を積極的に活用しましょう。
導入モデルに基づく市場の洞察
ビジュアル分析は、クラウドとオンプレミスの導入モデルで構成されます。ビジュアル分析の導入モデルは、特定のモデルを選択する上で重要な決定要因です。企業は、さまざまな要因に応じて、クラウドとオンプレミスの両方の導入モードを好みます。クラウドベースのビジュアル分析は、価格が手頃なため、多くの中小企業が最適な導入方法として好んでいます。
ビジネス機能ベースの市場インサイト
ビジネスアプローチのパラダイムシフトにより、世界中の、特に先進地域で、さまざまな業界の垂直市場で、ビジネスプロセスにさまざまな分析ソフトウェアを統合することへの需要が高まっています。今日のビジネスユーザーは、従来のデータ管理、処理、分析手法から大きく進歩しています。特定のセクターのさまざまなビジネス機能では、さまざまな目的でデータを分析する必要があります。
垂直市場インサイト
ビジュアル分析ツールの基本的な機能は、複雑なデータを取得し、それを非常にインタラクティブで理解しやすい方法でユーザーに提示することです。ビジュアル分析ツールには、データの視覚化と分析という2つの重要なタスクを実行する必要があります。単純な視覚化では、大量のデータを簡素化する問題を解決できません。これらのツールの使いやすさ、費用対効果、ビジュアル分析ツールのカスタマイズ性、インタラクティブなユーザーインターフェース、ダッシュボード、フィルタリングオプションなどは、エンドユーザーが自社のビジネス機能に適したビジュアル分析ツールを選択する際に考慮すべき要素です。
ビジュアル分析市場で事業を展開する企業は、市場開拓、買収、製品発売といった戦略に注力することで、ビジュアル分析市場における地位を維持しています。ビジュアル分析市場の主要企業による開発事例は以下のとおりです。
2018年9月、TIBCOはTIBCO Spotfire向けのA(X) Experienceを発表しました。これにより、データストリームのリアルタイムビジュアル分析が可能になり、リアルタイムの認識と対応が可能になります。
2018年9月、SAP SEはSAP Analytics Cloudを発表しました。これは、あらゆる分析を1つのシンプルなクラウドで実現するものです。この分析クラウドは、データの視覚化、予測、計画機能をオールインワンで統合した機能を顧客に提供します。
ビジュアル分析市場の地域別分析
予測期間を通じてビジュアルアナリティクス市場に影響を与える地域的なトレンドと要因については、The Insight Partnersのアナリストが詳細に解説しています。このセクションでは、北米、ヨーロッパ、アジア太平洋、中東・アフリカ、中南米におけるビジュアルアナリティクス市場のセグメントと地域についても解説しています。
ビジュアルアナリティクス市場レポートの範囲
| レポート属性 | 詳細 |
|---|---|
| の市場規模 2017 | US$ 2.22 Billion |
| 市場規模別 2025 | US$ 5.72 Billion |
| 世界的なCAGR (2017 - 2025) | 12.8% |
| 過去データ | 2015-2016 |
| 予測期間 | 2018-2025 |
| 対象セグメント |
By 展開モデル
|
| 対象地域と国 |
北米
|
| 市場リーダーと主要企業の概要 |
|
ビジュアル分析市場のプレーヤー密度:ビジネスダイナミクスへの影響を理解する
ビジュアルアナリティクス市場は、消費者の嗜好の変化、技術の進歩、製品メリットの認知度向上といった要因によるエンドユーザーの需要増加に牽引され、急速に成長しています。需要の高まりに伴い、企業は提供内容の拡充、消費者ニーズへの対応のためのイノベーション、そして新たなトレンドの活用を進めており、これが市場の成長をさらに加速させています。
- 入手 ビジュアルアナリティクス市場 主要プレーヤーの概要
- オンプレミス
- クラウド
ビジュアル アナリティクス市場 – ビジネス機能別
- 営業およびマーケティング
- 運用
- 財務
- サプライ チェーン
- 情報技術
- CRM
- 人事
- その他
ビジュアル アナリティクス市場 – 業種別
- 小売および消費財市場
- IT および通信
- BFSI
- 製造
- エネルギーおよび公益事業
- その他
- 医療
- 政府機関
ビジュアル アナリティクス市場 –地域別
-
北米
- 米国
- カナダ
- メキシコ
-
ヨーロッパ
- フランス
- ドイツ
- スペイン
- 英国
- イタリア
-
アジア太平洋 (APAC)
- 中国
- インド
- 日本
- オーストラリア
-
MEA
- サウジアラビア
- UAE
- 南アフリカ
-
SAM
- ブラジル
ビジュアル アナリティクス マーケット –会社概要
- ADVIZOR Solutions, Inc.
- Alteryx, Inc.
- IBM Corporation
- MicroStrategy Incorporated
- Oracle Corporation
- QLIK TECHNOLOGIES INC.
- SAP Se
- SAS Institute Inc.
- Tableauソフトウェア
- TIBCO ソフトウェア株式会社

アンキタは、テクノロジー、メディア、ICT、エレクトロニクス・半導体の各分野で8年以上の経験を持つ、ダイナミックな市場調査およびコンサルティングのプロフェッショナルです。Microsoft、Oracle、NEC、SAP、KPMG、Expeditors Internationalといったグローバルクライアントに対し、100件以上のコンサルティングおよび調査案件を主導・遂行してきました。彼女のコアコンピテンシーは、市場評価、データ分析、予測、戦略策定、競合情報、レポート作成です。
アンキタは、販売前の提案書作成やクライアントとの協議から、販売後の実用的なインサイトの提供まで、プロジェクトサイクル全体を巧みに管理することに長けています。彼女は、部門横断的なチームの管理、複雑な調査モジュールの構築、そしてクライアント固有のビジネス目標に合わせたソリューションの調整に長けています。優れたコミュニケーション能力、リーダーシップ、そしてプレゼンテーション能力により、急速に変化する市場環境において、常に価値主導の成果を生み出しています。
- 過去2年間の分析、基準年、CAGRによる予測(7年間)
- PEST分析とSWOT分析
- 市場規模価値/数量 - 世界、地域、国
- 業界と競争環境
- Excel データセット
お客様の声
Insight PartnersのSCADAシステム市場レポートは包括的で、現在のトレンドと将来の予測に関する貴重な洞察が含まれています。チームは終始、非常にプロフェッショナルで、対応が早く、サポートも充実していました。私たちは彼らのサービスに非常に満足しており、強くお勧めします。
ラン・ケデム パートナー, レアリテクノロジーズ株式会社非常に特殊なソフトウェア市場に関するレポートを依頼したところ、チームは数日でレポートを作成してくれました。情報は非常に関連性が高く、分かりやすくまとめられていました。その後、レポートにいくつか修正と追加を依頼しましたが、チームは非常に迅速に対応し、1週間も経たないうちに最終レポートを受け取ることができました。
ジャン=エルヴェ・ジェン 会長, フューチャー・アナリティカ重要な市場調査と予測のために、The Insight Partnersと協力しました。彼らは機会とリスクに関する明確な洞察を提供し、私たちの計画策定に役立ちました。彼らの調査は使いやすく、確かなデータに基づいており、賢明で自信に満ちた意思決定に役立ちました。彼らを強くお勧めします。
ピユーシュ・ナグパル 上級副社長, ハイビームグローバルInsight Partnersは、深い専門知識に基づき、洞察力に富み、構造化された市場調査を提供しました。チームは終始プロフェッショナルで、対応力も抜群でした。ユーザーフレンドリーなウェブサイトにより、業界レポートへのアクセスもスムーズでした。信頼性の高い高品質な調査サービスをお探しなら、Insight Partnersを強くお勧めします。
安達幸彦 最高経営責任者(CEO), ディープブルーLLC。The Insight Partnersから市場レポートを購入するのは今回が初めてです。最初は不安でしたが、ウェブサイトを見て、リスクを負ってでも購入してみようという気持ちになりました。レポートの品質とカスタマーサービスには大変満足しています。最初のレポートにはいくつか質問やコメントがありましたが、アナリストとメールで何度かやり取りした結果、戦略策定プロセスへのインプットとして活用できるレポートが完成しました。貴重なお時間を割いていただき、貴重な体験をさせていただき、誠にありがとうございました。他の方にもぜひお勧めしたいですし、今後さらに市場データが必要になった際には、まずThe Insight Partnersにご連絡させていただきます。
ジョン・スズキ 社長兼最高経営責任者、取締役, BKテクノロジーズナイジェリアの感染症IVD市場に関する情報提供依頼に対し、ご対応いただいた際、ご尽力とプロフェッショナルな姿勢に深く感謝申し上げます。忍耐強く、的確なアドバイスをいただき、また、最終的に取引成立に至った割引のご提供にも深く感謝申し上げます。今回の最初の出会いで得た強い印象のおかげで、今後もThe Insight Partnersとの連携を心待ちにしております。
チジオケ博士 オニア マネージングディレクター, パインクレストヘルスケア株式会社購入理由
- 情報に基づいた意思決定
- 市場動向の理解
- 競合分析
- 顧客インサイト
- 市場予測
- リスク軽減
- 戦略計画
- 投資の正当性
- 新興市場の特定
- マーケティング戦略の強化
- 業務効率の向上
- 規制動向への対応


 無料サンプルを入手 - ビジュアルアナリティクス市場