Marktbericht zur visuellen Analyse 2025 nach Segmenten, Geografie, Dynamik, jüngsten Entwicklungen und strategischen Erkenntnissen
Historische Daten : 2015-2016 | Basisjahr : 2017 | Prognosezeitraum : 2018-2025Markt für visuelle Analysen bis 2025 – Globale Analysen und Prognosen nach Bereitstellungsmodell (vor Ort und in der Cloud); Geschäftsfunktion (Vertrieb und Marketing, Betrieb, Finanzen, Lieferkette, Informationstechnologie, CRM und Personalwesen); Vertikal (Einzelhandel und Konsumgüter, IT und Telekommunikation, BFSI, Fertigung, Energie und Versorgung, Gesundheitswesen und Regierung)
- Status : Veröffentlicht
- Berichtscode : TIPTE100000740
- Kategorie : Technologie, Medien und Telekommunikation
- Anzahl der Seiten : 154
- Verfügbare Berichtsformate :


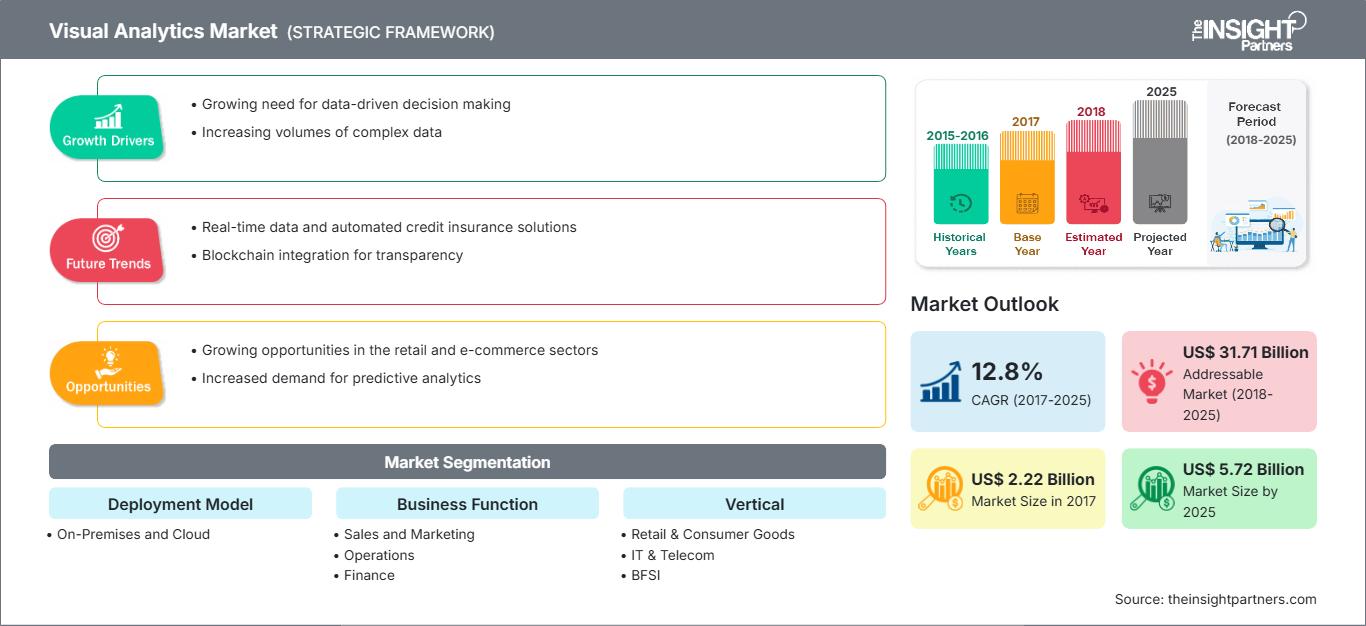
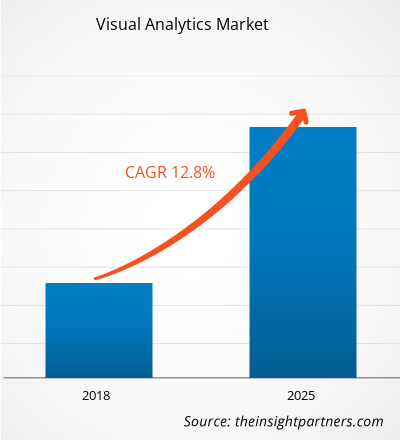
[Forschungsbericht]Der Markt für visuelle Analytik wurde im Jahr 2017 auf 2.215,0 Millionen US-Dollar geschätzt und soll bis 2025 voraussichtlich 5.718,6 Millionen US-Dollar erreichen. Im Prognosezeitraum 2017 bis 2025 wird für den Markt für visuelle Analytik eine durchschnittliche jährliche Wachstumsrate (CAGR) von 12,8 % erwartet.
Das übergeordnete Ziel von Visual-Analytics-Lösungen besteht darin, Visualisierung mit interaktiver Analyse zu kombinieren, um große Datensätze zu untersuchen. Mit anderen Worten ist Visual Analytics die Wissenschaft des analytischen Denkens, die durch interaktive visuelle Schnittstellen ermöglicht wird. Genauer gesagt ist Visual Analytics ein iterativer Prozess, der Informationsbeschaffung, Datenvorverarbeitung, Wissensdarstellung, Interaktion und Entscheidungsfindung umfasst. Das ultimative Ziel besteht darin, Einblick in das vorliegende Problem zu gewinnen, das durch riesige Mengen wissenschaftlicher, forensischer oder geschäftlicher Daten aus heterogenen Quellen beschrieben wird. Um dieses Ziel zu erreichen, kombiniert Visual Analytics die Stärken von Maschinen mit denen des Menschen. Einerseits sind Methoden der Wissensentdeckung in Datenbanken (KDD), Statistik und Mathematik die treibende Kraft auf der Seite der automatischen Analyse, während andererseits die menschlichen Fähigkeiten zur Wahrnehmung, Verknüpfung und Schlussfolgerung visuelle Analytik zu einem sehr vielversprechenden Forschungsfeld machen. Heutzutage reicht Datenvisualisierung allein nicht mehr aus und die Unternehmen freuen sich auf datengesteuerte Analysefunktionen, die in ihre Datenvisualisierung integriert sind. Visuelle Analytik kann als die Bildung intellektueller visueller Metaphern kombiniert mit manueller Informationsinteraktion erklärt werden.
Der Markt für visuelle Analytik wurde auf Basis von Bereitstellungsmodell, Geschäftsfunktion und Branche segmentiert. Basierend auf dem Bereitstellungsmodell wurde der Markt für visuelle Analytik in On-Premises und Cloud segmentiert. Basierend auf der Geschäftsfunktion wurde der Markt für visuelle Analytik in Vertrieb und Marketing, Betrieb, Finanzen, Lieferkette, Informationstechnologie, CRM und Personalwesen segmentiert. Der Markt ist weiter auf Basis von Branchen segmentiert in Einzelhandel und Konsumgüter, IT und Telekommunikation, BFSI, Fertigung, Energie und Versorgung, Gesundheitswesen und Regierung. Geografisch ist der Markt in fünf Regionen fragmentiert, darunter Nordamerika, Europa, Asien-Pazifik, Naher Osten und Afrika sowie Südamerika.
Passen Sie diesen Bericht Ihren Anforderungen an
Sie erhalten kostenlos Anpassungen an jedem Bericht, einschließlich Teilen dieses Berichts oder einer Analyse auf Länderebene, eines Excel-Datenpakets sowie tolle Angebote und Rabatte für Start-ups und Universitäten.
Markt für visuelle Analysen: Strategische Einblicke
-
Holen Sie sich die wichtigsten Markttrends aus diesem Bericht.Dieses KOSTENLOSE Beispiel umfasst Datenanalysen, die von Markttrends bis hin zu Schätzungen und Prognosen reichen.
Der größte Trend, der heute Innovationen in der Datenvisualisierung und -analyse beeinflusst, ist die Verbreitung von künstlicher Intelligenz (KI) und maschinellem Lernen. Auch wenn es für IT-Abteilungen und Analysten, die die menschliche Kontrolle nur ungern abgeben, beängstigend klingen mag, werden Analyseplattformen mit KI- und ML-Funktionen modernen Analysten tatsächlich als äußerst effektive Assistenten dienen. Während die Sorge vor einer Ersetzung bestehen mag, wird maschinelles Lernen Analysten tatsächlich voranbringen und sie effizienter, präziser und wirkungsvoller für das Unternehmen machen. Anstatt die Technologie des maschinellen Lernens zu fürchten, sollten Sie die Chancen nutzen, die sie bietet.
Markteinblicke basierend auf Bereitstellungsmodellen
Visual Analytics umfasst Cloud- und On-Premise-Bereitstellungsmodelle. Das Bereitstellungsmodell für Visual Analytics ist eine wichtige Entscheidung für ein bestimmtes Modell. Unternehmen bevorzugen je nach verschiedenen Faktoren sowohl die Cloud- als auch die On-Premise-Bereitstellung. Viele KMU bevorzugen aufgrund der günstigen Preise die Cloud-basierte visuelle Analyse als optimale Bereitstellungsmethode.
Geschäftsfunktionsbasierte Markteinblicke
Ein Paradigmenwechsel in den Geschäftsansätzen hat zu steigenden Anforderungen an die Integration verschiedener Analysesoftware in die Geschäftsprozesse verschiedener Branchen weltweit und insbesondere in den fortgeschrittenen Regionen geführt. Die heutigen Geschäftsanwender haben sich von den herkömmlichen Techniken der Datenverwaltung, -verarbeitung und -analyse weiterentwickelt. Verschiedene Geschäftsfunktionen in einem bestimmten Sektor erfordern die Analyse von Daten für unterschiedliche Zwecke.
Vertikalbasierte Markteinblicke
Die grundlegende Funktion jedes visuellen Analysetools besteht darin, komplexe Daten zu erfassen und sie dem Benutzer auf eine interaktive und leicht verständliche Weise zu präsentieren. Visuelle Analysetools müssen zwei wichtige Aufgaben erfüllen: die Visualisierung und anschließende Analyse der Daten. Eine einfache Visualisierung reicht nicht aus, um große Datenmengen zu vereinfachen. Benutzerfreundlichkeit dieser Tools, Kosteneffizienz, die Möglichkeit der Anpassung von Visual-Analytics-Tools, interaktive Benutzeroberflächen, Dashboards und Filteroptionen sind einige der Parameter, die Endbenutzern bei der Auswahl eines bestimmten Visual-Analytics-Tools für ihre Geschäftsfunktion helfen.
Akteure im Visual-Analytics-Markt konzentrieren sich auf Strategien wie Marktinitiativen, Akquisitionen und Produkteinführungen, um ihre Position im Visual-Analytics-Markt zu behaupten. Einige Entwicklungen der wichtigsten Akteure des Visual-Analytics-Marktes sind:
Im September 2018 stellte TIBCO A(X) Experience für TIBCO Spotfire vor, das visuelle Analysen von Datenströmen in Echtzeit ermöglicht und so Erkenntnisse und Maßnahmen in Echtzeit ermöglicht.
Im September 2018 stellte SAP SE die SAP Analytics Cloud vor, eine einfache Cloud für alle Analysen. Diese analytische Cloud bietet ihren Kunden eine All-in-One-Integration von Datenvisualisierung, Prognose- und Planungsfunktionen.
Regionale Einblicke in den Markt für visuelle Analysen
Die Analysten von The Insight Partners haben die regionalen Trends und Faktoren, die den Visual Analytics-Markt im Prognosezeitraum beeinflussen, ausführlich erläutert. In diesem Abschnitt werden auch die Marktsegmente und die geografische Lage in Nordamerika, Europa, dem asiatisch-pazifischen Raum, dem Nahen Osten und Afrika sowie Süd- und Mittelamerika erörtert.
Umfang des Marktberichts zur visuellen Analyse
| Berichtsattribut | Einzelheiten |
|---|---|
| Marktgröße in 2017 | US$ 2.22 Billion |
| Marktgröße nach 2025 | US$ 5.72 Billion |
| Globale CAGR (2017 - 2025) | 12.8% |
| Historische Daten | 2015-2016 |
| Prognosezeitraum | 2018-2025 |
| Abgedeckte Segmente |
By Bereitstellungsmodell
|
| Abgedeckte Regionen und Länder |
Nordamerika
|
| Marktführer und wichtige Unternehmensprofile |
|
Dichte der Marktteilnehmer im Bereich Visual Analytics: Verständnis ihrer Auswirkungen auf die Geschäftsdynamik
Der Markt für Visual Analytics wächst rasant. Die steigende Nachfrage der Endnutzer ist auf Faktoren wie veränderte Verbraucherpräferenzen, technologische Fortschritte und ein stärkeres Bewusstsein für die Produktvorteile zurückzuführen. Mit der steigenden Nachfrage erweitern Unternehmen ihr Angebot, entwickeln Innovationen, um den Bedürfnissen der Verbraucher gerecht zu werden, und nutzen neue Trends, was das Marktwachstum weiter ankurbelt.
- Holen Sie sich die Markt für visuelle Analysen Übersicht der wichtigsten Akteure
- On-Premise
- Cloud
Markt für visuelle Analysen – nach Geschäftsfunktion
- Vertrieb und Marketing
- Betrieb
- Finanzen
- Lieferkette
- Informationstechnologie
- CRM
- Personalwesen
- Sonstige
Markt für visuelle Analysen – nach Branchen
- Einzelhandel und Konsumgütermarkt
- IT und Telekommunikation
- BFSI
- Fertigung
- Energie und Versorgung
- Sonstige
- Gesundheitswesen
- Behörden
Markt für visuelle Analysen – nach Geografie
-
Nordamerika
- USA
- Kanada
- Mexiko
-
Europa
- Frankreich
- Deutschland
- Spanien
- Großbritannien
- Italien
-
Asien-Pazifik (APAC)
- China
- Indien
- Japan
- Australien
-
MEA
- Saudi-Arabien
- VAE
- Südafrika
-
SAM
- Brasilien
Markt für visuelle Analyse – Unternehmensprofile: ADVIZOR Solutions, Inc., Alteryx, Inc Inc.

Ankita ist eine dynamische Marktforschungs- und Beratungsexpertin mit über 8 Jahren Erfahrung in den Bereichen Technologie, Medien, IKT sowie Elektronik und Halbleiter. Sie hat über 100 Beratungs- und Forschungsaufträge für globale Kunden wie Microsoft, Oracle, NEC Corporation, SAP, KPMG und Expeditors International erfolgreich geleitet und durchgeführt. Zu ihren Kernkompetenzen gehören Marktbewertung, Datenanalyse, Prognose, Strategieformulierung, Wettbewerbsbeobachtung und das Verfassen von Berichten. Ankita ist versiert in der Abwicklung kompletter Projektzyklen – von der Angebotserstellung vor dem Verkauf und Kundengesprächen bis hin zur Bereitstellung umsetzbarer Erkenntnisse nach dem Verkauf. Sie ist versiert in der Leitung funktionsübergreifender Teams, der Strukturierung komplexer Forschungsmodule und der Ausrichtung von Lösungen an kundenspezifischen Geschäftszielen. Ihre ausgezeichneten Kommunikationsfähigkeiten, Führungsqualitäten und Präsentationsfähigkeiten haben es ihr ermöglicht, in einem schnelllebigen und sich entwickelnden Marktumfeld stets wertorientierte Ergebnisse zu liefern.
- Historische Analyse (2 Jahre), Basisjahr, Prognose (7 Jahre) mit CAGR
- PEST- und SWOT-Analyse
- Marktgröße Wert/Volumen – Global, Regional, Land
- Branchen- und Wettbewerbslandschaft
- Excel-Datensatz
Erfahrungsberichte
Der SCADA-Systemmarktbericht von Insight Partners ist umfassend und bietet wertvolle Einblicke in aktuelle Trends und Zukunftsprognosen. Das Team war durchweg hochprofessionell, reaktionsschnell und hilfsbereit. Wir sind sehr zufrieden und können die Dienstleistungen wärmstens empfehlen.
RAN KEDEM Partner, Reali Technologies LTDsIch habe einen Bericht über einen sehr spezifischen Softwaremarkt angefordert, und das Team hat ihn innerhalb weniger Tage erstellt. Die Informationen waren sehr relevant und gut präsentiert. Anschließend habe ich einige Änderungen und Ergänzungen zum Bericht angefordert. Das Team reagierte erneut sehr schnell, und ich erhielt den Abschlussbericht in weniger als einer Woche.
JEAN-HERVE JENN Vorsitzende, Future AnalyticaWir haben mit The Insight Partners für eine wichtige Marktstudie und Prognose zusammengearbeitet. Sie gaben uns klare Einblicke in Chancen und Risiken, die uns bei der Gestaltung unserer Pläne halfen. Ihre Recherchen waren benutzerfreundlich und basierten auf soliden Daten. Sie halfen uns, kluge und sichere Entscheidungen zu treffen. Wir können sie wärmstens empfehlen.
PIYUSH NAGPAL Sr. Vizepräsident, Fernlicht GlobalDie Insight Partners lieferten aufschlussreiche, gut strukturierte Marktforschung mit fundierter Fachkompetenz. Ihr Team war durchweg professionell und reaktionsschnell. Die benutzerfreundliche Website ermöglichte den Zugriff auf Branchenberichte. Wir empfehlen sie wärmstens für zuverlässige und hochwertige Forschungsdienstleistungen.
YUKIHIKO ADACHI Geschäftsführer, Deep Blue, LLC.Dies ist das erste Mal, dass ich einen Marktbericht von The Insight Partners erworben habe. Obwohl ich zunächst unsicher war, besuchte ich die Website und fühlte mich dann sicherer, das Risiko einzugehen und einen Marktbericht zu kaufen. Ich bin mit der Qualität des Berichts und dem Kundenservice rundum zufrieden. Ich hatte einige Fragen und Anmerkungen zum ersten Bericht, aber nach einigen E-Mail-Gesprächen mit dem Analysten bin ich überzeugt, dass ich einen Bericht habe, den ich als Input für unseren strategischen Planungsprozess verwenden kann. Vielen Dank, dass Sie sich die Zeit genommen und dies zu einer positiven Erfahrung gemacht haben. Ich werde Ihren Service auf jeden Fall weiterempfehlen und Sie werden meine erste Anlaufstelle sein, wenn wir weitere Marktdaten benötigen.
JOHN SUZUKI Präsident und Chief Executive Officer, Vorstandsmitglied, BK TechnologiesIch möchte mich für Ihre Unterstützung und die Professionalität bedanken, die Sie bei der Bearbeitung meiner Informationsanfrage zum IVD-Markt für Infektionskrankheiten in Nigeria gezeigt haben. Ich schätze Ihre Geduld, Ihre Beratung und die Tatsache, dass Sie bereit waren, einen Rabatt anzubieten, der uns schließlich den Abschluss eines Geschäfts ermöglichte. Ich freue mich darauf, The Insight Partners in Zukunft wieder zu beauftragen, dank des Eindrucks, den Sie bei dieser ersten Begegnung bei mir hinterlassen haben.
DR. CHIJIOKE ONYIA GESCHÄFTSFÜHRERIN, PineCrest Healthcare Ltd.Grund zum Kauf
- Fundierte Entscheidungsfindung
- Marktdynamik verstehen
- Wettbewerbsanalyse
- Kundeneinblicke
- Marktprognosen
- Risikominimierung
- Strategische Planung
- Investitionsbegründung
- Identifizierung neuer Märkte
- Verbesserung von Marketingstrategien
- Steigerung der Betriebseffizienz
- Anpassung an regulatorische Trends


Exklusive Berichtsrabatte freischalten
Jetzt anfragen


 Kostenlose Probe anfordern für - Markt für visuelle Analysen