2G & 3G Switch Off Market Key Players and Forecast by 2030
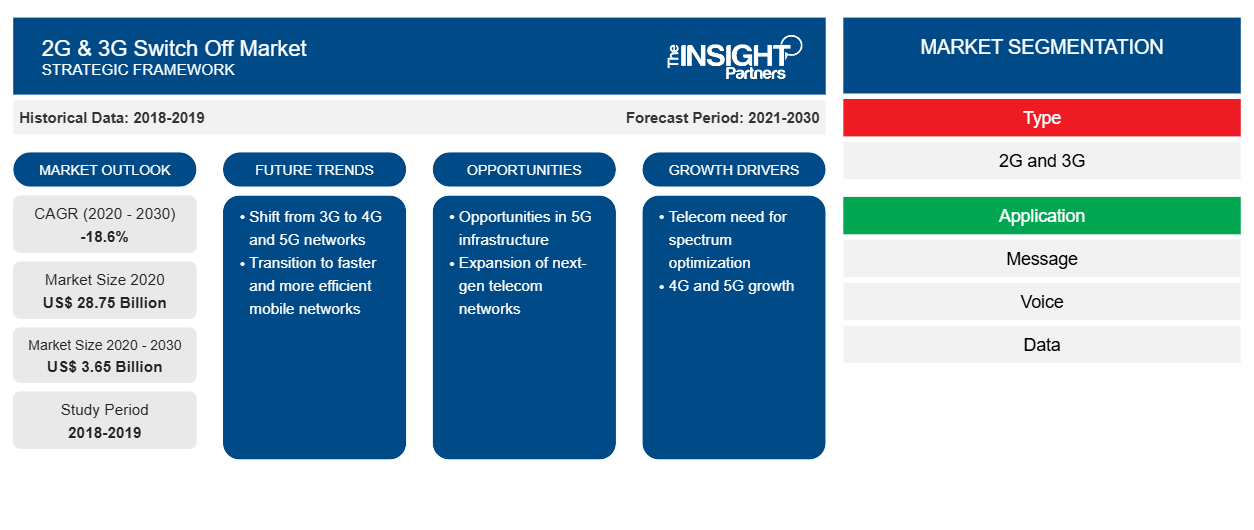
Historic Data: 2018-2019 | Base Year: 2020 | Forecast Period: 2021-20302G & 3G Switch Off Market Size and Forecasts (2020 - 2030), Global and Regional Share, Trends, and Growth Opportunity Analysis Report Coverage: By Type (2G and 3G) and Application (Message, Voice, Data, and IoT)
- Report Date : Dec 2023
- Report Code : TIPTE100000785
- Category : Technology, Media and Telecommunications
- Status : Published
- Available Report Formats :


- No. of Pages : 151
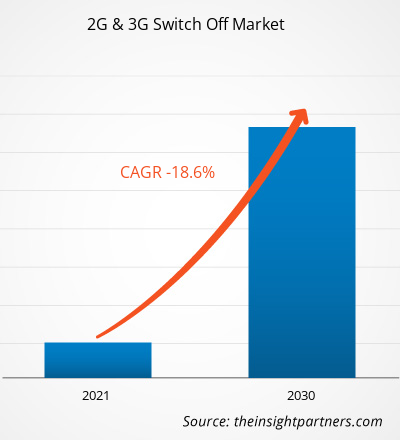
[Research Report] The 2G & 3G switch off market size was valued at US$ 28.75 billion in 2020 and is expected to decline to US$ 3.65 billion by 2030; it is estimated to record a CAGR of -18.6% from 2020 to 2030.
2G & 3G Switch Off Market - Analyst Perspective:
The rapid expansion of 5G has encouraged mobile network operators (MNOs) to shut down their 2G and 3G networks and repurpose them for 5G deployments. It is strongly fueling 2G & 3G switch off market growth. Several present smart home devices, such as home security and smart meters, communicate on 2G and 3G networks. Home security systems often use a 3G backup communicator to contact a monitoring center for events such as power failure or unwarranted tampering with wires. 2G and 3G are IoT and machine-to-machine (M2M) devices because they are more cost-effective than 4G modules. Additionally, the speed of 4G is not relevant for IoT or M2M devices that send minimal amounts of data. Cellular IoT devices are always networked, and their capability to transmit data via mobile communications stems from M2M subscriber identification module (SIM) cards that maintain a perpetual roaming state. It allows them to utilize the mobile networks of different operators and autonomously switch from one connection to another to maintain continual connectivity. Thus, the slower 2G and 3G connections are still fast enough for today’s standards. Therefore, sunsetting 2G and 3G networks results in limited connectivity options for IoT devices that depend on 2G or 3G M2M Subscriber Identity Module (SIM) cards.
Industrial IoT devices are expected to be affected more than residential IoT devices as the present 5G rollout and the eminent rollout of 6G in the future require the sunsetting of older technologies. Cellular connectivity plays an extensive role in industrial IoT (IIoT). Organizations require constant connections over diverse geographic areas in verticals such as agriculture, manufacturing, energy, retail, healthcare, and logistics. Cellular becomes critical when the devices are constantly mobile, fixed in remote areas, or deployed on demand. In contrast, most modern smart home devices are connected via the home Wi-Fi network. Thus, the sunsetting of 2G and 3G is anticipated to have minimal impact on smart home/connected building applications. For instance, the national rollout of smart metering in the UK strongly depends on 2G-based M2M connections. According to the statistics from the UK government, a total of 3.6 million smart meters were installed in domestic properties in 2022, an increase of 4% from 2021. Thus, 3G is being shut down (anticipated to be completed by 2025) before 2G (anticipated to be completed by 2033) in the UK, also fueling 2G & 3G switch off market growth. However, for any new device rollout globally, device manufacturers are required to take into consideration the eminent sunset of 4G soon after 2G and 3G. For instance, Sprint LTE networks were switched off on June 30, 2022.
Customize This Report To Suit Your Requirement
You will get customization on any report - free of charge - including parts of this report, or country-level analysis, Excel Data pack, as well as avail great offers and discounts for start-ups & universities
2G & 3G Switch Off Market: Strategic Insights
- Get Top Key Market Trends of this report.This FREE sample will include data analysis, ranging from market trends to estimates and forecasts.
2G & 3G Switch Off Market Overview:
There are a plethora of devices and services that rely on older-generation networks and have been impacted by the 2G/3G sunsetting. These include personal health reporting, home security, automation of industrial equipment, real-time performance, and autonomous operations. Many of the devices used in these sectors will be in service for decades. For example, many new cars manufactured in the last decade, some even recently in the year 2021, were built with connected services running on 3G. These include location data, emergency call services, Wi-Fi hotspots, remote lock/unlock functions, voice assistants, smartphone app connectivity, and even concierge services. In addition, the SOS system and roadside alerts are network-based features that can also be affected. Vehicles released before 2019 by Toyota, Lexus, Nissan, and Hyundai are susceptible to this sunset.
Security systems often run over cellular networks. At the start of 2016, 3G networks became the standard communication technology used in security panels. As traditional copper landlines were being retired, there was a shift to wireless security systems that use cellular technology to transmit messages. If an installed alarm system is based on a 3G-compatible communicator, it will no longer work properly once carriers begin to sundown 3G networks, regardless of the security provider. In such cases, the cellular communicator will need to be replaced to operate on the new networks.
Several network operators across the globe have announced that they will phase out 2G and 3G by 2023, thus fueling 2G & 3G switch off market growth. For instance, in Europe, where this transition is most prominent, Orange, one of the latest operators to adopt the trend, as of August 2022, announced that legacy 2G and 3G will be gradually phased out from 2025 to 2030.
2G & 3G Switch Off Market Driver:
Emergence of 5G Technology Fuels 2G & 3G Switch Off Market Growth
Emerging 5G networks feature higher capacity, lower latency, and increased bandwidth than 4G. These network enhancements are expected to impact how people work, live, and play worldwide. According to Intel Corporation, 5G will provide up to 1,000 times more capacity than 4G, paving the way for IoT development. 5G and IoT are a great combination, which has the potential to reshape wireless networks and the way the Internet is utilized. With the ability to effortlessly communicate with hundreds or thousands of devices, new applications and use cases for cities, factories, farms, schools, and households will flourish. The transition to 5G could be the most significant growth engine for the smartphone industry in the coming years. The advancement of 5G-based mobile networks achieves low delays, which opens the way to new opportunities, including virtual reality experiences, multiplayer mobile gaming, factory robots, and self-driving car applications for which a speedy response is considered a strong criterion. Thus, due to the huge advantages of 5G technology, several countries are adopting it, driving the growth of the 2G & 3G switch off market.
2G & 3G Switch Off Market Segmental Analysis:
The 2G & 3G switch off market is categorized on the basis of type and application. Based on type, the 2G & 3G switch off market is bifurcated into 2G and 3G. The 3G segment held a larger market share in 2020, whereas the 2G segment is declining faster. In terms of application, the market is segmented into message, voice, data, and IoT. The IoT segment is decelerating at the fastest pace as industries are shifting to 5G-enabled devices. By geography, the 2G & 3G switch off market is segmented into North America, Europe, Asia Pacific (APAC), the Middle East & Africa (MEA), and South America (SAM). APAC is adopting 5G at the fastest pace and has a faster-declining rate of 2G & 3G switch off market.
Operators are shutting down 2G and 3G networks to free up 4G and 5G frequency bands thereby fueling 2G & 3G switch off market. However, installing higher-speed networks such as 4G and 5G requires certain infrastructure, including spectrum, site, and fiber; these infrastructure installations are quite costly. Deploying 5G base stations involves substantial upfront costs for acquiring land or rooftop space, purchasing and installing equipment, obtaining permits, and ensuring power supply and backhaul connectivity. These costs can be a barrier for both telecom operators and governments. Telecom operators must participate in costly spectrum auctions to acquire the necessary frequency bands for 5G. These auction costs add to the overall infrastructure expenditure.
5G networks require denser base station deployment due to their shorter range and higher frequency bands. Hence, more base stations are needed to cover the same area, increasing infrastructure costs. Despite the same, owing to the advantages of 5G, it is being adopted at a tremendous pace, replacing 2G and 3G technologies. The adoption rate of 5G subscriptions is increasing in developing countries such as India, China, Malaysia, Mexico, South Africa, and Brazil, and leading to 2G & 3G switch off market growth.
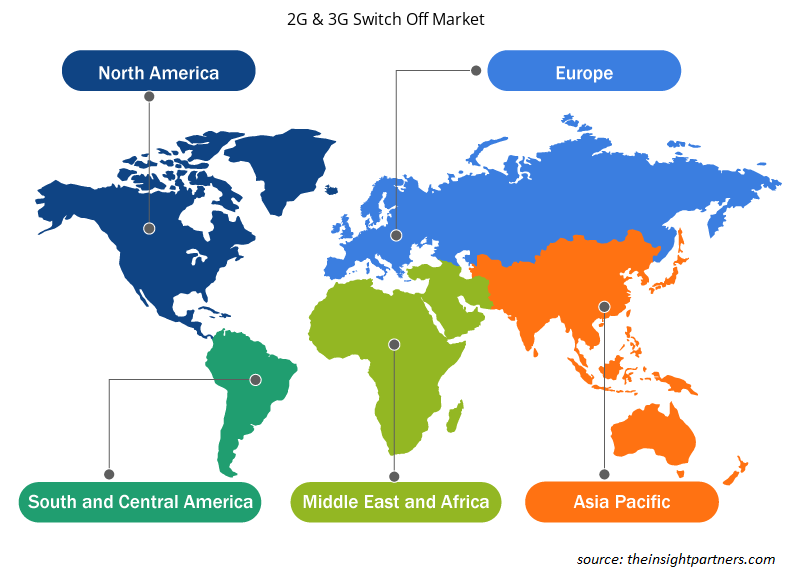
2G & 3G Switch Off Market Regional Analysis:
The APAC 2G & 3G switch off market size was valued at US$ 3.71 billion in 2020 and is projected to reach US$ 0.11 billion by 2030; it is expected to record a CAGR of -29.4% from 2022 to 2030. The APAC 2G & 3G switch off market is segmented into Australia, India, China, Japan, South Korea, and the Rest of APAC. According to the ISG, a global technology research and IT advisory firm, 29 operators in APAC are estimated to sunset their 2G/3G networks by 2025. India plans to sunset 2G by the end of 2023. Vodafone will sunset its 2G in 2022, while Japan declared a nationwide 2G sunset in 2012. All such instances promote 2G & 3G switch off market growth.
Several regional operators are switching off the 2G and 3G networks, positively impacting 2G & 3G switch off market growth. For instance, as of February 2021, Vodafone Idea Ltd (VIL), the telecom operator providing services under the “Vi” brand, completely shut down 3G services across all its circles in India by the financial year 2022 and moved to 4G. The network operator is ready to provide 5G. Thus, several shutdowns of 2G and 3G networks in the region will promote the 2G & 3G switch off market.
2G & 3G Switch Off Market Key Player Analysis:
AT&T Inc, BCE Inc, China Mobile Ltd, Deutsche Telekom AG, KDDI Corp, NTT Data Corp, Orange SA, Telefonica SA, Telenor ASA, and Vodafone Group Plc are among the key 2G & 3G switch off market players profiled during this study. In addition, several other essential 2G & 3G switch off market players were also studied and analyzed to get a holistic view of the global 2G & 3G switch off market and its ecosystem.
2G & 3G Switch Off 2G & 3G Switch Off Market Regional Insights
The regional trends and factors influencing the 2G & 3G Switch Off Market throughout the forecast period have been thoroughly explained by the analysts at Insight Partners. This section also discusses 2G & 3G Switch Off Market segments and geography across North America, Europe, Asia Pacific, Middle East and Africa, and South and Central America.
- Get the Regional Specific Data for 2G & 3G Switch Off Market
2G & 3G Switch Off Market Report Scope
| Report Attribute | Details |
|---|---|
| Market size in 2020 | US$ 28.75 Billion |
| Market Size by 2030 | US$ 3.65 Billion |
| Global CAGR (2020 - 2030) | -18.6% |
| Historical Data | 2018-2019 |
| Forecast period | 2021-2030 |
| Segments Covered |
By Type
|
| Regions and Countries Covered | North America
|
| Market leaders and key company profiles |
2G & 3G Switch Off Market Players Density: Understanding Its Impact on Business Dynamics
The 2G & 3G Switch Off Market is growing rapidly, driven by increasing end-user demand due to factors such as evolving consumer preferences, technological advancements, and greater awareness of the product's benefits. As demand rises, businesses are expanding their offerings, innovating to meet consumer needs, and capitalizing on emerging trends, which further fuels market growth.
Market players density refers to the distribution of firms or companies operating within a particular market or industry. It indicates how many competitors (market players) are present in a given market space relative to its size or total market value.
Major Companies operating in the 2G & 3G Switch Off Market are:
- AT&T Inc
- BCE Inc
- China Mobile Ltd
- Deutsche Telekom AG
- KDDI Corp
Disclaimer: The companies listed above are not ranked in any particular order.
- Get the 2G & 3G Switch Off Market top key players overview
2G & 3G Switch Off Market Recent Developments:
- In December 2023, O2 Slovakia announced plans to steadily phase out its 3G network starting January 2024, citing decreasing usage and focus on modern 4G and 5G technologies. The company will begin switching off the 3G network in designated areas of Slovakia at the end of January 2024, progressively extending the shutdown across the country over the next two years. O2 noted that the usage of 3G has diminished significantly, reaching a minimal level presently due to the advent of 4G and 5G technologies.
- In July 2023, Singtel, StarHub, and M1 unveiled plans to shut down their 3G networks in Singapore from July 31, 2024, with all three to repurpose the spectrum to improve 5G services. In a joint statement, the operators noted they have been pressing 3G customers to migrate to 4G or 5G services in recent years and plan to implement measures in the coming months to help users shift to other networks.
Frequently Asked Questions
What is the incremental growth of the global 2G & 3G switch off market during the forecast period?
The incremental growth expected to be recorded for the global 2G & 3G switch off market during the forecast period is US$ -17.09 billion.
What is the estimated market size for the global 2G & 3G switch off market in 2022?
The global 2G & 3G switch off market was estimated to be US$ 28.75 billion in 2020 and is expected to decline at a CAGR of -18.6% till 2030.
What will be the market size of the global 2G & 3G switch off market by 2030?
The global 2G & 3G switch off market is expected to reach US$ 3.65 billion by 2030.
Which are the key players operating in the global 2G & 3G switch off market?
The key players in the global 2G & 3G switch off market are AT&T Inc, BCE Inc, China Mobile Ltd, Deutsche Telekom AG, KDDI Corp, NTT Data Corp, Orange SA, Telefonica SA, Telenor ASA, and Vodafone Group Plc.
What are the future trends of the global 2G & 3G switch off market?
Government regulations to shut down 2G and 3G is anticipated to play a significant role in the global 2G & 3G switch off market in the coming years.
What are the driving factors impacting the global 2G & 3G switch off market?
The emergence of 5G technology, increasing adoption of industry 4.0 and edge computing are the major factors that propel the global 2G & 3G switch off market.

Market Research & Consulting
- Historical Analysis (2 Years), Base Year, Forecast (7 Years) with CAGR
- PEST and SWOT Analysis
- Market Size Value / Volume - Global, Regional, Country
- Industry and Competitive Landscape
- Excel Dataset
- Parking Meter Apps Market
- eSIM Market
- Advanced Distributed Management System Market
- Online Exam Proctoring Market
- Electronic Data Interchange Market
- Barcode Software Market
- Maritime Analytics Market
- Cloud Manufacturing Execution System (MES) Market
- Robotic Process Automation Market
- Digital Signature Market
Testimonials
I wish to appreciate your support and the professionalism you displayed in the course of attending to my request for information regarding to infectious disease IVD market in Nigeria. I appreciate your patience, your guidance, and the fact that you were willing to offer a discount, which eventually made it possible for us to close a deal. I look forward to engaging The Insight Partners in the future, all thanks to the impression you have created in me as a result of this first encounter.
DR CHIJIOKE ONYIA, MANAGING DIRECTOR, PineCrest Healthcare Ltd.The Insight Partners delivered insightful, well-structured market research with strong domain expertise. Their team was professional and responsive throughout. The user-friendly website made accessing industry reports seamless. We highly recommend them for reliable, high-quality research services
Yukihiko Adachi CEO, Deep Blue, LLC.Reason to Buy
- Informed Decision-Making
- Understanding Market Dynamics
- Competitive Analysis
- Customer Insights
- Market Forecasts
- Risk Mitigation
- Strategic Planning
- Investment Justification
- Identifying Emerging Markets
- Enhancing Marketing Strategies
- Boosting Operational Efficiency
- Tracking Industry Innovations
- Aligning with Regulatory Trends
Yes! We provide a free sample of the report, which includes Report Scope (Table of Contents), report structure, and selected insights to help you assess the value of the full report. Please click on the "Download Sample" button or contact us to receive your copy.
Absolutely — analyst assistance is part of the package. You can connect with our analyst post-purchase to clarify report insights, methodology or discuss how the findings apply to your business needs.
Once your order is successfully placed, you will receive a confirmation email along with your invoice.
• For published reports: You’ll receive access to the report within 4–6 working hours via a secured email sent to your email.
• For upcoming reports: Your order will be recorded as a pre-booking. Our team will share the estimated release date and keep you informed of any updates. As soon as the report is published, it will be delivered to your registered email.
We offer customization options to align the report with your specific objectives. Whether you need deeper insights into a particular region, industry segment, competitor analysis, or data cut, our research team can tailor the report accordingly. Please share your requirements with us, and we’ll be happy to provide a customized proposal or scope.
The report is available in either PDF format or as an Excel dataset, depending on the license you choose.
The PDF version provides the full analysis and visuals in a ready-to-read format. The Excel dataset includes all underlying data tables for easy manipulation and further analysis.
Please review the license options at checkout or contact us to confirm which formats are included with your purchase.
Our payment process is fully secure and PCI-DSS compliant.
We use trusted and encrypted payment gateways to ensure that all transactions are protected with industry-standard SSL encryption. Your payment details are never stored on our servers and are handled securely by certified third-party processors.
You can make your purchase with confidence, knowing your personal and financial information is safe with us.
Yes, we do offer special pricing for bulk purchases.
If you're interested in purchasing multiple reports, we’re happy to provide a customized bundle offer or volume-based discount tailored to your needs. Please contact our sales team with the list of reports you’re considering, and we’ll share a personalized quote.
Yes, absolutely.
Our team is available to help you make an informed decision. Whether you have questions about the report’s scope, methodology, customization options, or which license suits you best, we’re here to assist. Please reach out to us at sales@theinsightpartners.com, and one of our representatives will get in touch promptly.
Yes, a billing invoice will be automatically generated and sent to your registered email upon successful completion of your purchase.
If you need the invoice in a specific format or require additional details (such as company name, GST, or VAT information), feel free to contact us, and we’ll be happy to assist.
Yes, certainly.
If you encounter any difficulties accessing or receiving your report, our support team is ready to assist you. Simply reach out to us via email or live chat with your order information, and we’ll ensure the issue is resolved quickly so you can access your report without interruption.


The List of Companies - 2G and 3G Switch Off Market
- AT&T Inc
- BCE Inc
- China Mobile Ltd
- Deutsche Telekom AG
- KDDI Corp
- NTT Data Corp
- Orange SA
- Telefonica SA
- Telenor ASA
- Vodafone Group Plc


 Get Free Sample For