Australia Building Analytics Market Key Players and Opportunities by 2027
Historic Data: 2016-2017 | Base Year: 2018 | Forecast Period: 2019-2027Australia Building Analytics Market to 2027 - Country Analysis and Forecasts by Deployment Type, Component, Building Type, and Application
- Report Date : May 2019
- Report Code : TIPRE00004659
- Category : Technology, Media and Telecommunications
- Status : Published
- Available Report Formats :


- No. of Pages : 103
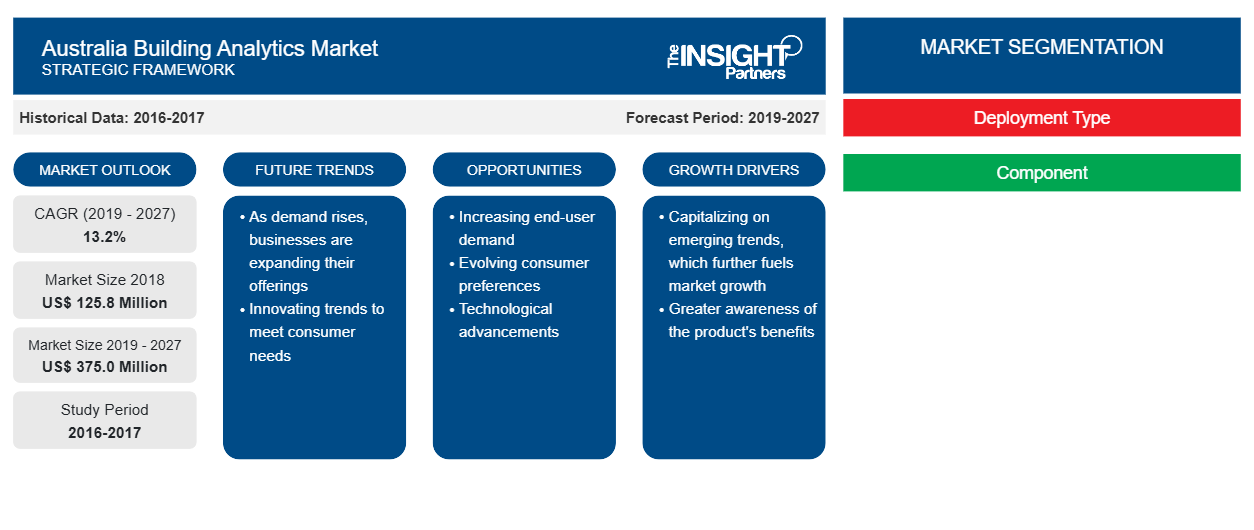
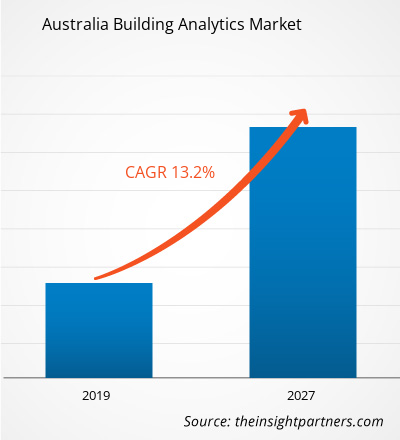
The Australia building analytics market accounted to US$ 125.8 Mn in 2018 and is expected to grow at a CAGR of 13.2% during the forecast period 2019 - 2027, to account to US$ 375.0 Mn by 2027.
The government of the country targets to escalate 40% energy productivity by 2030 through the execution of strategies included under the National Energy Productivity Plan. These strategies comprise of reduction in total energy use in buildings, improvement in the national construction code, as well as encouraging the adoption of energy-efficient equipment. Moreover, the rising adoption of various energy efficiency based solutions and service has further propelled the Australia building analytics market demand for the energy management based building analytics solutions.
Australia Building Analytics Market

- This FREE sample will include data analysis, ranging from market trends to estimates and forecasts.
Australia Building Analytics Market Insights
Increasing deployment of facility management tools driving the Australia Building Analytics Market
Facility management has gained immense adoption during the past few years as organizations have recognized that well-maintained utilities and buildings are essential for effective and efficient business function. Facility management involves analysis of day-to-day operations, maintenance, and repair of the utilities owned by a company, which results in cost-savings and increased employee productivity. Further, a facility manager is required to make sure that all the amenities in an organization are compliant with industry safety and health regulation, the building should have fire security and emergency exit strategy in place, maintenance of car parking and various other facilities. Also, regular electric and mechanical repairs together with property maintenance are a part of facility management. For helping a business to attain a competitive advantage as well as to increase employee productivity, organizations across the globe as adopting facility management tools.
The deployment of facility management tools has resulted in increased adoption of IoT enabled smart, connected devices, which creates a huge amount of data. Thus, with the increasing amount of data, facility managers are leveraging business analytics platform to understand the pattern of operations better. This helps them to gain insights on the exact situation and enable them to quickly diagnose issues and implement solutions to eradicate further damage/loss. Above factors are driving the Australia building analytics market.
Advantages related to predictive maintenance is propelling the Australia Building Analytics Market
Engineering, procurement, and construction companies; equipment manufacturers; as well as power and process plant owners and operators generally face the issue of maintaining their machinery, fleet, and other assets to work efficiently along with reducing the maintenance cost and time-complex repairs. It is essential to identify the basis of probable faults or failures before they occur, to meet the time-to-market requirement for products. Evolving technologies such as Big Data, IoT, and machine learning are allowing more production line assets to send data to a centralized server thus, resulting in easier detection of faults.
It is a complicated task to gather operational data from multiple systems as well as remote sources during the management of large fleets spread across numerous sites. Presently, most of the utilities make use of real-time historians for consolidating multiple data sources to attain a comprehensive insight into asset performance. On the basis of the data gathered, predictive analytics solutions can utilize the historian data to further enhance operations by reporting early warning detection of asset issues before they result in failure. The companies are significantly investing in predictive maintenance programs including, deployment of predictive analytics software for the purpose of achieving higher operational efficiency.
The emergence of advanced technologies such as building analytics has resulted in ensuring that all the required information is available and can be compared with other data sources quickly and accurately. Adoption of building analytics enable companies to implement predictive analytics to enhance operational performance. These factors are leading the Australia building analytics market.
Australia Building Analytics Market - Deployment Type Insights
The Australia building analytics market by deployment type has been segmented into cloud and on premise. Clouds are larger in size when compared to on-premise deployment type, due to which enterprise associated with cloud are benefitted with seamless, on-demand scalability. The cloud deployment model is ideal for organizations which are willing to adopt analytics solutions with low investment. It mainly allows the company to procure the data with all their services, but on an economical expense. In building analytics market, on- premise segment is leading as it provides a huge benefit for buildings by enabling it to preserve all their processes and current internal systems, such as authentication and access privileges.

- This FREE sample will include data analysis, ranging from market trends to estimates and forecasts.
Australia Building Analytics Market - Component Insights
The Australia building analytics market is segmented on basis of component such as software and services. The analytics software offers a prosperous opportunities to the companies operating in building analytics industry. As the building analytics industry continues to shift towards the cloud based operation from on–premises, majority of its process are anticipated to be catered as a service such as maintenance, software updates, and analysis reports among others. Furthermore, with the increasing competition and highly regulated environment, the companies operating in the analytics industry are implementing analytical capabilities for efficiently competing in the market place. This factor has led the end users to adopt the latest technology increasingly leading the Australia building analytics market to escalate at a prime growth rate over the years from 2018 to 2027 globally.
Australia Building Analytics Market - Building Type Insights
The deployment of building analytics platform in different types of building depends on varied applications demanded by the infrastructure and nature. As for example, fault detection and monitoring is one of the major application used by manufacturing facilities; and energy management is extensively used by commercial and residential buildings. By building type, the Australia building analytics market is segmented into manufacturing facilities, commercial building, residential building, public places, and government building. In Australia building analytics market, manufacturing facilities holds largest market share in the year 2019. Deployment of analytics in the manufacturing facilities enable the companies to monitor all the manufacturing processes in real-time and helps the facility manager to act in order to prevent failure, optimize field service, as well as vigorously reallocate production resources on time in case of any faults or changes.
Australia Building Analytics Market - Application Insights
The Australia building analytics market by application has been segmented into fault detection & monitoring facilities, security management, energy management, emergency management, parking management, operations management, network management, and others. In building analytics market, energy management accounts for largest market share in the year 2019 as the energy management analytics provides several benefits, which includes, lower energy costs due to reduced energy consumption, lower maintenance costs due to efficient use of mechanical equipment, identification of opportunities with constant support & guidance for facility managers, enhanced occupant comfort, and autonomous measurement and authentication of energy conservation measures.
Australia Building Analytics Market -
Customize This Report To Suit Your Requirement
You will get customization on any report - free of charge - including parts of this report, or country-level analysis, Excel Data pack, as well as avail great offers and discounts for start-ups & universities
Australia Building Analytics Market: Strategic Insights
-
Get Top Key Market Trends of this report.This FREE sample will include data analysis, ranging from market trends to estimates and forecasts.
Merger and acquisition was observed as the most adopted strategy in Australia Building Analytics market. Few of the recent mergers and acquisitions are listed below;
2018: Building IQ announced acquisition of Buildingsense. The acquisition is aimed to provide intelligent building services to more than thirty building across Australia.
2018: CopperTree acquired BuildPulse an energy management startup. According to the agreement BuildPulse would keep its office in Seattle and work under the CopperTree brand.
AUSTRALIA BUILDING ANALYTICS MARKET –SEGMENTATION
Australia Building Analytics by Deployment Type
- Cloud Based
- On premise
Australia Building Analytics by Component
- Software
- Service
Australia Building Analytics by Building Type
- Manufacturing Facilities
- Residential Building
- Commercial Building
- Public Places
- Government Building
Australia Building Analytics by Application
- Fault Detection & Monitoring Facilities
- Energy Management
- Security Management
- Emergency Management
- Parking Management
- Operations Management
- Network Management
- Others
Company Profiles
- Bueno
- Buildingiq, Inc.
- Buildings alive
- Cim enviro
- CopperTree analytics
- Delta Electronics
- ENGIE Insight Services Inc.
- Envizi
- Honeywell International, Inc.
- Johnson Controls International plc.
- Schneider electric se
- Skyfoundary
Australia Building Analytics Market Report Scope
| Report Attribute | Details |
|---|---|
| Market size in 2018 | US$ 125.8 Million |
| Market Size by 2027 | US$ 375.0 Million |
| CAGR (2019 - 2027) | 13.2% |
| Historical Data | 2016-2017 |
| Forecast period | 2019-2027 |
| Segments Covered | By Deployment TypeBy ComponentBy Building TypeBy Application |
| Regions and Countries Covered |
Australia
|
| Market leaders and key company profiles |
|
Australia Building Analytics Market Players Density: Understanding Its Impact on Business Dynamics
The Australia Building Analytics Market is growing rapidly, driven by increasing end-user demand due to factors such as evolving consumer preferences, technological advancements, and greater awareness of the product's benefits. As demand rises, businesses are expanding their offerings, innovating to meet consumer needs, and capitalizing on emerging trends, which further fuels market growth.
- Get the Australia Building Analytics Market top key players overview

- Historical Analysis (2 Years), Base Year, Forecast (7 Years) with CAGR
- PEST and SWOT Analysis
- Market Size Value / Volume - Regional, Country
- Industry and Competitive Landscape
- Excel Dataset
Recent Reports
Testimonials
The Insight Partners' SCADA System Market report is comprehensive, with valuable insights on current trends and future forecasts. The team was highly professional, responsive, and supportive throughout. We are very satisfied and highly recommend their services.
RAN KEDEM Partner, Reali Technologies LTDsI requested a report on a very specific software market and the team produced the report in a few days. The information was very relevant and well presented. I then requested some changes and additions to the report. The team was again very responsive and I got the final report in less than a week.
JEAN-HERVE JENN Chairman, Future AnalyticaWe worked with The Insight Partners for an important market study and forecast. They gave us clear insights into opportunities and risks, which helped shape our plans. Their research was easy to use and based on solid data. It helped us make smart, confident decisions. We highly recommend them.
PIYUSH NAGPAL Sr. Vice President, High Beam GlobalThe Insight Partners delivered insightful, well-structured market research with strong domain expertise. Their team was professional and responsive throughout. The user-friendly website made accessing industry reports seamless. We highly recommend them for reliable, high-quality research services
YUKIHIKO ADACHI CEO, Deep Blue, LLC.This is the first time I have purchased a market report from The Insight Partners.While I was unsure at first, I visited their web site and felt more comfortable to take the risk and purchase a market report.I am completely satisfied with the quality of the report and customer service. I had several questions and comments with the initial report, but after a couple of dialogs over email with their analyst I believe I have a report that I can use as input to our strategic planning process.Thank you so much for taking the extra time and making this a positive experience.I will definitely recommend your service to others and you will be my first call when we need further market data.
JOHN SUZUKI President and Chief Executive Officer, Board Director, BK TechnologiesI wish to appreciate your support and the professionalism you displayed in the course of attending to my request for information regarding to infectious disease IVD market in Nigeria. I appreciate your patience, your guidance, and the fact that you were willing to offer a discount, which eventually made it possible for us to close a deal. I look forward to engaging The Insight Partners in the future, all thanks to the impression you have created in me as a result of this first encounter.
DR CHIJIOKE ONYIA MANAGING DIRECTOR, PineCrest Healthcare Ltd.Reason to Buy
- Informed Decision-Making
- Understanding Market Dynamics
- Competitive Analysis
- Identifying Emerging Markets
- Customer Insights
- Market Forecasts
- Risk Mitigation
- Boosting Operational Efficiency
- Strategic Planning
- Investment Justification
- Tracking Industry Innovations
- Aligning with Regulatory Trends


 Get Free Sample For