
Cone Beam Computed Tomography Market Size and Competitive Analysis by 2028
Cone Beam Computed Tomography Market Forecast to 2028 - Analysis By Type (Standing, Sitting, and Supine), Application (Dental, ENT, Breast Cancer, Orthopedic, Skull Base, and Others), and End User (Hospitals & Clinics, Diagnostic Centers, and Others)
- Status : Published
- Report Code : TIPRE00002889
- Category : Life Sciences
- No. of Pages : 199
- Available Report Formats :


- Last update date : June 13, 2024

2022 Market Size
US$ 1.21 Bn
Base year value
2028 Forecast
US$ 2.28 Bn
Projected by 2028
CAGR 2023-2028
11.1 %
Growth rate
Addressable Market
US$ 10.66 Bn
(2023-2028)
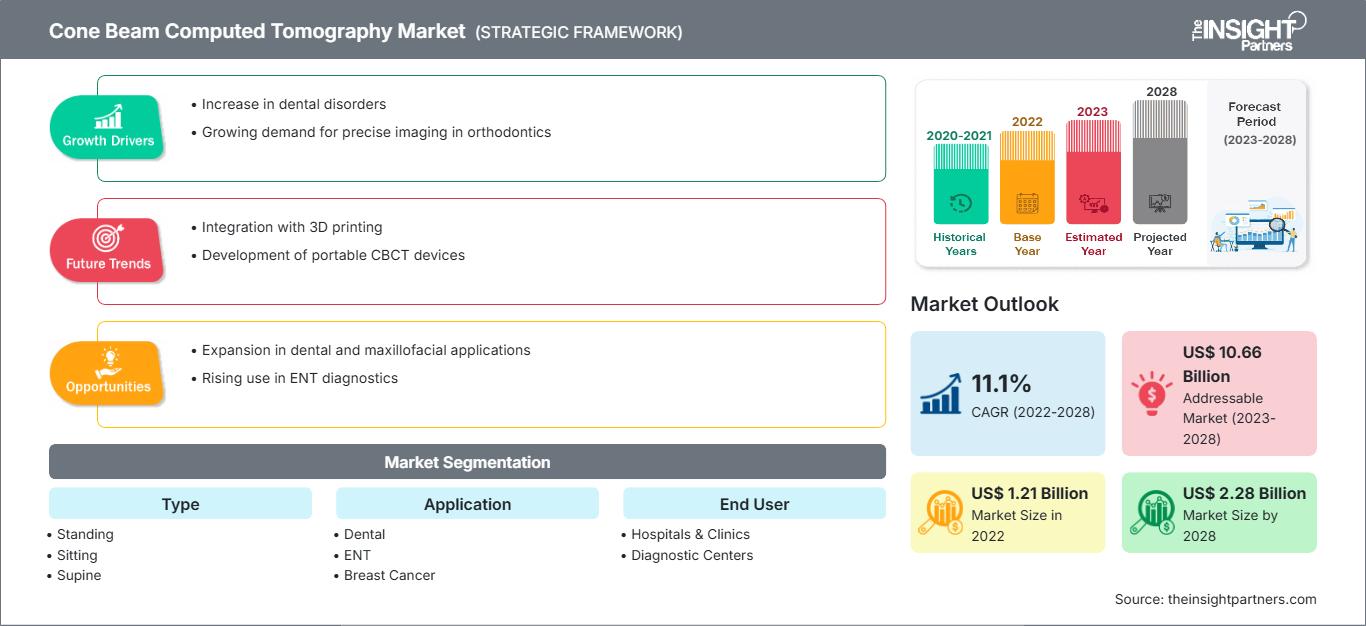
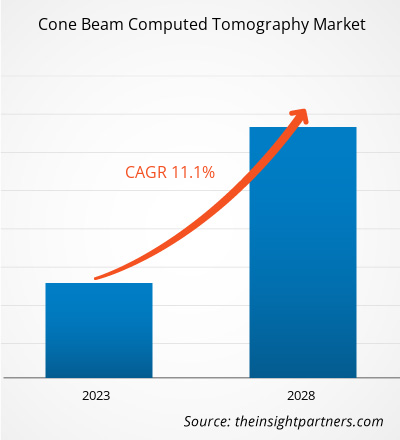
The cone beam computed tomography market is expected to reach US$ 2,278.41 million by 2028 from US$ 1,214.51 million in 2022; it is estimated to grow at a CAGR of 11.1% from 2022 to 2028.
Cone beam computed tomography is a modification of the traditional computed tomography (CT) system. The cone beam computed tomography systems used by dental professionals rotate around the patient, capturing data using a cone-shaped X-ray beam. These data are used to reconstruct a three-dimensional image of the dental (teeth); oral and maxillofacial region (mouth, jaw, and neck); and ears, nose, and throat.
The cone beam computed tomography market is segmented based on type, application, end user, and geography. Based on geography, the market is broadly segmented into North America, Europe, Asia Pacific, the Middle East & Africa, and South & Central America. The report offers insights and in-depth analysis of the market, emphasizing on market trends, technological advancements, and market dynamics. It also offers an analysis of the competitive landscape of the world's leading market players.
Market Research Highlights
- North America dominated the market with 39.5% share in 2021.
- Asia Pacific is poised to grow at a CAGR of 11.6% over the forecast period.
- United States market is projected to grow at a CAGR of 11.4% over the forecast period.
- By Type, the Standing segment accounted for the largest market share of 64.3% in 2021.
- By Application, the ENT segment is anticipated to witness the fastest growth, registering a CAGR of 11.9% over the forecast period
- By Dental Application, the Dental Implantology segment accounted for the largest market share of 27.1% in 2021.
- By End User, the Diagnostic Center segment is anticipated to witness the fastest growth, registering a CAGR of 11.6% over the forecast period
- The report profiles key industry players such as Dentsply Sirona Inc, Vatech Co., Ltd., Carestream Dental LLC., Canon Medical Systems Corp, IDETEC MEDICAL IMAGING, Brainlab AG, Newtom, Fussen Group, PreXion, Planmeca Oy, while also analyzing key developments in novel ideas, disruptive products, and innovative services that could reshape the future market and reveal emerging themes across the industry.
● REPORT CUSTOMIZATION
Tailor This Report To Align With Your Specific Business Requirements
This report can be customized to align precisely with your business objectives, scope, and target markets. Customization options include tailored segmentation, geography, competitive analysis, and strategic insights to support informed decision-making.
Customize This Report →WHAT YOU CAN ADJUST
- ● Segmentations
- ● Geography
- ● Competitive Analysis
- ● Language Preferences
Cone Beam Computed Tomography Market: Strategic Insights
-
Get Top Key Market Trends of this report.This FREE sample will include data analysis, ranging from market trends to estimates and forecasts.
Market Insights
Integration of Software Tools into CBCT Devices Boosts Market Growth
By integrating software tools into CBCT systems, users can automate and standardize complex diagnostic procedures, improve patient experience and diagnostic outcomes, and reduce the cost of care, along with improving the functionality of CBCT systems. Analyzing and interpreting CBCT scan data can be challenging, even for experienced clinical professionals. The software systems have been developed to offer dental laboratories, dentists, implant specialists, and surgeons maximum flexibility and precision. Software integration with CBCT would help physicians expand the scope of diagnosis and improve visibility into patients’ underlying anatomical structures during treatment planning. The integration of picture archiving and communication systems (PACS) with CBCT systems helps capture and edit camera images, share images via the cloud, and provide efficient treatment planning. PACS is a medical imaging technology primarily used for storing and securely transmitting digital electronic images. It allows doctors in different locations to review the same data simultaneously. Digital health companies are investing in developing software for CBCT systems. Therefore, the integration of CBCT devices with software tools to simplify data analysis, interpretation, and archival is contributing to the growth of the cone beam computed tomography market.
Technological Advancements and R&D to Bring New Trends in CBCT Market
Technological advancements, particularly in digital imaging systems, have led to improvements in diagnostic and surgical procedures. This can be attributed to the ability of advanced imaging systems to provide detailed information to healthcare providers while reducing patients’ exposure to radiation. With CBCT techniques, dentists have gained the ability to collect more data with lower doses of radiation. Earlier, physicians relied on two-dimensional imaging for diagnosis and treatment planning. However, 2D technology often requires multiple exposures. Therefore, 3D scanning has gained greater popularity in diagnostics.
A few of the advancements related to the CBCT market are mentioned below:
- In March 2019, Planmeca Oy introduced an advanced Planmeca Viso G5 into their Planmeca Viso family, which offers high CBCT image quality.
- In December 2021, RaySearch Laboratories AB introduced new features to Ray Station 11B for adaptive workflows, brachytherapy, and radiation therapy with ions. Ray Station 11B operates with the improved accuracy of dose calculation on daily images for photon therapy. Daily CBCTs provide a better representation of the patient’s anatomy at the time of treatment than any conventional CT, which is taken early in the process and used to plan the complete treatment.
- In April 2022, Carestream Dental launched the Neo Edition of CS 8200 3D Family, which made the CBCT scanning heavily intuitive. The Neo Edition is an evolved version of the CS 8200 3D, equipped with an optional Scan Ceph module that ensures ease of use, contributes to a better clinical experience, and leads to more successful outcomes. Practitioners that are already using the CS 8200 3D can easily upgrade to the new Neo Edition.
- In June 2022, Xoran Technologies received a patent for a modular cone beam computed tomography system assembly.
Thus, such technological advancements by various market players are likely to bring new trends to the cone beam computed tomography market in the coming years.
End user Insights
Based on end user, the cone beam computed tomography market is divided into hospitals & clinics, diagnostic centers, and others. The hospitals & clinics segment held the largest share of the market in 2021, and the diagnostic centers segment is expected to register the highest CAGR during the forecast period. Diagnostic laboratories are equipped with full-service imaging facilities that provide the highest quality, comprehensive screening and diagnostics services to patients. Diagnostic centers have all the modern imaging modalities, such as CT scans, ultrasound, X-ray, and mammography. On-site radiologists in these facilities provide patients with a complete examination, followed by handing over reports to them within a few hours. Advances in imaging technologies, leading to quick and accurate results in low turnaround time, and a surge in the demand for early disease diagnosis are the factors favoring the growth of the cone beam computed tomography market for the diagnostic laboratories segment.
Product launches and mergers and acquisitions are the highly adopted strategies by the players in the global cone beam computed tomography market. A few of the recent key product developments are listed below:
- In May 2021, the PreXion Corporation launched the latest model the PreXion 3D Explorer PRO. This iteration of the machine features an integrated cephalometric X-ray arm.
- In February 2021, Brainlab received an FDA clearance for the Loop-X Mobile Imaging Robot and the Cirq robotic surgical system. Following the CE mark approvals, Brainlab also received FDA clearance to launch these products into the US market. The Cirq is a robotic alignment module for spine procedures, and Loop-X is the first fully robotic intraoperative imaging device.
- In November 2022, Canon strengthened its medical business with the establishment of Canon Healthcare USA, INC. By strengthening its presence in the highly influential American medical market, Canon aims to accelerate the growth of its medical business.
In Asia Pacific, the COVID-19 pandemic severely affected China and India. These countries already have many patients suffering from chronic disorders. Healthcare professionals in these countries canceled elective procedures to combat the pandemic situation. Moreover, patients and their family members avoided visiting hospitals protect themselves from infections—instead, they opted for online consultation. This resulted in a tremendous decrease in diagnostic procedures performed for chronic disorders. On the other hand, a surge in COVID-19 cases triggered the demand for X-rays and cone beam computed tomography systems, which were in use for checking the spread of infection into the lungs. CBCT imaging is used in thoracic radiotherapy daily to check changes in patient positioning and anatomy prior to treatment through a qualitative assessment of the appearance of lungs by radiographers. Considering this, various market players from Asia Pacific have launched new and innovative products to ease the overall diagnostic procedures. Thus, the COVID-19 pandemic has had a moderately positive impact on the cone beam computed tomography market.
Cone Beam Computed Tomography Market Report Scope
| Report Attribute | Details |
|---|---|
| Market size in 2022 | US$ 1.21 Billion |
| Market Size by 2028 | US$ 2.28 Billion |
| Global CAGR (2022 - 2028) | 11.1% |
| Historical Data | 2020-2021 |
| Forecast period | 2023-2028 |
| Segments Covered |
By Type
|
| Regions and Countries Covered |
North America
|
| Market leaders and key company profiles |
|
Cone Beam Computed Tomography Market Players Density: Understanding Its Impact on Business Dynamics
The Cone Beam Computed Tomography Market is growing rapidly, driven by increasing end-user demand due to factors such as evolving consumer preferences, technological advancements, and greater awareness of the product's benefits. As demand rises, businesses are expanding their offerings, innovating to meet consumer needs, and capitalizing on emerging trends, which further fuels market growth.
Cone Beam Computed Tomography – Market Segmentation
Based on patient positioning, the cone beam computed tomography market is segmented into standing, sitting, and supine. By application, the market is segmented into dental, ENT, breast cancer, skull base, orthopedic, and others. In terms of end user, the cone beam computed tomography market is divided into hospitals & clinics, diagnostic centers, and others. Based on geography, the market is segmented into North America (US, Canada, and Mexico), Europe (France, Germany, UK, Spain, Italy, and Rest of Europe), Asia Pacific (China, India, Japan, Australia, South Korea, and Rest of APAC), Middle East & Africa (Saudi Arabia, UAE, South Africa, and Rest of MEA), and South & Central America (Brazil, Argentina, and Rest of South & Central America)
Company Profiles
- Dentsply Sirona Inc
- Newtom
- Carestream Dental LLC
- Fussen Group
- PreXion
- Brainlab AG
- IDETEC MEDICAL IMAGING
- Vatech Co., Ltd
- Planmeca Oy
- Canon Medical Systems
Frequently Asked Questions

- Comprehensive Market Sizing and Forecast Analysis
- Detailed Segmentation Analysis
- In-Depth Market Dynamics Assessment
- Regional and Country-Level Insights
- Competitive Landscape and Company Benchmarking
- Strategic Business Intelligence
Recent Reports
Testimonials
The Insight Partners' SCADA System Market report is comprehensive, with valuable insights on current trends and future forecasts. The team was highly professional, responsive, and supportive throughout. We are very satisfied and highly recommend their services.
RAN KEDEM Partner, Reali Technologies LTDsI requested a report on a very specific software market and the team produced the report in a few days. The information was very relevant and well presented. I then requested some changes and additions to the report. The team was again very responsive and I got the final report in less than a week.
JEAN-HERVE JENN Chairman, Future AnalyticaWe worked with The Insight Partners for an important market study and forecast. They gave us clear insights into opportunities and risks, which helped shape our plans. Their research was easy to use and based on solid data. It helped us make smart, confident decisions. We highly recommend them.
PIYUSH NAGPAL Sr. Vice President, High Beam GlobalThe Insight Partners delivered insightful, well-structured market research with strong domain expertise. Their team was professional and responsive throughout. The user-friendly website made accessing industry reports seamless. We highly recommend them for reliable, high-quality research services
YUKIHIKO ADACHI CEO, Deep Blue, LLC.This is the first time I have purchased a market report from The Insight Partners.While I was unsure at first, I visited their web site and felt more comfortable to take the risk and purchase a market report.I am completely satisfied with the quality of the report and customer service. I had several questions and comments with the initial report, but after a couple of dialogs over email with their analyst I believe I have a report that I can use as input to our strategic planning process.Thank you so much for taking the extra time and making this a positive experience.I will definitely recommend your service to others and you will be my first call when we need further market data.
JOHN SUZUKI President and Chief Executive Officer, Board Director, BK TechnologiesI wish to appreciate your support and the professionalism you displayed in the course of attending to my request for information regarding to infectious disease IVD market in Nigeria. I appreciate your patience, your guidance, and the fact that you were willing to offer a discount, which eventually made it possible for us to close a deal. I look forward to engaging The Insight Partners in the future, all thanks to the impression you have created in me as a result of this first encounter.
DR CHIJIOKE ONYIA MANAGING DIRECTOR, PineCrest Healthcare Ltd.Reason to Buy
- Informed Decision-Making
- Understanding Market Dynamics
- Competitive Analysis
- Identifying Emerging Markets
- Customer Insights
- Market Forecasts
- Risk Mitigation
- Boosting Operational Efficiency
- Strategic Planning
- Investment Justification
- Tracking Industry Innovations
- Aligning with Regulatory Trends


