
Direct Carrier Billing Market Outlook and Strategic Insights by 2031
Direct Carrier Billing Market Size and Forecast (2021–2031), Global and Regional Share, Trend, and Growth Opportunity Analysis Report Coverage: By Type (Limited DCB, Pure DCB, MSISDN Forwarding, and PIN or MO Base Window), Platform (iOS, Android, and Other Platforms), End User (Apps and Games, Online Media, and Other End Users), and Geography
Historic Data: 2021-2022 | Base Year: 2023 | Forecast Period: 2024-2031- Status : Data Released
- Report Code : TIPRE00004643
- Category : Technology, Media and Telecommunications
- No. of Pages : 150
- Available Report Formats :


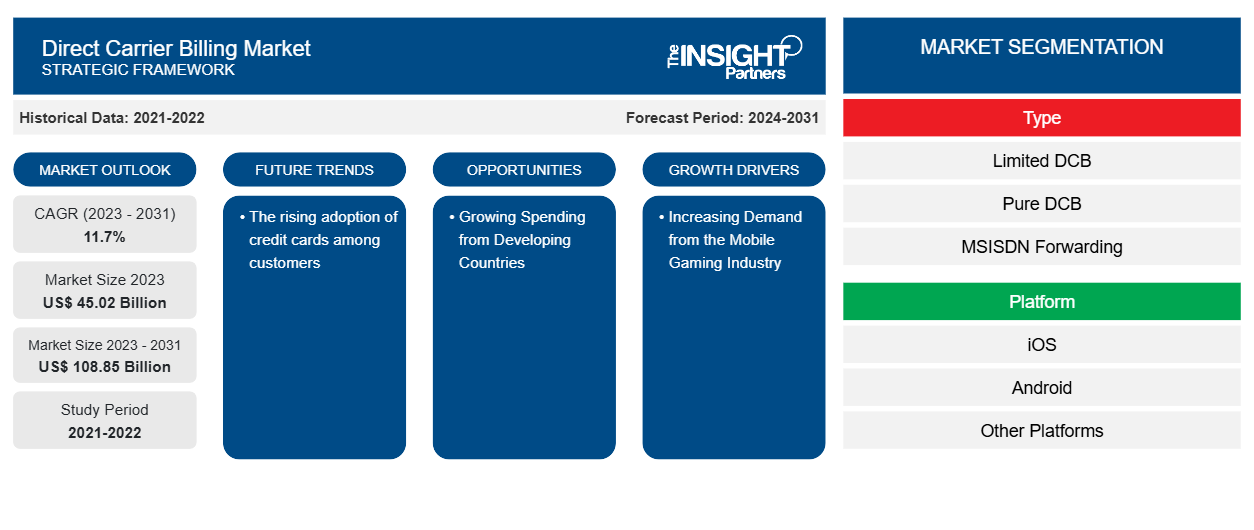
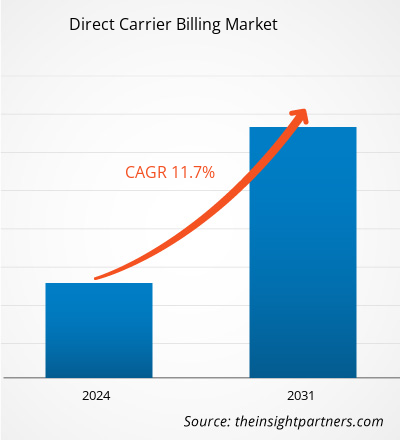
The Direct Carrier Billing Market size is projected to reach US$ 108.85 billion by 2031 from US$ 45.02 billion in 2023. The market is expected to register a CAGR of 11.7% in 2023–2031. The rising adoption of credit cards among customers will likely remain a key direct carrier billing market trend.
Direct Carrier Billing Market Analysis
The direct carrier billing market is growing rapidly due to the increasing demand from the mobile gaming industry and the growing requirement for digital content platforms such as YouTube, Netflix, Hotstar, and others among consumers. The market is expanding steadily, driven by growing smartphone penetration and high acceptance of OTT services. Moreover, the growing spending from developing countries is providing lucrative opportunities for market growth.
Direct Carrier Billing Market Overview
Direct carrier billing (DCB), also known as direct operator billing, is an online mobile payment method that allows customers to pay for items by using their smartphones. Customers make purchases by charging payments from their mobile phone carrier bills. These payment methods are accessible for all feature phones and smartphones. The user has to validate payment from a mobile with a SIM card. This technology allows customers to purchase goods and services from online stores that accept the direct carrier billing method. However, the availability of a wide range of direct carrier billing platforms assists mobile operators in generating significant revenue by providing updated content to the customers, boosting the market.
Customize This Report To Suit Your Requirement
Get FREE CUSTOMIZATIONDirect Carrier Billing Market: Strategic Insights
-
Get Top Key Market Trends of this report.This FREE sample will include data analysis, ranging from market trends to estimates and forecasts.
Direct Carrier Billing Market Drivers and Opportunities
Increasing Demand from the Mobile Gaming Industry
Direct carrier billing is transforming the fast-expanding mobile gaming industry, especially in terms of in-game sales. Gamers worldwide are buying game stuff, upgrading, and crediting with their phone bills instead of using payment cards or app store accounts. This seamless payment mechanism removes the necessity to search, enter, and validate their credit or debit card information, further supporting game producers to improve conversion rates and income is driving the market.
Growing Spending from Developing Countries – An Opportunity in the Direct Carrier Billing Market
Direct carrier billing plays a critical role in the distribution of digital content such as eBooks, music, movies, and apps. Increasing the use of direct carrier billing supports businesses to provide a simple payment solution, attracting users who are unwilling or unable to use traditional payment methods. Direct carrier billing is highly important for businesses that operate in countries or regions with a large number of unbanked potential customers. Moreover, the rising adoption of smartphones among consumers across the globe increases the demand for digital content, creating opportunities for direct carrier billing to offer content or access. Additionally, growing spending from developing countries such as France, India, South Korea, Mexico, Brazil, and South Africa, among others, is creating opportunities in the market. For instance, according to TELECOMING S.A. data published in July 2022, South Africans spent US$ 89 million for digital content and services via direct carrier billing in 2022 and are expected to increase their spending to US$ 159 million by 2026.
Direct Carrier Billing Market Report Segmentation Analysis
Key segments that contributed to the derivation of the direct carrier billing market analysis are type, platform, and end user.
- Based on type, the market is bifurcated into limited DCB, pure DCB, MSISDN forwarding, and PIN or MO base window. The pure DCB segment held a larger market share in 2023.
- In terms of platform, the market is divided into iOS, Android, and other platforms. The Android segment held a larger market share in 2023.
- based on end users, the market is segmented into apps and games, online media, and other end users. The apps and games segment held the largest share of the market in 2023.
Direct Carrier Billing Market Share Analysis by Geography
The geographic scope of the direct carrier billing market report is mainly divided into five regions: North America, Asia Pacific, Europe, Middle East & Africa, and South America/South & Central America.
In terms of revenue, North America accounted for the largest direct carrier billing market share, due to technological advancement and integration of blockchain technology for security purposes. Moreover, shifting consumers' presence towards the adoption of digital content platforms is driving the market. However, the rising demand for digital media platforms such as YouTube, Netflix, Hotstar, and others among consumers is fueling the market in North America.
Direct Carrier Billing Market Report Scope
| Report Attribute | Details |
|---|---|
| Market size in 2023 | US$ 45.02 Billion |
| Market Size by 2031 | US$ 108.85 Billion |
| Global CAGR (2023 - 2031) | 11.7% |
| Historical Data | 2021-2022 |
| Forecast period | 2024-2031 |
| Segments Covered |
By Type
|
| Regions and Countries Covered |
North America
|
| Market leaders and key company profiles |
|
Direct Carrier Billing Market Players Density: Understanding Its Impact on Business Dynamics
The Direct Carrier Billing Market is growing rapidly, driven by increasing end-user demand due to factors such as evolving consumer preferences, technological advancements, and greater awareness of the product's benefits. As demand rises, businesses are expanding their offerings, innovating to meet consumer needs, and capitalizing on emerging trends, which further fuels market growth.
Direct Carrier Billing Market News and Recent Developments
The direct carrier billing market is evaluated by gathering qualitative and quantitative data post primary and secondary research, which includes important corporate publications, association data, and databases. The following is a list of developments in the market for direct carrier billing and strategies:
- In September 2023, Informa Tech organized a Global Carrier Billing and Mobile Payments Summit 2023 taking place on September 19th and 20th in the Novotel Amsterdam City, located in the capital of the Netherlands. The show gathered telecom operators, merchants, and other key players of the DCB and payments industry under the same roof to address the current state of the market and future steps of the ever-growing ecosystem. The summit also addresses alternative payment methods and technological advances to developing partnerships and bringing awareness to the opportunities that DCB and Mobile Money present. (Source: Informa Tech, Press Release, 2023)
Direct Carrier Billing Market Report Coverage and Deliverables
The “Direct Carrier Billing Market Size and Forecast (2021–2031)” report provides a detailed analysis of the market covering below areas:
- Market size and forecast at global, regional, and country levels for all the key market segments covered under the scope
- Market dynamics such as drivers, restraints, and key opportunities
- Key future trends
- Detailed PEST/Porter’s Five Forces and SWOT analysis
- Global and regional market analysis covering key market trends, major players, regulations, and recent market developments
- Industry landscape and competition analysis covering market concentration, heat map analysis, prominent players, and recent developments
- Detailed company profiles
Frequently Asked Questions

- Historical Analysis (2 Years), Base Year, Forecast (7 Years) with CAGR
- PEST and SWOT Analysis
- Market Size Value / Volume - Global, Regional, Country
- Industry and Competitive Landscape
- Excel Dataset
Recent Reports
Testimonials
The Insight Partners' SCADA System Market report is comprehensive, with valuable insights on current trends and future forecasts. The team was highly professional, responsive, and supportive throughout. We are very satisfied and highly recommend their services.
RAN KEDEM Partner, Reali Technologies LTDsI requested a report on a very specific software market and the team produced the report in a few days. The information was very relevant and well presented. I then requested some changes and additions to the report. The team was again very responsive and I got the final report in less than a week.
JEAN-HERVE JENN Chairman, Future AnalyticaWe worked with The Insight Partners for an important market study and forecast. They gave us clear insights into opportunities and risks, which helped shape our plans. Their research was easy to use and based on solid data. It helped us make smart, confident decisions. We highly recommend them.
PIYUSH NAGPAL Sr. Vice President, High Beam GlobalThe Insight Partners delivered insightful, well-structured market research with strong domain expertise. Their team was professional and responsive throughout. The user-friendly website made accessing industry reports seamless. We highly recommend them for reliable, high-quality research services
YUKIHIKO ADACHI CEO, Deep Blue, LLC.This is the first time I have purchased a market report from The Insight Partners.While I was unsure at first, I visited their web site and felt more comfortable to take the risk and purchase a market report.I am completely satisfied with the quality of the report and customer service. I had several questions and comments with the initial report, but after a couple of dialogs over email with their analyst I believe I have a report that I can use as input to our strategic planning process.Thank you so much for taking the extra time and making this a positive experience.I will definitely recommend your service to others and you will be my first call when we need further market data.
JOHN SUZUKI President and Chief Executive Officer, Board Director, BK TechnologiesI wish to appreciate your support and the professionalism you displayed in the course of attending to my request for information regarding to infectious disease IVD market in Nigeria. I appreciate your patience, your guidance, and the fact that you were willing to offer a discount, which eventually made it possible for us to close a deal. I look forward to engaging The Insight Partners in the future, all thanks to the impression you have created in me as a result of this first encounter.
DR CHIJIOKE ONYIA MANAGING DIRECTOR, PineCrest Healthcare Ltd.Reason to Buy
- Informed Decision-Making
- Understanding Market Dynamics
- Competitive Analysis
- Identifying Emerging Markets
- Customer Insights
- Market Forecasts
- Risk Mitigation
- Boosting Operational Efficiency
- Strategic Planning
- Investment Justification
- Tracking Industry Innovations
- Aligning with Regulatory Trends
Unlock Exclusive Report Discounts
Enquire Now


 Get Free Sample For