
Interactive Tables Market Size, Demand & Growth by 2034
Coverage: by Technology (LCD, LED, Others); Screen Size (Below 40 Inch, 40-65 Inch, Above 65 Inch); End-user (Education, Retail, Hospitality, Enterprises, Transportation, Others) , and Geography (North America, Europe, Asia Pacific, and South and Central America)
- Status : Data Released
- Report Code : TIPRE00011668
- Category : Electronics and Semiconductor
- No. of Pages : 150
- Available Report Formats :


- Last update date : September 21, 2026


2025 Market Size
US$ 1.3 Bn
Base year value
2034 Forecast
US$ 2.4 Bn
Projected by 2034
CAGR 2026-2034
7.99 %
Growth rate
Addressable Market
US$ 17.52 Bn
(2026-2034)
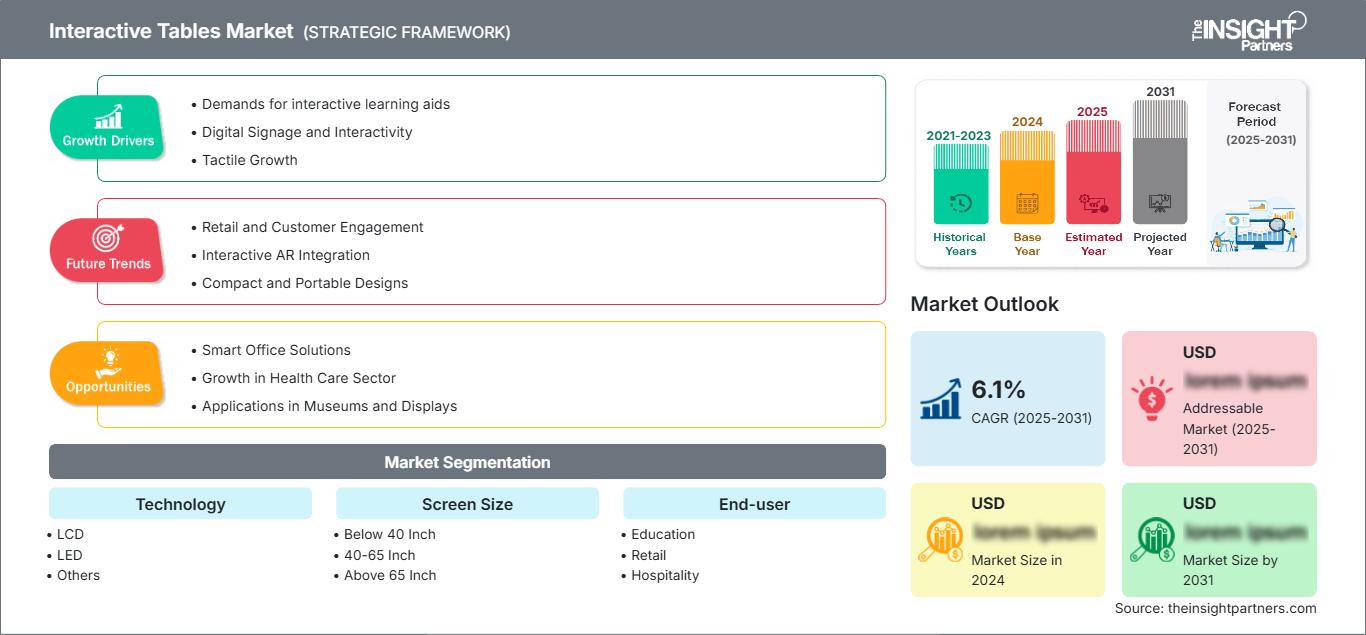
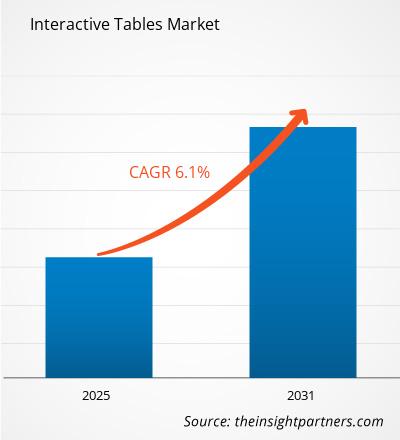
The Interactive Tables Market was valued at US$ 1.3 Billion in 2025 and is projected to reach US$ 2.4 Billion by 2034, expanding at a CAGR of 7.99% during 2026–2034. Interactive tables combine large-format displays, touch interfaces, computing hardware, and application software to support collaborative learning, product visualization, hospitality experiences, corporate presentations, exhibitions, and public information services.
North America remains a major technology adoption center, with the Interactive Tables Market size supported by digital education investment, sophisticated enterprise collaboration infrastructure, and strong demand for experiential retail and hospitality environments. The regional market is estimated to expand at a 7.0–8.0% CAGR through 2034, supported by replacement of conventional presentation systems and wider deployment of multi-user digital experiences.
Interactive Tables Market Assessment and Insights
- North America: North America held a 34.0% share in 2025 and is estimated to grow at a 7.0–8.0% CAGR between 2026–2034, supported by education digitization, enterprise collaboration, retail engagement, and established interactive-display infrastructure.
- US: The US represents approximately 82–86% of North American demand in 2025 and is estimated to expand at a 7.0–8.0% CAGR through 2034, supported by education and enterprise deployments.
- Europe: Europe accounted for a 20.0% share in 2025 and is projected to grow at a 7.5–8.5% CAGR between 2026–2034, with Germany, the UK, France, Italy, and Spain supporting education, hospitality, retail, and exhibition deployments.
- Asia Pacific: Asia Pacific is estimated at a 28.7% share in 2025 and is projected to grow at an 8.5–9.5% CAGR through 2034, led by China, Japan, South Korea, India, and Australia.
- Largest Segment: Education represents an estimated 30–32% market share in 2025 and is projected to grow at a 7.5–8.5% CAGR through 2034, supported by collaborative digital learning.
- High Growth Segment: Hospitality represents approximately 11–14% share in 2025 and is estimated to expand at a 9.5–10.5% CAGR, supported by interactive dining and guest engagement.
- Key companies analyzed in detail: eyefactive GmbH, Garamantis GmbH, Horizon Display, Inc., Ideum, Inc., Intermedia Touch, MMT GmbH & Co. KG, Sharp Corporation, TableConnect GmbH, U-TOUCH Ltd, Wingsys.
Source: The Insight Partners' analysis based on proprietary research, government publications, company annual reports, investor presentations, industry databases, and expert interviews.
The market has transitioned from traditional touchscreen furniture into complete digital environments comprising of multi-touch sensing, high-resolution displays, computer technology, object recognition, and custom-designed software applications. Large-sized LCDs continue to be commercially significant due to the need for balance between resolution, availability, durability, and cost. The manufacturers are increasingly incorporating optical bonding, toughened screens, enhanced thermal management capabilities, and multi-user interfaces to cater to challenging commercial deployments. The company Ideum, for instance, has expanded its line of hardware offerings with optically bonded displays and touch tables in 2025.
During the forecast period, the use will extend beyond educational and museum applications into hospitality, retail, transport, and enterprise experience centers. New markets could develop in emerging countries where investments in digital classrooms, smart business space, and customer engagement through experiences are being made. The energy-efficiency regulations of electronic displays in Europe could also drive procurement decisions of the supplier organizations.
Interactive Tables Market Report Scope
| Report Attribute | Details |
|---|---|
| Market size in 2025 | US$ 1.3 Billion |
| Market Size by 2034 | US$ 2.4 Billion |
| Global CAGR (2026 - 2034) | 7.99% |
| Historical Data | 2021-2024 |
| Forecast period | 2026-2034 |
Interactive Tables Market Analysis
The Interactive Tables Market growth is being driven by the demand for multi-user digital interaction in education, corporate collaboration, visualization in retail, hospitality, museums, and public information displays. These involve a range of vendors including display manufacturers, touch sensor manufacturers, computing solutions providers, software vendors, systems integrators, content providers, furniture manufacturers, and installers. Procurement is now looking at the entire offering and not just the display, with usability, reliability, content management, and system integration becoming important buying criteria.
The main source of demand continues to be education, since the ability to manipulate digital content by more than one student on an interactive surface offers unique learning opportunities. Retail establishments employ the technology for product cataloging, customization, visualization, and immersive marketing campaigns. Hospitality venues can make use of interactive surfaces for menu presentation, entertainment, ordering, and customer services. Hardware vendors will continue to be under pressure to deliver high levels of brightness, touch precision, thermal characteristics, and reliability at competitive prices.
Interactive Tables Market Report indicates that there is an oligopoly market structure characterized by specialized interactive tables competing against general display and digital experience companies. There are several players including; Ideum, eyefactive GmbH, Garamantis GmbH, TableConnect GmbH, and Intermedia Touch who are focused on developing custom multi-touch displays. Sharp Corporation, on the other hand, has large display formats as their focus.
Software capabilities, application customization, and installation services determine the competitive positioning. Garamantis combines multi-touch hardware with object recognition, people detection, LED lighting, customized software, and content management, indicating a move towards full experience systems. Similarly, Ideum integrates hardware, software, exhibit development, and fabrication services. This means that the competitive advantage lies not only in the components but also in the integration of the whole system and its use in various applications.
● REPORT CUSTOMIZATION
Tailor This Report To Align With Your Specific Business Requirements
This report can be customized to align precisely with your business objectives, scope, and target markets. Customization options include tailored segmentation, geography, competitive analysis, and strategic insights to support informed decision-making.
Customize This Report →WHAT YOU CAN ADJUST
- ● Segmentations
- ● Geography
- ● Competitive Analysis
- ● Language Preferences
Interactive Tables Market: Strategic Insights
Regional Insights
North America Interactive Tables Market
North America captured 34.0% market share in 2025 and will continue to grow at 7.0%-8.0% CAGR from 2025 to 2034. This region has advantages in education technology infrastructure, strong enterprise investment in collaboration environments, and adoption of digital engagement solutions. The US leads in the region in terms of the market size, while Canada has contributed to the market in education, museums, retail, and the public sector.
The Interactive Tables Market Share of the region is fueled by applications that require real-time interaction and high-quality visualization. Schools deploy touch tables for STEM learning, collaboration sessions, and engaging content, while retailers use them for product discovery and digital merchandising. Companies increasingly deploy large interactive surfaces in innovation centers, training rooms, and customer experience facilities. There is also replacement demand fueled by innovations in resolution, touch precision, optical bonding, and embedded computing.
U.S. Interactive Tables Market
The USA represents 82-86% of North America demand in 2025 and is forecast to grow at a 7.0-8.0% CAGR until 2034. Its mature education-technology industry facilitates classroom use, while enterprises use interactive tables for collaborative design, presentation, training, and experience centers. Ideum has established a strong domestic footprint in museums, education sector, universities, AEC, research centers, retail, and public venues.
Needs vary by geography. Buyers in the education segment focus on simultaneous touch, durability, software compatibility, and accessibility features, while business buyers need integration, high visual quality, and customization. Retailers require product visualization and customer engagement features. In addition, a robust ecosystem of system integrators and content producers in the USA allows buyers to buy customized solutions instead of standard products. This provides room for premium solutions where interactivity plays a role in user engagement.
Europe Interactive Tables Market
In Europe, the share was 20.0% in 2025, and it is expected to grow at a CAGR of 7.5%-8.5% till 2034. Germany is one of the key markets owing to the usage of enterprise technology and interactive solution suppliers in this region. In the UK, France, Italy, and Spain, the factors contributing to the market development are the education segment, museums, hospitality, retail, exhibitions, and corporate segments. In Europe, the procurement of displays is driven by the requirement for energy efficiency of the qualified electronic displays.
In the UK, there is a presence of digital learning and the well-developed infrastructure of visitor attraction. Germany combines the usage of industrial technologies and good ecosystem of interactive experiences. France develops deployments in museums, hospitality, retail, and public information environments. Italy has specialists in technology and exhibitions, and Spain uses tourism, hospitality, education, and experiential retail. Energy consumption, reliability during the life cycle of displays, software flexibility, and system integration become important criteria for the buyers.
APAC Interactive Tables Market
The Asia-Pacific region is expected to have a market share of 28.7% in 2025, growing at a CAGR between 8.5% and 9.5% up to 2034. China is the manufacturing and consuming powerhouse, whereas Japan, South Korea, India, and Australia contribute towards the region with various deployment options in education, retail, hospitality, and corporates.
China enjoys manufacturing prowess along with significant investment in digital infrastructure. Japan contributes to the mature adoption of interactive technologies, whereas South Korea contributes to the region via display eco-system. India sees potential in education and commercial segments as education institutions adopt digital learning solutions and businesses create digital experiences for their customers. Australia sees demand in education, museums, hospitality, and corporate sectors. Growth in the region is supported by urbanization and technological investments.
Middle East & Africa Interactive Tables Market
In the Middle East and Africa, which accounted for about 9.6% of world demand in 2025, growth is estimated at 7.5-8.5% CAGR through 2034. The most significant markets are Saudi Arabia and UAE, driven by investments into smart city projects, tourism infrastructure, luxury hospitality projects, airports, museums, retail destination projects, and more. South Africa adds demand in education, corporate and public sectors.
The adoption of the technology in the region is linked with large-scale infrastructure projects and experience-based venues. Urban centers like Dubai, Riyadh, Doha, and others offer good environment for interactive information provision and hospitality. High temperatures in the region make thermal protection and reliability of equipment important criteria for procurement decisions. Rest of MEA is more discriminating with adoption limited to large commercial, education, tourism and government projects.
Segmentation Analysis
Technology
The Technology segment in the Interactive Tables Market comprises LCD, LED, and Others and is projected to expand at a 7.5–8.5% CAGR during 2026–2034. LCD remains commercially important because of established manufacturing capacity, mature touch integration, and competitive pricing. LED-based solutions provide opportunities for larger and brighter installations, while specialized technologies address niche performance requirements.
- LCD: LCD technology maintains a strong market position because it offers mature supply chains, high-resolution formats, established touch integration, and broad compatibility with education, retail, hospitality, and enterprise applications.
- LED: LED solutions are strategically important for premium, large-format installations requiring high brightness, visual impact, and flexible configuration, particularly in experience centers, exhibitions, retail environments, and public venues.
Screen Size
The Screen Size segment includes Below 40 Inch, 40-65 Inch, and Above 65 Inch and is expected to grow at a 7.5–8.5% CAGR through 2034. Mid-sized systems balance collaborative usability, installation flexibility, and cost, while larger formats serve immersive applications requiring greater visual scale.
- Below 40 Inch: Smaller interactive tables support space-constrained installations, individual interaction, specialized kiosks, compact hospitality environments, and applications where portability or lower equipment cost is prioritized.
- 40-65 Inch: Mid-sized displays provide a balanced format for collaborative education, corporate presentation, retail product exploration, and hospitality applications where multiple users require a practical interaction surface.
- Above 65 Inch: Large-format tables serve immersive applications requiring extensive visual real estate, including exhibitions, command environments, premium hospitality, collaborative design, and high-impact product visualization.
End-user
The End-user segment covers Education, Retail, Hospitality, Enterprises, Transportation, and Others and is projected to grow at an 8.0–9.0% CAGR during 2026–2034. Education remains the largest demand base, while hospitality is positioned for comparatively faster expansion as operators seek differentiated digital experiences.
- Education: Education remains the leading application because interactive tables facilitate collaborative learning, group problem-solving, digital simulations, STEM visualization, and student participation.
- Retail: Retail deployments support product discovery, digital catalogs, interactive advertising, configuration, visualization, and customer engagement within showrooms and stores.
- Hospitality: Hospitality adoption is increasing through digital menus, interactive dining, entertainment, guest information, and personalized service experiences.
- Enterprises: Enterprises use interactive tables for presentations, training, collaborative design, innovation centers, customer demonstrations, and executive collaboration.
- Transportation: Transportation venues use large interactive surfaces for passenger information, wayfinding, maps, destination exploration, and operational visualization.
Opportunity Snapshot
| End-user | Revenue Contribution (High/Medium/Low) | Trend Tag | Adoption Stage |
| Education | High | Smart Learning | Mature |
| Retail | Medium | Product Discovery | Scaling |
| Hospitality | Medium | Digital Dining | Scaling |
| Enterprises | Medium | Team Collaboration | Scaling |
| Transportation | Low | Digital Wayfinding | Emerging |
Interactive Tables Market Growth Drivers and Impact Analysis
Digital education investment strengthens collaborative learning demand
Education remains a fundamental demand driver because interactive tables support group participation rather than one-user interaction. A single surface can allow several learners to manipulate maps, scientific models, diagrams, simulations, and educational games simultaneously. This supports teaching methods centered on collaboration and experiential learning. Institutions also increasingly seek technology that can integrate multimedia content into classroom environments without requiring extensive infrastructure changes. Interactive tables can complement interactive displays, tablets, learning platforms, and classroom management systems. Their value is strongest where curriculum content benefits from spatial visualization and shared interaction. Procurement decisions nevertheless depend on durability, accessibility, software compatibility, and teacher training. Consequently, vendors able to combine robust hardware with education-specific applications can address institutional requirements more effectively than suppliers focused exclusively on display specifications.
Experiential retail increases demand for interactive product visualization
Retailers are increasingly using digital interfaces to make physical shopping environments more informative and engaging. Interactive tables can display extensive product catalogs without requiring equivalent physical inventory, enabling customers to compare specifications, configure products, explore colors, visualize accessories, and access multimedia content. This is particularly relevant in furniture, automotive, consumer electronics, luxury goods, and technology showrooms where products have complex configurations. The technology can also support assisted selling by allowing customers and sales personnel to explore the same information together. Retailers may integrate customer relationship management, inventory, pricing, and product-information systems to create a more connected sales experience. The resulting opportunity extends beyond hardware procurement because successful deployments require content development, system integration, user-interface design, maintenance, and analytics capabilities.
Multi-user interaction expands applications beyond conventional displays
The ability to support simultaneous users differentiates interactive tables from many conventional digital displays. Multi-touch interfaces allow several participants to manipulate information at the same time, making the technology useful for collaborative design, museum interpretation, STEM education, strategic planning, and interactive demonstrations. This capability can increase the functional value of a display because interaction becomes a shared activity rather than an individual task. Suppliers are responding through higher touch-point counts, improved sensor accuracy, optical bonding, object recognition, and stronger computing performance. Garamantis, for example, describes configurations supporting up to 80 simultaneous touch points alongside object recognition and people detection. As these capabilities become more accessible, deployment can expand into smaller educational and commercial environments.
Interactive Tables Market Future Trends
Optically bonded surfaces will become increasingly important
The Interactive Tables Market trends are moving toward optically bonded displays that reduce the air gap between the display panel and touch sensor. This construction can improve image clarity, contrast, viewing angles, and touch accuracy while strengthening resistance to dust, moisture, and physical impact. The benefits are particularly relevant to museums, retail stores, schools, hospitality venues, and other locations where equipment receives frequent public interaction. Ideum's 2025 +PLUS Series demonstrates the direction of this product evolution, applying optical bonding to 55-inch touch tables and displays. Over time, optical bonding is likely to become more common in premium and professional systems as manufacturers optimize production processes and seek greater differentiation. Durability improvements can also lower lifecycle maintenance requirements in demanding installations.
Interactive surfaces will converge with AI-enabled content systems
Future systems are likely to integrate artificial intelligence with interactive surfaces to make content more responsive to users and operating environments. AI can support natural-language interaction, automated content recommendations, visitor analytics, personalized product information, and adaptive educational experiences. Computer vision can further identify objects, gestures, or user presence, enabling interfaces to respond without requiring conventional touch input for every action. Garamantis already combines people detection and object recognition with interactive tables, illustrating the technical foundation for more context-aware interfaces. As edge computing becomes more capable, selected processing tasks can occur locally, reducing latency and potentially limiting transmission of sensitive interaction data. Future procurement will therefore increasingly assess AI functionality, cybersecurity, privacy, and integration with existing content-management systems.
Interactive Tables Market Opportunities
Hospitality deployments can create premium experience-led revenue streams
The Interactive Tables Market Forecasts indicate a growing opportunity in hospitality, where operators increasingly compete through differentiated guest experiences. Interactive dining surfaces can combine menus, entertainment, ordering, loyalty engagement, games, and local information within one interface. Hotels can use interactive tables in lobbies, restaurants, conference spaces, and guest-experience centers, while restaurants can integrate them with digital ordering systems. The opportunity is strongest for premium properties and high-traffic venues where enhanced engagement can justify technology investment. Suppliers can increase addressable revenue by offering integrated hardware, software, content, installation, and maintenance rather than selling displays alone. Partnerships with hospitality technology providers can accelerate deployment by connecting interactive tables with point-of-sale, property-management, reservation, and loyalty platforms.
Transportation hubs offer scalable wayfinding and information applications
Transportation environments provide a distinct opportunity because passengers frequently require maps, schedules, directions, destination information, and service updates while moving through unfamiliar spaces. Interactive tables can provide richer geographic visualization than static signage and can support multiple languages and simultaneous users. Airports, railway stations, metro systems, ferry terminals, and major bus facilities are potential deployment locations. Large surfaces can also support tourism information, retail discovery, accessibility guidance, and emergency communications. The opportunity favors systems with high brightness, rugged construction, centralized content management, and strong network connectivity. Vendors can target transportation authorities and infrastructure developers through long-term contracts combining equipment, software updates, service agreements, and content management. Such contracts can generate recurring revenue while supporting standardized deployments across multiple facilities.
Recent Developments
- December 2025: Snowflake announced the general availability of Snowflake Interactive Analytics on AWS. Just a few months later, we have gotten great feedback from customers and are excited to announce a few big ways in which interactive tables and interactive warehouses have become even more powerful.
- November 2025: Snowflake (NYSE: SNOW), the AI Data Cloud company, announced innovations that make it easier for organizations to ingest, access, and govern their data across the entire data lifecycle, redefining the enterprise lakehouse for the AI era. New advancements to Snowflake Horizon Catalog and Snowflake Openflow (now generally available) enable enterprises to connect all of their data from disparate sources and catalogs, making it accessible for AI agents to drive value — all with consistent, built-in security and governance. Snowflake is also redefining how enterprises can build and power AI agents and apps by helping organizations turn data into immediate insights and near real-time experiences with Interactive Tables and Warehouses (generally available soon), as well as enabling customers to leverage real-time transactional data faster and more efficiently with Snowflake Postgres.
- October 2025: Ideum has expanded its line of hardened touch tables and displays with the introduction of the +PLUS Series, a new generation of hardware designed to deliver exceptional clarity, precision, and durability. The +PLUS Series is available across a range of existing 55″ models and represents a major step forward in touchscreen display performance and construction.
Frequently Asked Questions

- Comprehensive Market Sizing and Forecast Analysis
- Detailed Segmentation Analysis
- In-Depth Market Dynamics Assessment
- Regional and Country-Level Insights
- Competitive Landscape and Company Benchmarking
- Strategic Business Intelligence
Recent Reports
Testimonials

The Insight Partners' SCADA System Market report is comprehensive, with valuable insights on current trends and future forecasts. The team was highly professional, responsive, and supportive throughout. We are very satisfied and highly recommend their services.
RAN KEDEM Partner, Reali Technologies LTDs
I requested a report on a very specific software market and the team produced the report in a few days. The information was very relevant and well presented. I then requested some changes and additions to the report. The team was again very responsive and I got the final report in less than a week.
JEAN-HERVE JENN Chairman, Future Analytica
We worked with The Insight Partners for an important market study and forecast. They gave us clear insights into opportunities and risks, which helped shape our plans. Their research was easy to use and based on solid data. It helped us make smart, confident decisions. We highly recommend them.
PIYUSH NAGPAL Sr. Vice President, High Beam Global
The Insight Partners delivered insightful, well-structured market research with strong domain expertise. Their team was professional and responsive throughout. The user-friendly website made accessing industry reports seamless. We highly recommend them for reliable, high-quality research services
YUKIHIKO ADACHI CEO, Deep Blue, LLC.
This is the first time I have purchased a market report from The Insight Partners.While I was unsure at first, I visited their web site and felt more comfortable to take the risk and purchase a market report.I am completely satisfied with the quality of the report and customer service. I had several questions and comments with the initial report, but after a couple of dialogs over email with their analyst I believe I have a report that I can use as input to our strategic planning process.Thank you so much for taking the extra time and making this a positive experience.I will definitely recommend your service to others and you will be my first call when we need further market data.
JOHN SUZUKI President and Chief Executive Officer, Board Director, BK Technologies
I wish to appreciate your support and the professionalism you displayed in the course of attending to my request for information regarding to infectious disease IVD market in Nigeria. I appreciate your patience, your guidance, and the fact that you were willing to offer a discount, which eventually made it possible for us to close a deal. I look forward to engaging The Insight Partners in the future, all thanks to the impression you have created in me as a result of this first encounter.
DR CHIJIOKE ONYIA MANAGING DIRECTOR, PineCrest Healthcare Ltd.Reason to Buy
- Informed Decision-Making
- Understanding Market Dynamics
- Competitive Analysis
- Identifying Emerging Markets
- Customer Insights
- Market Forecasts
- Risk Mitigation
- Boosting Operational Efficiency
- Strategic Planning
- Investment Justification
- Tracking Industry Innovations
- Aligning with Regulatory Trends





 Get Free Sample for