
Mobile Value Added Services (VAS) Market Growth and Recent Trends by 2031
Coverage: By Solution (SMS, Mobile Money, Utility VAS, Mobile Infotainment, Social Networking, Location Based Services, and Others), End User (Consumer and Enterprises), and Geography
- Status : Data Released
- Report Code : TIPRE00003057
- Category : Technology, Media and Telecommunications
- No. of Pages : 150
- Available Report Formats :


- Last update date : May 16, 2024

2023 Market Size
US$ 869.4 Bn
Base year value
2031 Forecast
US$ 2,640.9 Bn
Projected by 2031
CAGR 2024-2031
14.90 %
Growth rate
Addressable Market
US$ 13,662.07 Bn
(2024-2031)
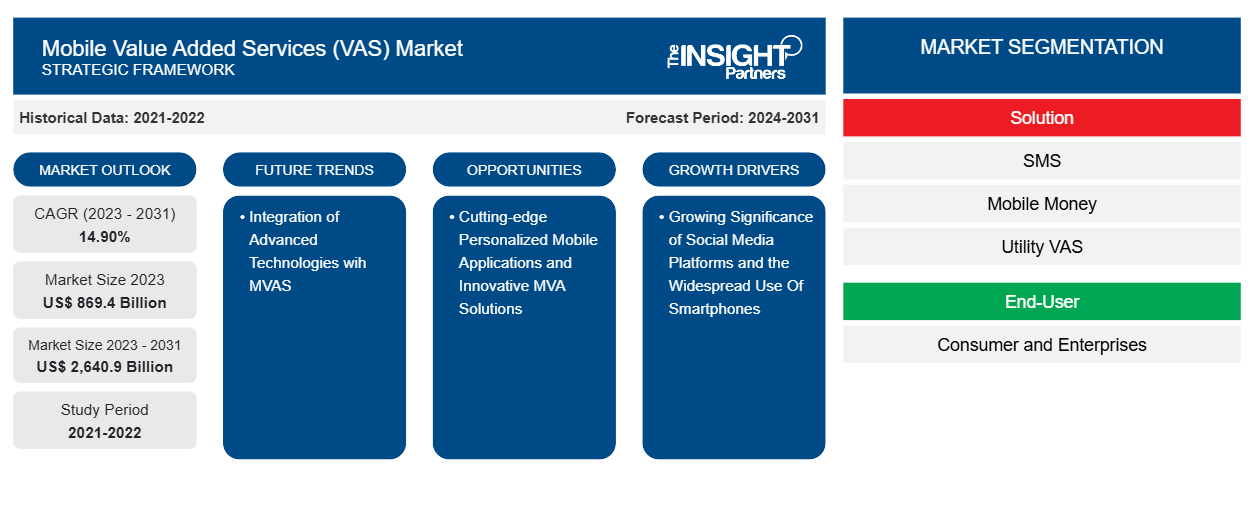
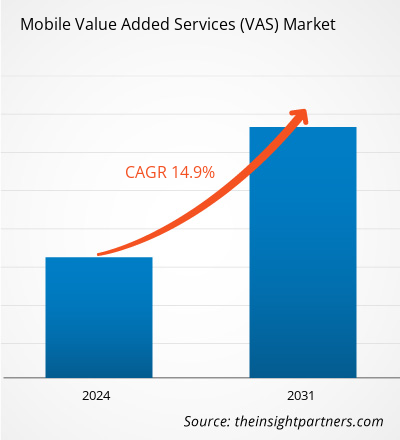
The mobile value added services (VAS) market size is projected to reach US$ 2,640.9 billion by 2031 from US$ 869.4 billion in 2023. The market is expected to register a CAGR of 14.90% during 2023–2031. The growing implication of social media platforms and the widespread use of smartphones are likely to remain key mobile value added services (VAS) market trends.
Mobile Value Added Services (VAS) Market Analysis
The ease of access to mixed and renewed content at reasonable costs is increasing the OTT growth, which is a part of mobile value added services. Telecom companies offer VAS by cooperating with online viewing platforms in the entertainment industry, such as Netflix. Such collaborations contribute to VAS in terms of payments, content delivery, interactive marketing, and customer care.
Mobile Value Added Services (VAS) Market Overview
Mobile value added services (MVAS) include voice communication services and other additional services provided by mobile service providers. These services enable mobile subscribers to utilize smartphones and tablets for various non-voice purposes, including sending short message service (SMS), multimedia messaging service (MMS), mobile email & instant messaging, mobile money, location-based services, mobile advertising, and mobile infotainment. MVAS are marketed as premium features or supplements to essential services and are utilized to create administrative and operational efficiencies across a wide range of services. They offer benefits to both service providers and clients by increasing end user functionality and providing improved analytics and data for commercial usage.
Market Research Highlights
- Global market for Mobile Value Added Services (VAS) was valued at US$ 869.40 Billion in 2023
- Annual market size is expected to reach US$ 2,640.90 Billion by 2031
- Total addressable market (TAM) during 2024-2031 is projected to reach approximately US$ 13,662.07 Billion
- Market is anticipated to register a CAGR of 14.9% during the forecast period
- The United States represents a key market, supported by Growing Significance of Social Media Platforms and the Widespread Use Of Smartphones, as well as evolving industry dynamics
- Market analysis covers North America, Europe, Asia-Pacific, South and Central America, Middle East and Africa, with growth evaluated across the forecast period
- Market opportunities such as Cutting-edge Personalized Mobile Applications and Innovative MVA Solutions are expected to influence market dynamics and addressable market
- Report profiles industry participants, including EITC, Airtel (Robi Axiata Limited), Mobily, MTN CAMEROON, Numeko BiliÅŸim Teknoloji Sanayi Ticaret A.Åž., Oman Telecommunications Company, Ooredoo, Orange S.A., stc, Vodafone Limited, while analyzing competitive strategies and innovation developments
-
Source: The Insight Partners' analysis based on proprietary research, government publications, company annual reports, investor presentations, industry databases, and expert interviews.
● REPORT CUSTOMIZATION
Tailor This Report To Align With Your Specific Business Requirements
This report can be customized to align precisely with your business objectives, scope, and target markets. Customization options include tailored segmentation, geography, competitive analysis, and strategic insights to support informed decision-making.
Customize This Report →WHAT YOU CAN ADJUST
- ● Segmentations
- ● Geography
- ● Competitive Analysis
- ● Language Preferences
Mobile Value Added Services (VAS) Market: Strategic Insights
-
Get Top Key Market Trends of this report.This FREE sample will include data analysis, ranging from market trends to estimates and forecasts.
Mobile Value Added Services (VAS) Market Drivers and Opportunities
Growing Significance of Social Media Platforms and Widespread Use of Smartphones
A wide variety of vendors and massive competition between Internet service providers are highly implementing digital solutions, advanced applications, and numerous value added services. Smartphones are being utilized for accessing various internet applications such as browsing online websites, sharing emails, and interacting on social media platforms. Telecom providers offer a wide range of mobile value added services, including voice, SMS, and data services, among other additional services, to improve the overall user experience. The growing availability of budget-friendly smartphones is a key factor boosting device adoption among the populations with low income, which contributes to the demand for mobile value added services worldwide. Thus, the growing significance of social media platforms and the widespread use of smartphones are key factors fueling the mobile value added service (VAS) market growth.
Cutting-edge Personalized Mobile Applications and Innovative MVA Solutions
A diverse range of novel and inventive personalized mobile applications and mobile value added services (VAS) are being introduced by telecom operators and service providers worldwide to address evolving consumer demands. The dynamic market environment is shaped by factors such as the growing population of mobile VAS subscribers and smartphone users. Moreover, the desire for tailored value added services from both businesses and consumers contributes to the expansion of the mobile value added services (VAS) market. This trend highlights the industry's commitment to meeting the evolving needs of consumers and businesses through cutting-edge mobile solutions and services.
Mobile Value Added Services (VAS) Market Report Segmentation Analysis
Key segments that contributed to the derivation of the mobile value added services (VAS) market analysis are solution and end user.
- Based on the solution, the market is segmented into SMS, mobile money, utility VAS, mobile infotainment, social networking, location-based services, and others. The SMS segment held a substantial market share in 2023.
- By end user, the market is bifurcated into consumers and enterprises. The consumer segment held a significant share of the market in 2023.
Mobile Value Added Services (VAS) Market Share Analysis by Geography
The geographic scope of the mobile value added services (VAS) market report is mainly categorized into five regions: North America, Asia Pacific, Europe, Middle East & Africa, and South & Central America.
Asia Pacific has a high number of mobile phone users, and these devices are primarily used for entertainment purposes such as watching news and movies, mobile banking, etc. The mobile value added services (VAS) market growth in Asia Pacific is attributed to the increasing number of businesses and industry verticals using various mobile value added services and the presence of thriving retail, e-commerce, and IT & telecommunication sectors in the region.
Mobile Value Added Services (VAS)
Mobile Value Added Services (VAS) Market Report Scope
| Report Attribute | Details |
|---|---|
| Market size in 2023 | US$ 869.4 Billion |
| Market Size by 2031 | US$ 2,640.9 Billion |
| Global CAGR (2023 - 2031) | 14.90% |
| Historical Data | 2021-2022 |
| Forecast period | 2024-2031 |
| Segments Covered |
By Solution
|
| Regions and Countries Covered |
North America
|
| Market leaders and key company profiles |
|
Mobile Value Added Services (VAS) Market Players Density: Understanding Its Impact on Business Dynamics
The Mobile Value Added Services (VAS) Market is growing rapidly, driven by increasing end-user demand due to factors such as evolving consumer preferences, technological advancements, and greater awareness of the product's benefits. As demand rises, businesses are expanding their offerings, innovating to meet consumer needs, and capitalizing on emerging trends, which further fuels market growth.
Mobile Value Added Services (VAS) Market News and Recent Developments
The mobile value added services (VAS) market is evaluated by gathering qualitative and quantitative data post primary and secondary research, which includes important corporate publications, association data, and databases. A few of the developments in the mobile value added services (VAS) market are listed below:
- Monty Mobile, the fast-growing global telecommunication company offering innovative technology and communication solutions, announced the integration of AI and machine learning into its value-added services (VAS). This integration, dubbed OmniVAS, will allow the mobile operators to double-digit their revenues in no time. By leveraging data mining, this state-of-the-art AI solution automatically analyzes consumer behavior, optimizing upselling and cross-selling, which have a direct effect on increasing customer satisfaction and thus increasing revenues to operators through boosting their sales, improving their understanding of customer behavior through machine learning and eye-opening insights, enabling them to make intelligent decisions and predictions. (Source: Monty Mobile, Press Release, 2023)
- Clickatell, the Chat Commerce and business messaging leader, has launched their Chat 2 Pay feature for South Africa's largest integrated communications company, Telkom. Telkom's millions of customers can now make payments in WhatsApp, the country's largest chat channel. (Source: Clickatell, Company Website, 2023)
Mobile Value Added Services (VAS) Market Report Coverage and Deliverables
The “Mobile Value Added Services (VAS) Market Size and Forecast (2021–2031)” report provides a detailed analysis of the market covering below areas:
- Mobile value added services (VAS) market size and forecast at global, regional, and country levels for all the key market segments covered under the scope
- Mobile value added services (VAS) market trends as well as market dynamics such as drivers, restraints, and key opportunities
- Detailed PEST/Porter’s Five Forces and SWOT analysis
- Mobile value added services (VAS) market analysis covering key market trends, global and regional framework, major players, regulations, and recent market developments
- Industry landscape and competition analysis covering market concentration, heat map analysis, prominent players, and recent developments for the mobile value added services (VAS) market
- Detailed company profiles
Frequently Asked Questions

- Comprehensive Market Sizing and Forecast Analysis
- Detailed Segmentation Analysis
- In-Depth Market Dynamics Assessment
- Regional and Country-Level Insights
- Competitive Landscape and Company Benchmarking
- Strategic Business Intelligence
Recent Reports
Testimonials
The Insight Partners' SCADA System Market report is comprehensive, with valuable insights on current trends and future forecasts. The team was highly professional, responsive, and supportive throughout. We are very satisfied and highly recommend their services.
RAN KEDEM Partner, Reali Technologies LTDsI requested a report on a very specific software market and the team produced the report in a few days. The information was very relevant and well presented. I then requested some changes and additions to the report. The team was again very responsive and I got the final report in less than a week.
JEAN-HERVE JENN Chairman, Future AnalyticaWe worked with The Insight Partners for an important market study and forecast. They gave us clear insights into opportunities and risks, which helped shape our plans. Their research was easy to use and based on solid data. It helped us make smart, confident decisions. We highly recommend them.
PIYUSH NAGPAL Sr. Vice President, High Beam GlobalThe Insight Partners delivered insightful, well-structured market research with strong domain expertise. Their team was professional and responsive throughout. The user-friendly website made accessing industry reports seamless. We highly recommend them for reliable, high-quality research services
YUKIHIKO ADACHI CEO, Deep Blue, LLC.This is the first time I have purchased a market report from The Insight Partners.While I was unsure at first, I visited their web site and felt more comfortable to take the risk and purchase a market report.I am completely satisfied with the quality of the report and customer service. I had several questions and comments with the initial report, but after a couple of dialogs over email with their analyst I believe I have a report that I can use as input to our strategic planning process.Thank you so much for taking the extra time and making this a positive experience.I will definitely recommend your service to others and you will be my first call when we need further market data.
JOHN SUZUKI President and Chief Executive Officer, Board Director, BK TechnologiesI wish to appreciate your support and the professionalism you displayed in the course of attending to my request for information regarding to infectious disease IVD market in Nigeria. I appreciate your patience, your guidance, and the fact that you were willing to offer a discount, which eventually made it possible for us to close a deal. I look forward to engaging The Insight Partners in the future, all thanks to the impression you have created in me as a result of this first encounter.
DR CHIJIOKE ONYIA MANAGING DIRECTOR, PineCrest Healthcare Ltd.Reason to Buy
- Informed Decision-Making
- Understanding Market Dynamics
- Competitive Analysis
- Identifying Emerging Markets
- Customer Insights
- Market Forecasts
- Risk Mitigation
- Boosting Operational Efficiency
- Strategic Planning
- Investment Justification
- Tracking Industry Innovations
- Aligning with Regulatory Trends


