
Product Analytics Market Key Players and Opportunities by 2031
Product Analytics Market Size and Forecast (2021 - 2031), Global and Regional Share, Trend, and Growth Opportunity Analysis Report Coverage: By Component (Solutions and Services), Deployment (On-Premise and Cloud-Based), Mode (Tracking Data and Analyzing Data), and Vertical (Retail and Consumer Goods, Food and Beverages, Healthcare and Pharmaceuticals, Energy and Utilities, Automotive, Manufacturing, and Others), and Geography
Historic Data: 2021-2022 | Base Year: 2023 | Forecast Period: 2024-2031- Status : Data Released
- Report Code : TIPRE00006175
- Category : Technology, Media and Telecommunications
- No. of Pages : 150
- Available Report Formats :


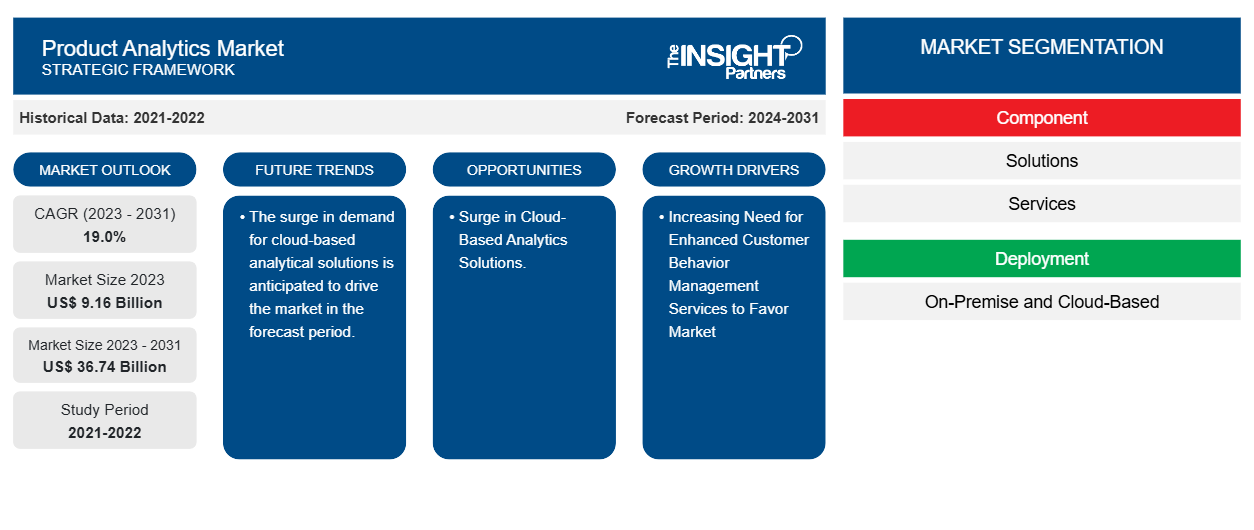
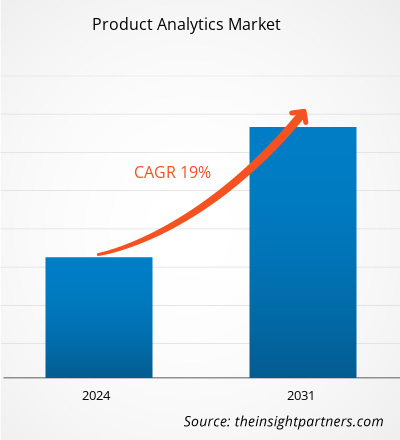
The product analytics market size is projected to reach US$ 36.74 billion by 2031 from US$ 9.16 billion in 2023. The market is expected to register a CAGR of 19.0% during 2023–2031. The increasing need for enhanced customer behavior management services and the rise in the usage of advanced technologies are likely to be the key drivers and trends of the market.
Product Analytics Market Analysis
The product analytics market is experiencing significant growth globally. This growth is attributed to factors such as the increasing need for enhanced customer behavior management services and the rise in usage of advanced technologies. Moreover, the surge in demand for cloud-based analytical solutions is anticipated to hold several opportunities for the product analytic market.
Product Analytics Market Overview
Product analytics is the method of analyzing how users retain with a product or service. It enables product teams to analyze, track, visualize, user engagement and behavior data. Teams use this data to optimize and improve a product or service.
Customize This Report To Suit Your Requirement
Get FREE CUSTOMIZATIONProduct Analytics Market: Strategic Insights
-
Get Top Key Market Trends of this report.This FREE sample will include data analysis, ranging from market trends to estimates and forecasts.
Product Analytics Market Drivers and Opportunities
Increasing Need for Enhanced Customer Behavior Management Services to Favor Market
The increasing need for enhanced customer behavior management services is indeed driving the product analytics market as several businesses understand individual customer preferences and behaviors to customize personalized experiences. Several companies in the market offer product analytics for enhanced customer behavior. For instance, in March 2023, Adobe unveiled new Adobe Product Analytics in Adobe Experience Cloud. The new application reimagines the product analytics category by unifying customer journey insights across marketing and products. For the first time, teams focused on customer experiences can benefit from a truly unified view of the customer and collaborate seamlessly across an organization, driving profitable growth as a result.
Surge in Cloud-Based Analytics Solutions.
A surge in solutions cloud-based analytics solutions can drive the product analytics market in several ways. As cloud-based solutions offer scalability, allowing businesses to easily adjust their analytics capabilities based on demand. Furthermore, many companies offer cloud-based analytics solutions. For example, SAP Analytics Cloud solution, part of SAP Business Technology Platform many companies are empowering people of all ranks and skill sets to make decisions that lead to consequential outcomes for their business and community.
Product Analytics Market Report Segmentation Analysis
Key segments that contributed to the derivation of the product analytics market analysis are component, deployment, mode, and vertical.
- Based on components, the product analytics market is divided into solutions and services. The solutions segment is anticipated to hold a significant market share in the forecast period.
- Based on deployment, the product analytics market is divided into tracking data and analyzing data. The tracking data segment is anticipated to hold a significant market share in the forecast period.
- By vertical, the market is segmented into retail and consumer goods, food and beverages, healthcare and pharmaceuticals, energy and utilities, automotive, manufacturing, and others. Retail and consumer goods are anticipated to hold a significant market share in the forecast period.
Product Analytics Market Share Analysis by Geography
The geographic scope of the product analytics market report is mainly divided into five regions: North America, Asia Pacific, Europe, Middle East & Africa, and South & Central America.
North America has dominated the product analytics market. High technology adoption trends in various industries in the North American region have fuelled the growth of the product analytics market. Factors such as increased adoption of digital tools and high technological spending by government agencies are expected to drive the North American product analytics market growth. Moreover, a strong emphasis on research and development in the developed economies of the US and Canada is forcing the North American players to bring technologically advanced solutions into the market. In addition, the US has a large number of product analytics market players who have been increasingly focusing on developing innovative solutions. All these factors contribute to the region's growth of the product analytics market.
Product Analytics Market Report Scope
| Report Attribute | Details |
|---|---|
| Market size in 2023 | US$ 9.16 Billion |
| Market Size by 2031 | US$ 36.74 Billion |
| Global CAGR (2023 - 2031) | 19.0% |
| Historical Data | 2021-2022 |
| Forecast period | 2024-2031 |
| Segments Covered |
By Component
|
| Regions and Countries Covered |
North America
|
| Market leaders and key company profiles |
|
Product Analytics Market Players Density: Understanding Its Impact on Business Dynamics
The Product Analytics Market is growing rapidly, driven by increasing end-user demand due to factors such as evolving consumer preferences, technological advancements, and greater awareness of the product's benefits. As demand rises, businesses are expanding their offerings, innovating to meet consumer needs, and capitalizing on emerging trends, which further fuels market growth.
Product Analytics Market News and Recent Developments
The product analytics market is evaluated by gathering qualitative and quantitative data post primary and secondary research, which includes important corporate publications, association data, and databases. A few of the developments in the product analytics market are listed below:
- Instructure, the leading learning technology ecosystem and maker of Canvas LMS, launched Intelligent Insights, a new product powered by AI and analytics, unlocking a level of self-service reporting capabilities generally unavailable to educational institutions. (Source: Instructure Company Website, June 2024)
- LSEG (London Stock Exchange Group) and Dow Jones announced a new, multi-year data, news, and analytics partnership. Dow Jones to embed LSEG’s world-class data and analytics capabilities across digital and print properties, including The Wall Street Journal, Barron's, Investor’s Business Daily and MarketWatch. (Source: LSEG Company Website, July 2024)
Product Analytics Market Report Coverage and Deliverables
The “Product Analytics Market Size and Forecast (2021–2031)” report provides a detailed analysis of the market covering below areas:
- Product analytics market size and forecast at global, regional, and country levels for all the key market segments covered under the scope.
- Product analytics market trends as well as market dynamics such as drivers, restraints, and key opportunities.
- Detailed PEST/Porter’s Five Forces and SWOT analysis.
- Product analytics market analysis covering key market trends, global and regional framework, major players, regulations, and recent market developments.
- Industry landscape and competition analysis covering market concentration, heat map analysis, prominent players, and recent developments for the product analytics market.
- Detailed company profiles.
Frequently Asked Questions

- Historical Analysis (2 Years), Base Year, Forecast (7 Years) with CAGR
- PEST and SWOT Analysis
- Market Size Value / Volume - Global, Regional, Country
- Industry and Competitive Landscape
- Excel Dataset
Recent Reports
Testimonials
The Insight Partners' SCADA System Market report is comprehensive, with valuable insights on current trends and future forecasts. The team was highly professional, responsive, and supportive throughout. We are very satisfied and highly recommend their services.
RAN KEDEM Partner, Reali Technologies LTDsI requested a report on a very specific software market and the team produced the report in a few days. The information was very relevant and well presented. I then requested some changes and additions to the report. The team was again very responsive and I got the final report in less than a week.
JEAN-HERVE JENN Chairman, Future AnalyticaWe worked with The Insight Partners for an important market study and forecast. They gave us clear insights into opportunities and risks, which helped shape our plans. Their research was easy to use and based on solid data. It helped us make smart, confident decisions. We highly recommend them.
PIYUSH NAGPAL Sr. Vice President, High Beam GlobalThe Insight Partners delivered insightful, well-structured market research with strong domain expertise. Their team was professional and responsive throughout. The user-friendly website made accessing industry reports seamless. We highly recommend them for reliable, high-quality research services
YUKIHIKO ADACHI CEO, Deep Blue, LLC.This is the first time I have purchased a market report from The Insight Partners.While I was unsure at first, I visited their web site and felt more comfortable to take the risk and purchase a market report.I am completely satisfied with the quality of the report and customer service. I had several questions and comments with the initial report, but after a couple of dialogs over email with their analyst I believe I have a report that I can use as input to our strategic planning process.Thank you so much for taking the extra time and making this a positive experience.I will definitely recommend your service to others and you will be my first call when we need further market data.
JOHN SUZUKI President and Chief Executive Officer, Board Director, BK TechnologiesI wish to appreciate your support and the professionalism you displayed in the course of attending to my request for information regarding to infectious disease IVD market in Nigeria. I appreciate your patience, your guidance, and the fact that you were willing to offer a discount, which eventually made it possible for us to close a deal. I look forward to engaging The Insight Partners in the future, all thanks to the impression you have created in me as a result of this first encounter.
DR CHIJIOKE ONYIA MANAGING DIRECTOR, PineCrest Healthcare Ltd.Reason to Buy
- Informed Decision-Making
- Understanding Market Dynamics
- Competitive Analysis
- Identifying Emerging Markets
- Customer Insights
- Market Forecasts
- Risk Mitigation
- Boosting Operational Efficiency
- Strategic Planning
- Investment Justification
- Tracking Industry Innovations
- Aligning with Regulatory Trends
Unlock Exclusive Report Discounts
Enquire Now


 Get Free Sample For