US Pharmaceutical Market Outlook and Strategic Insights by 2030
US Pharmaceutical Market Size and Forecast (2020 - 2030), Regional Share, Trend, and Growth Opportunity Analysis Report Coverage: By Product (Vaccines, Biologics & Biosimilars, and Small Molecules)
- Status : Published
- Report Code : TIPRE00034731
- Category : Life Sciences
- No. of Pages : 292
- Available Report Formats :


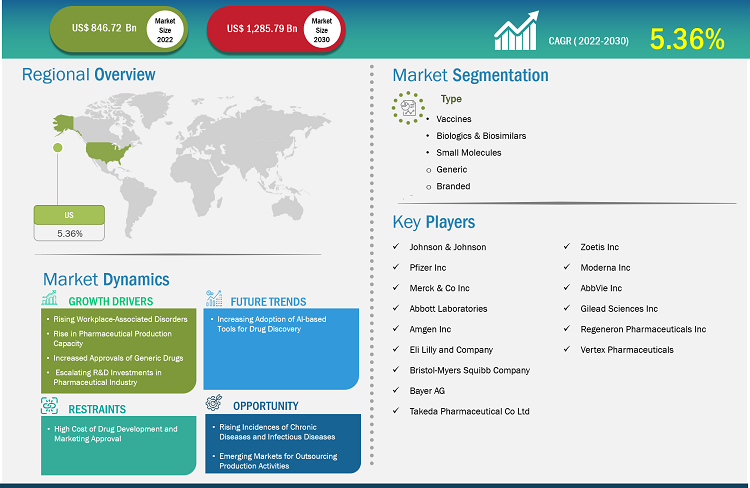
The US pharmaceutical market size is expected to grow from US$ 846.72 billion in 2022 to US$ 1,285.79 billion by 2030; it is estimated to record a CAGR of 5.36% during 2022–2030.
Analyst’s Viewpoint
Rising workplace-associated disorders, rise in pharmaceutical production capacity, increased approvals of generic drugs, and escalating R&D investments in the pharmaceutical sector drive the US pharmaceutical market growth. However, the high cost of drug development and marketing approval hinders the market growth. The US pharmaceutical market forecast, by product, is segmented into vaccines, biologicals & biosimilars, and small molecules. The small molecules segment is further bifurcated into generic and branded. The small molecules segment held the largest market share in 2022. The biologicals & biosimilars segment is expected to register the highest CAGR during the forecast period.
Pharmaceutical is a broad segment that consolidates a group of chemicals classified based on their pharmacological effect and therapeutic use. For instance, alkaloids were the first pure pharmaceuticals derived from plants; they include quinine, nicotine, cocaine, atropine, and morphine. Similarly, some drugs are made of animal origin, which includes glandular extracts containing hormones. These pharmaceutical products diagnose, treat, and prevent chronic diseases such as cancer, diabetes, and genetic disorders.
Market Insights
Increased Approval of Generic Drugs
The demand for generic drugs, which serve as an alternative to branded drugs, has increased tremendously owing to their low costs. Many branded drug patents are nearing expiry, which is a major reason for the surged production of generics. In February 2023, Zydus Lifesciences received tentative approval from the US Food & Drug Administration (USFDA) for two generic drugs: bosentan tablets (32 mg) and canagliflozin tablets (100 mg and 300 mg). Bosentan tablet is indicated for the treatment of pulmonary arterial hypertension (PAH) in pediatric patients with age 3 years or above. The canagliflozin tablet is indicated to improve glycemic control in patients with type 2 diabetes mellitus. In July 2022, Glenmark PHARMACEUTICALs Inc. received approval from the USFDA for norethindrone acetate and ethinyl estradiol capsules, and ferrous fumarate capsules (1 mg/20 mcg). The approved drug is the generic version of Taytulla capsules offered by Allergan PHARMACEUTICALs International, which is a prescription birth control pill. In November 2022, the USFDA granted tentative approval for Lupin’s Abbreviated New Drug Application (ANDA) for drospirenone tablets, 4 mg, which is a generic version of Slynd Tablets, 4 mg, of Exeltis USA Inc.
Thus, the growing number of approvals of generic drugs drives the US pharmaceutical market share and demand for generic segment.
Customize Research To Suit Your Requirement
We can optimize and tailor the analysis and scope which is unmet through our standard offerings. This flexibility will help you gain the exact information needed for your business planning and decision making.
US Pharmaceutical Market: Strategic Insights
Market Size Value in US$ 846.72 billion in 2022 Market Size Value by US$ 1,285.79 billion by 2030 Growth rate CAGR 5.36% from 2022 to 2030 Forecast Period 2022-2030 Base Year 2022

Mrinal
Have a question?
Mrinal will walk you through a 15-minute call to present the report’s content and answer all queries if you have any.
 Speak to Analyst
Customize Research To Suit Your Requirement
We can optimize and tailor the analysis and scope which is unmet through our standard offerings. This flexibility will help you gain the exact information needed for your business planning and decision making.
US Pharmaceutical Market: Strategic Insights
| Market Size Value in | US$ 846.72 billion in 2022 |
| Market Size Value by | US$ 1,285.79 billion by 2030 |
| Growth rate | CAGR 5.36% from 2022 to 2030 |
| Forecast Period | 2022-2030 |
| Base Year | 2022 |
Mrinal
Have a question?
Mrinal will walk you through a 15-minute call to present the report’s content and answer all queries if you have any.
Speak to Analyst
Escalating R&D Investments in Pharmaceutical Industry
Majority of investments in the US pharmaceutical market, companies primarily target drug discovery and development. According to the Pharmaceutical Research and Manufacturers Association (PhRMA), pharmaceutical companies in the US perform more than half of the world's R&D, with investments totaling ~US$ 75 billion, and they hold intellectual property rights on most of the new pharmaceuticals. In 2021, Pfizer Inc. invested US$ 13,829 million in research and development, recording an increase of US$ 4.4 billion from 2020 (US$ 9,393 million). Similarly, Johnson & Johnson invested US$ 14.7 billion in research and development in 2021, with an annual rise of 21% in its all-time-high investment recorded in 2020. These investments reflect the commitment of companies to creating life-enhancing innovations.
The research-based pharmaceutical industry is an important asset of the European economy; it is one of the top-performing high-technology segments in the region. As per the European Federation of Pharmaceutical Industries and Associations (EFPIA), the research-based pharmaceutical industry in Europe invested ~US$ 44,266.18 million (€ 41,500 million) in R&D in 2021. Similarly, governments of countries in Asia Pacific are focusing on pharmaceutical R&D activities. For instance, the Government of Thailand launched the “Thailand 4.0” initiative to facilitate the country’s shift from a “manufacturing hub” to an “innovation hub.” Additionally, as per the India Brand Equity Foundation, the foreign direct investment (FDI) inflows in the Indian drugs and pharmaceuticals sector reached US$ 1,414 million between 2021 and 2022.
Such high investments in R&D activities are driving the growth of the US pharmaceutical market share at present and also in future years. The Central American automotive sector is experiencing significant growth, driven by factors such as population increase, rising disposable incomes, and improved access to credit and financing. This expansion is not only boosting automobile sales but also increasing the demand for lubricants essential for vehicle maintenance. For instance, TVS Motor Company has strengthened its presence in the region by partnering with Active Motors SA, a subsidiary of Grupo Q, to distribute its products in Nicaragua and Costa Rica. This collaboration aims to enhance sales, service, and customer relationship management, facilitating the opening of flagship outlets and numerous dealerships. Such strategic partnerships are indicative of the growing importance of the Central American market for automotive manufacturers.
Concurrently, the renewable energy sector, particularly wind energy, is emerging as a significant consumer of industrial lubricants. The development of wind farms necessitates specialized lubricants to ensure the efficient operation of turbines. For example, Total Eren's planned 112-megawatt wind farm in San Marcos de Colón, Honduras, underscores the region's commitment to renewable energy. As Central American countries continue to embrace renewable energy sources, the demand for lubricants tailored to these industries is expected to rise, further contributing to the growth of the lubricant market.
Future Trend
Increasing Adoption of AI-Based Tools for Drug Discovery
Artificial intelligence (AI) is emerging as an important tool in the healthcare sector, as it helps understand the action mechanism of drugs. The use of AI tools has already been proven to accelerate the process of discovering new candidate therapeutics; the process that earlier used to take years to complete can now be accomplished within months using AI. In addition to reducing the timelines of drug discovery, AI helps enhance the agility of the research process, increase the accuracy of predictions on drug safety and efficacy, and boost the speed and precision of discovery and preclinical testing, thereby providing a competitive edge to R&D strategies.
Many pharmaceutical companies are collaborating with AI companies to harness the benefits of AI in drug discovery. For instance, in 2019, Pfizer partnered with Concreto HealthAI to advance its work in precision oncology using AI and real-world data. The company believes that AI tools have tremendous potential in developing and using drugs to improve patient outcomes. Further, in 2022, Pfizer extended its partnership with CytoReason to leverage its AI technology for improving drug candidate discovery and drug development processes. Similarly, in 2019, Janssen collaborated with a French startup Iktos Pharmaceuticals to develop an AI-powered drug design system. Janssen's new drug design system will enhance the process of discovering new medications by accelerating the identification of molecules. Additionally, in January 2020, Bayer partnered with a UK-based AI-driven drug discovery company, where Bayer will use the AI drug discovery platform to identify and optimize novel structures as potential drug candidates to treat cardiovascular and oncological diseases. Similarly, GlaxoSmithKline (GSK) collaborated with Insilico Medicine, a Baltimore-based AI-driven company, to explore the AI capability of Insilico for easing the process of identification of novel biological targets.
Thus, the growing adoption of AI-based tools for drug discovery is likely to trigger the demand of the US pharmaceutical market analysis during the forecast period.
US Pharmaceutical Market Report Scope
Market Opportunity
Rising Incidences of Chronic Diseases and Infectious Diseases
The Centers for Disease Control and Prevention (CDC) states that 6 in 10 adults in the US suffer from at least one chronic disease, such as cancer, heart disease, lung disease, stroke, neurological disease, diabetes, and kidney disease. Moreover, 4 in 10 adults in the country suffer from 2 or more chronic diseases. According to the CDC, ~1,752,735 new cancer cases were reported in the US in 2019. The most prevalent cancer types are breast cancer, lung and bronchus cancer, prostate cancer, colon and rectum cancer, melanoma cancer, and liver cancer. Further, according to data published by the American Diabetes Association, ~37.3 million people, representing 11.4% of Americans, were possibly diabetic in 2019. Among these, ~28.7 million people were diagnosed with diabetes, while ~8.5 million did not undergo a proper diagnostic procedure. Further, per the National Ambulatory Medical Care Survey: 2019, there were 10.2 million visits to physicians for the treatment of infectious and parasitic diseases.
According to the World Health Organization, chronic diseases represent 77% of the total disease burden and 86% of all deaths in Europe. Thus, 70–80% of the total healthcare costs are spent on the management of chronic diseases. The surging prevalence of infectious diseases, especially in Southeast Asia, is also likely to propel the demand for pharmaceuticals in the coming years, eventually driving the growth of the pharmaceutical market. For instance, as per the Revised National Tuberculosis Control Programme Report, ~4.4 lakh patients died due to tuberculosis in India in 2018, i.e., 29% of the total 1.5 million deaths caused by the disease across the world. Thus, the rising incidence of chronic diseases and infectious diseases bolsters the demand for drugs, which would continue to drive the US pharmaceutical market growth in the future.
Product-Based Insights
The US pharmaceutical market analysis, by product, is segmented into vaccines, biologicals & biosimilars, and small molecules. The small molecules segment is further bifurcated into generic and branded. The small molecules segment held the largest market share in 2022. The biologicals & biosimilars segment is expected to register the highest CAGR during the forecast period. In the US pharmaceutical market growth, biosimilars treat patients with cancers, kidney diseases, diabetes, and other autoimmune diseases such as rheumatoid arthritis and Crohn's disease. Biologics are the most expensive medicines in the US pharmaceutical market outlook, costing tens of thousands of dollars yearly per patient. Biosimilars are expected to be priced 15–30% lower than their reference product. In 2020 alone, biosimilars saved US$ 7.9 billion, with savings expected to grow significantly in the next few years as more biosimilars enter the market. According to Cardinal Health, it is expected that biosimilars are expected to reduce the US drug expenditure by US$ 133 billion by 2025. The recognition of biosimilars as efficacious and safe agents by patients, specialists, primary care clinicians, and other healthcare professionals is propelling the demand for biosimilars. In addition, biosimilars help improve the quality of life among millions of patients while saving billions of dollars for healthcare systems per year. They have come up as potent and cost-effective options for treating many diseases—including chronic skin conditions such as psoriasis; bowel diseases such as Crohn’s disease, irritable bowel syndrome, and colitis; diabetes; autoimmune disease; cancer; kidney conditions; and arthritis. During 2017–2018, the National Health Service (NHS) saved US$ 401.10 million by switching from 10 expensive medicines to better-value and equally effective alternatives such as biologics, with an expectation of even more savings in the future. The potential savings from using biosimilars can also be used to fund other new treatments. With the high prevalence of chronic diseases, the demand for biosimilars in treating life-threatening illnesses has surged rapidly over the last five years. Such a factor has assisted the growth of the US pharmaceutical market trends in the recent past and is expected to follow a similar trend during the forecast period.
Country Analysis
In recent years, pharmaceutical sales revenues in the US pharmaceutical market outlook have accounted for nearly half of the global total. Five of the 10 top US pharmaceutical market companies worldwide were from the US in 2021. Pfizer is one of the companies that provides prescription drug revenues worldwide, heavily boosted by its COVID-19 vaccine Comirnaty. AbbVie is another US pharmaceutical market participant that has made a great impression worldwide, with the pharmaceutical segment generating a record US$ 55 billion in 2021, driven especially by its longstanding top-seller brand Humira. Despite the influence of several emerging countries, the US has captured a dominant share of the pharmaceutical market globally. The US pharmaceutical market is home to a few major pharma companies worldwide. Most advanced US pharmaceutical market products are easily accessible to American consumers, albeit at a cost.
The US pharmaceutical market accounts for about 45% of the global pharmaceutical market and 22% of global production. The US pharmaceuticals output and sales remained robust in 2022, driven by the global vaccination rollout and suppressed demand for essential and non-essential medical treatments. The US pharmaceutical market has made great strides over the past few decades due to a greater focus on research and development (R&D). Pharma companies spend over 21% of their revenues on R&D, and this sizeable investment is wasted if a medication does not receive regulatory approval. The R&D expenditure of the US pharmaceutical market totaled some US$ 102 billion in 2021. This figure will likely increase significantly in the coming years due to the costs of developing effective and safe COVID-19 treatments and vaccines.
Johnson & Johnson, Merck & Co Inc, Abbott Laboratories, Amgen Inc, Eli Lilly and Company, Bristol-Myers Squibb Company, Bayer AG, Takeda Pharmaceuticals, Zoetis Inc, Moderna Inc, AbbVie Inc, Pfizer Inc, Gilead Sciences Inc, and Regeneron Pharmaceuticals Inc are a few of the key companies operating in the US pharmaceutical market report. Leading players in the US pharmaceutical market report focus on expanding and diversifying their market presence and clientele, tapping prevailing business opportunities. In August 2023, Bristol Myers Squibb acquired Mirati Therapeutics Inc. The goal of Mirati, a commercial-stage targeted oncology firm, is to find, create, and provide ground-breaking treatments that will improve the quality of life for cancer patients and their families. The assets of Mirati provide a compelling opportunity to expand Bristol Myers Squibb's oncology trademark, as they complement the company's portfolio and creative pipeline. By virtue of this acquisition, Bristol Myers Squibb will expand its commercial portfolio by incorporating KRAZATI, a significant lung cancer medication. The business obtains access to a number of intriguing clinical assets that enhance its pipeline for oncology treatments and make excellent prospects for both combination and single-agent development.

Report Coverage
Revenue forecast, Company Analysis, Industry landscape, Growth factors, and Trends

Segment Covered
Product

Regional Scope
North America, Europe, Asia Pacific, Middle East & Africa, South & Central America

Country Scope
This text is related
to country scope.
Frequently Asked Questions
Johnson & Johnson, Merck & Co Inc, Abbott Laboratories, Amgen Inc, Eli Lilly and Company, Bristol-Myers Squibb Company, Bayer AG, Takeda Pharmaceuticals, Zoetis Inc, Moderna Inc, AbbVie Inc, Pfizer Inc, Gilead Sciences Inc, and Regeneron Pharmaceuticals Inc are a few of the key companies operating in the US pharmaceutical market. Leading players focus on expanding and diversifying their market presence and clientele, tapping prevailing business opportunities.
The market growth in the US pharmaceutical market is driven by rising workplace-associated disorders, rise in pharmaceutical production capacity, increased approvals of generic drugs, and escalating R&D investments in the pharmaceutical sector. However, the high cost of drug development and marketing approval hinders the market growth.
The CAGR value of the US Pharmaceutical Market during the forecasted period of 2022-2030 is 5.36%.
Pharmaceutical is a broad segment that consolidates a group of chemicals classified based on their pharmacological effect and therapeutic use. For instance, alkaloids were the first pure pharmaceuticals derived from plants; they include quinine, nicotine, cocaine, atropine, and morphine. Similarly, some drugs are made of animal origin, which includes glandular extracts containing hormones. Drugs or medicines from animal origins are biological, biosimilar, and vaccines. These pharmaceutical products diagnose, treat, and prevent chronic diseases such as cancer, diabetes, and genetic disorders.
The US pharmaceutical market, by product, is segmented into vaccines, biologicals & biosimilars, and small molecules. The small molecules segment is further bifurcated into generic and branded. The small molecules segment held the largest market share in 2022. The biologicals & biosimilars segment is expected to register the highest CAGR during the forecast period.
1. Introduction 16
1.1 Scope of the Study. 16
2. Pharmaceutical Market – Key Takeaways 17
3. Research Methodology 21
3.1 Coverage. 22
3.2 Secondary Research. 23
3.3 Primary Research. 24
4. Pharmaceutical Market – Market Landscape 25
4.1 Overview. 25
4.2 PESTLE Analysis. 25
4.2.1 Political Factors. 25
4.2.2 Economic Factors. 25
4.2.3 Social Factors. 26
4.2.4 Technological Factors. 26
4.2.5 Legal Factors. 27
4.2.6 Environmental Factors. 27
4.3 Expert’s Opinion. 28
4.4 Macro-Economic Framework of the U.S. 28
4.5 Import and Export Activities in the U.S. and Italy. 31
4.5.1 Import – Export Analysis. 31
4.5.2 US. 37
4.5.3 Italy. 50
4.6 Magazines, Publications, Universities, and Online Portals. 60
4.7 Events List 65
4.8 Trade Shows List 67
4.9 Useful Contacts -Events and Trade Shows, Associations, and Magazines. 68
4.9.1 Associations - MAIN PHARMACEUTICAL, VACCINE AND CONSUMER PRODUCT TRADE ASSOCIATIONS. 74
4.9.2 Magazines – Trade Magazines, Blogs, Journals, and Publications. 81
4.10 Information Regarding CDMOs. 84
4.10.1 Surplus/Deficit information. 84
4.10.2 Trade Balance. 84
4.10.3 Production and investment Done in the recent Past 85
4.10.4 Initiatives Taken by Pharmaceutical Countries. 86
4.11 Supply Chain Distribution Channel 87
4.12 Suggestions and Opportunities For Italian Companies. 98
4.13 Industry Performance. 99
4.14 Industry Outlook. 100
4.14.1 Market Size and Growth. 100
4.14.2 Research and Development (R&D) 100
4.14.3 Market Dynamics. 100
4.14.4 Regulatory Landscape. 101
4.14.5 Market Access and Pricing. 101
4.14.6 COVID-19 Impact 101
4.14.7 Generics and Biosimilars. 101
4.14.8 Digital Health Integration. 101
4.14.9 Supply Chain Resilience. 102
4.14.10 Workforce and Employment 102
4.14.11 Downward Pressure on Pricing. 102
4.14.12 From Treatment to Prevention and Beyond. 103
4.15 Key External Drivers. 103
4.15.1 Increasing Geriatric Population. 103
4.15.2 Advantages Offered by Continuous Manufacturing Process. 104
4.16 Demand Determinants in Future. 104
4.16.1 Growing Interest of Pharmaceutical Companies to Promote Product Sales through Contract Sales Organizations. 104
4.16.2 Rising Number of Healthcare Start-ups. 105
4.17 Industry Trends in the US Market 106
4.17.1 Increasing Adoption of Continuous Manufacturing in Pharmaceuticals. 106
4.17.2 Growing Adoption of AI-based Tools for Drug Discovery. 106
4.17.3 Growing Adoption of Self-Injecting Parenteral Devices. 106
5. Pharmaceutical Market – Key Market Dynamics 110
5.1 Market Drivers. 110
5.1.1 Rising Workplace-Associated Disorders. 110
5.1.2 Rise in Pharmaceutical Production Capacity. 111
5.1.3 Increased Approvals of Generic Drugs. 112
5.1.4 Escalating R&D Investments in Pharmaceutical Industry. 112
5.2 Market Restraints. 113
5.2.1 High Cost of Drug Development and Marketing Approval 113
5.3 Market Opportunities. 113
5.3.1 Rising Incidences of Chronic Diseases and Infectious Diseases. 113
5.3.2 Emerging Markets for Outsourcing Production Activities. 114
5.4 Future Trends. 115
5.4.1 Increasing Adoption of AI-based Tools for Drug Discovery. 115
5.5 Impact Analysis. 116
6. Pharmaceutical Market – US Analysis 117
6.1 US Pharmaceutical Market Revenue Forecast and Analysis. 117
6.1.1 US: Pharmaceutical Market, by Product, 2019–2030 (US$ Billion) 118
6.1.1.1 US: Pharmaceuticals Market For Product, by Type, 2019–2030 (US$ Billion) 118
6.2 Production mapping. 119
6.2.1 Pharma companies in the US- 119
6.2.2 The impact of COVID-19 on R&D- 119
6.3 Pricing Analysis of Key Products. 119
6.4 Production and Sales Statistics of Pharmaceutical Market in US. 122
6.5 Value Chain Analysis and Vendor’s Ecosystem.. 124
6.6 Go-to-Market Strategies for Companies. 125
6.6.1 Johnson & Johnson. 125
6.6.2 Pfizer Inc. 126
6.6.3 Merck Co & Inc. 126
6.7 Regulatory Scenario in the United States Associated With Pharmaceutical Industry. 127
6.7.1 Agencies, Organizations, Institutes, Centers, and Offices Associated with Pharmaceutical Product Regulation. 128
6.7.2 Regulations to enter and operate within the USA Market 128
6.8 HTS Codes for Drugs in United States. 129
6.8.1 Custom Duties. 131
6.8.2 Link Between HTS Codes and Custom Duties. 131
7. US Branded Small Molecules Market 132
7.1 US: Branded Small Molecules Market Revenue and Forecast to 2030. 132
7.1.1 Overview. 132
7.1.2 US: Branded Small Molecules Market Positioning Analysis. 134
7.1.3 US Branded Small Molecules Market – Revenue and Forecast to 2030 (USD Billion) 135
8. US Generic Small Molecules Market 136
8.1 US: Generic Small Molecules Market Revenue and Forecast to 2030. 136
8.1.1 Overview. 136
8.1.2 US: Generic Small Molecules Market Positioning Analysis: 138
8.1.3 US Generic Small Molecules Market – Revenue and Forecast to 2030 (USD Billion) 139
9. US Biological and Biosimilar Products Market 140
9.1 US: Biological and Biosimilar Products Market Revenue and Forecast to 2030. 140
9.1.1 Overview. 140
9.1.2 US: Biological and Biosimilar Products Market Positioning Analysis: 142
9.1.3 US Biological and Biosimilar Products Market – Revenue and Forecast to 2030 (USD Billion) 143
10. US Vaccines Market 144
10.1 US: Vaccines Market Revenue and Forecast to 2030. 144
10.1.1 Overview. 144
10.1.2 US: Vaccines Market Positioning Analysis: 146
10.1.3 US Vaccines Market – Revenue and Forecast to 2030 (USD Billion) 147
11. Pharmaceutical Market – Industry Landscape 148
11.1 Overview. 148
11.2 Growth Strategies in the Pharmaceutical Market 148
11.3 Inorganic Growth Strategies. 149
11.3.1 Overview. 149
11.4 Organic Growth Strategies. 150
11.4.1 Overview. 150
12. Company Profiles 152
12.1 Moderna Inc. 152
12.1.1 Key Facts. 152
12.1.2 Business Description. 152
12.1.3 Products and Services. 153
12.1.4 Financial Overview. 154
12.1.5 SWOT Analysis. 156
12.1.6 Key Developments. 158
12.2 AbbVie Inc. 159
12.2.1 Key Facts. 159
12.2.2 Business Description. 159
12.2.3 Products and Services. 160
12.2.4 Financial Overview. 161
12.2.5 SWOT Analysis. 164
12.2.6 Key Developments. 168
12.3 Gilead Sciences Inc. 169
12.3.1 Key Facts. 169
12.3.2 Business Description. 169
12.3.3 Products and Services. 170
12.3.4 Financial Overview. 171
12.3.5 SWOT Analysis. 173
12.3.6 Key Developments. 177
12.4 Regeneron Pharmaceuticals Inc. 178
12.4.1 Key Facts. 178
12.4.2 Business Description. 178
12.4.3 Products and Services. 179
12.4.4 Financial Overview. 180
12.4.5 SWOT Analysis. 181
12.4.6 Key Developments. 185
12.5 Merck & Co Inc. 186
12.5.1 Key Facts. 186
12.5.2 Business Description. 186
12.5.3 Products and Services. 187
12.5.4 Financial Overview. 188
12.5.5 SWOT Analysis. 191
12.5.6 Key Developments. 195
12.6 Abbott Laboratories. 196
12.6.1 Key Facts. 196
12.6.2 Business Description. 196
12.6.3 Products and Services. 197
12.6.4 Financial Overview. 199
12.6.5 SWOT Analysis. 202
12.6.6 Key Developments. 206
12.7 Bristol-Myers Squibb Co. 207
12.7.1 Key Facts. 207
12.7.2 Business Description. 207
12.7.3 Products and Services. 208
12.7.4 Financial Overview. 209
12.7.5 SWOT Analysis. 211
12.7.6 Key Developments. 215
12.8 Vertex Pharmaceuticals Inc. 216
12.8.1 Key Facts. 216
12.8.2 Business Description. 216
12.8.3 Products and Services. 217
12.8.4 Financial Overview. 218
12.8.5 SWOT Analysis. 220
12.8.6 Key Developments. 222
12.9 Pfizer Inc. 223
12.9.1 Key Facts. 223
12.9.2 Business Description. 223
12.9.3 Products and Services. 224
12.9.4 Financial Overview. 225
12.9.5 SWOT Analysis. 227
12.9.6 Key Developments. 231
12.10 Eli Lilly and Co. 233
12.10.1 Key Facts. 233
12.10.2 Business Description. 233
12.10.3 Products and Services. 234
12.10.4 Financial Overview. 235
12.10.5 SWOT Analysis. 237
12.10.6 Key Developments. 241
12.11 Bayer AG. 242
12.11.1 Key Facts. 242
12.11.2 Business Description. 242
12.11.3 Products and Services. 243
12.11.4 Financial Overview. 245
12.11.5 SWOT Analysis. 248
12.11.6 Key Developments. 251
12.12 Johnson & Johnson. 252
12.12.1 Key Facts. 252
12.12.2 Business Description. 252
12.12.3 Products and Services. 253
12.12.4 Financial Overview. 256
12.12.5 SWOT Analysis. 258
12.12.6 Key Developments. 262
12.13 Amgen Inc. 264
12.13.1 Key Facts. 264
12.13.2 Business Description. 264
12.13.3 Products and Services. 265
12.13.4 Financial Overview. 266
12.13.5 SWOT Analysis. 268
12.13.6 Key Developments. 272
12.14 Takeda Pharmaceutical Co Ltd. 273
12.14.1 Key Facts. 273
12.14.2 Business Description. 273
12.14.3 Products and Services. 274
12.14.4 Financial Overview. 275
12.14.5 SWOT Analysis. 278
12.14.6 Key Developments. 282
12.15 Zoetis Inc. 283
12.15.1 Key Facts. 283
12.15.2 Business Description. 283
12.15.3 Products and Services. 284
12.15.4 Financial Overview. 285
12.15.5 SWOT Analysis. 287
12.15.6 Key Developments. 290
List of Tables
Table 1. US Export Trade to Italy- Product: HSC 30 Pharmaceutical products. 43
Table 2. US Export Trade to Italy- Product: HSC 30 Pharmaceutical products. 44
Table 3. US Import Trade from Italy- Product: HSC 30 Pharmaceutical products. 47
Table 4. US Import Trade from Italy- Product: HSC 30 Pharmaceutical products. 48
Table 5. Italy Import Trade from US- Product: HSC 30 Pharmaceutical products. 54
Table 6. Italy Import Trade from US- Product: HSC 30 Pharmaceutical products. 55
Table 7. Italy Export Trade from US- Product: HSC 30 Pharmaceutical products. 58
Table 8. Italy Export Trade to US- Product: HSC 30 Pharmaceutical products. 59
Table 9. List of Magazines, Publications, Universities, and Online Portals. 61
Table 10. List of Events. 65
Table 11. List of Trade Shows. 67
Table 12. Events and Trade Shows. 68
Table 13. Counts of total nonfatal occupational injuries, illnesses, and respiratory illnesses (private industry, 2018–2022) (Thousand) 110
Table 14. US Pharmaceutical Market, by Product – Revenue and Forecast to 2030 (US$ Billion) 118
Table 15. US Pharmaceuticals Market For Product, by Type – Revenue and Forecast to 2030 (US$ Billion) 118
Table 16. Top Drugs by Price Increase, January and July 2022. 120
Table 17. Top Drugs by Percentage Price Increase, January and July 2022. 121
Table 18. Global Demand of Pharmaceutical (US$ Billion) 123
Table 19. Global Production of Pharmaceutical (US$ Billion) 123
Table 20. Production Size in US (US$ Billion) 123
Table 21. Novel Drug Approvals for 2023. 133
Table 22. Recent Generic Small Molecules Approvals by US FDA. 137
Table 23. Recent Biological and Biosimilar Products Approvals by US FDA. 141
Table 24. Recent Vaccines Approvals by US FDA. 145
Table 25. Recent Inorganic Growth Strategies in the Pharmaceutical Market 149
Table 26. Recent Organic Growth Strategies in the Pharmaceutical Market 151
List of Figures
Figure 1. Pharmaceutical Market Overview.. 17
Figure 2. Small Molecules Segment Held Largest Share of Product Segment in Pharmaceutical Market 17
Figure 3. Pharmaceutical Market – Industry Landscape. 19
Figure 4. Experts’ Opinion. 28
Figure 5. List of supplying markets for pharmaceutical product imported by United States. 37
Figure 6. List of supplying markets for pharmaceutical product imported by United States in US$ Thousand. 38
Figure 7. List of importing markets for a product exported by United States. 40
Figure 8. List of importing markets for a product exported by United States. 41
Figure 9. List of importing markets for a product exported by United States. 42
Figure 10. List of supplying markets for a product imported by Italy. 50
Figure 11. List of supplying markets for a product imported by Italy. 50
Figure 12. List of importing markets for a product exported by Italy. 51
Figure 13. List of importing markets for a product exported by Italy. 52
Figure 14. List of importing markets for a product exported by Italy. 53
Figure 15. Key Trends Impact 108
Figure 16. Key Trends Impact 109
Figure 17. Pharmaceutical Market Impact Analysis of Driver and Restraints. 116
Figure 18. US Pharmaceutical Market – Revenue Forecast and Analysis – 2020–2030. 117
Figure 19. US Branded Small Molecules Market Revenue and Forecast to 2030 (USD Billion) 135
Figure 20. US Generic Small Molecules Market Revenue and Forecast to 2030 (USD Billion) 139
Figure 21. US Biological and Biosimilar Products Market Revenue and Forecast to 2030 (USD Billion) 143
Figure 22. US Biological and Biosimilar Products Market Revenue and Forecast to 2030 (USD Billion) 147
Figure 23. Growth Strategies in the Pharmaceutical Market 148
Yes! We provide a free sample of the report, which includes Report Scope (Table of Contents), report structure, and selected insights to help you assess the value of the full report. Please click on the "Download Sample" button or contact us to receive your copy.
Absolutely - analyst assistance is part of the package. You can connect with our analyst post-purchase to clarify report insights, methodology or discuss how the findings apply to your business needs.
Once your order is successfully placed, you will receive a confirmation email along with your invoice.
• For published reports: You'll receive access to the report within 4-6 working hours via a secured email sent to your email.
• For upcoming reports: Your order will be recorded as a pre-booking. Our team will share the estimated release date and keep you informed of any updates. As soon as the report is published, it will be delivered to your registered email.
We offer customization options to align the report with your specific objectives. Whether you need deeper insights into a particular region, industry segment, competitor analysis, or data cut, our research team can tailor the report accordingly. Please share your requirements with us, and we'll be happy to provide a customized proposal or scope.
The report is available in either PDF format or as an Excel dataset, depending on the license you choose.
The PDF version provides the full analysis and visuals in a ready-to-read format. The Excel dataset includes all underlying data tables for easy manipulation and further analysis.
Please review the license options at checkout or contact us to confirm which formats are included with your purchase.
Our payment process is fully secure and PCI-DSS compliant.
We use trusted and encrypted payment gateways to ensure that all transactions are protected with industry-standard SSL encryption. Your payment details are never stored on our servers and are handled securely by certified third-party processors.
You can make your purchase with confidence, knowing your personal and financial information is safe with us.
Yes, we do offer special pricing for bulk purchases.
If you're interested in purchasing multiple reports, we're happy to provide a customized bundle offer or volume-based discount tailored to your needs. Please contact our sales team with the list of reports you're considering, and we'll share a personalized quote.
Yes, absolutely.
Our team is available to help you make an informed decision. Whether you have questions about the report's scope, methodology, customization options, or which license suits you best, we're here to assist. Please reach out to us at sales@theinsightpartners.com, and one of our representatives will get in touch promptly.
Yes, a billing invoice will be automatically generated and sent to your registered email upon successful completion of your purchase.
If you need the invoice in a specific format or require additional details (such as company name, GST, or VAT information), feel free to contact us, and we'll be happy to assist.
Yes, certainly.
If you encounter any difficulties accessing or receiving your report, our support team is ready to assist you. Simply reach out to us via email or live chat with your order information, and we'll ensure the issue is resolved quickly so you can access your report without interruption.
The Insight Partners performs research in 4 major stages: Data Collection & Secondary Research, Primary Research, Data Analysis and Data Triangulation & Final Review.
- Data Collection and Secondary Research:
As a market research and consulting firm operating from a decade, we have published many reports and advised several clients across the globe. First step for any study will start with an assessment of currently available data and insights from existing reports. Further, historical and current market information is collected from Investor Presentations, Annual Reports, SEC Filings, etc., and other information related to company’s performance and market positioning are gathered from Paid Databases (Factiva, Hoovers, and Reuters) and various other publications available in public domain.
Several associations trade associates, technical forums, institutes, societies and organizations are accessed to gain technical as well as market related insights through their publications such as research papers, blogs and press releases related to the studies are referred to get cues about the market. Further, white papers, journals, magazines, and other news articles published in the last 3 years are scrutinized and analyzed to understand the current market trends.
- Primary Research:
The primarily interview analysis comprise of data obtained from industry participants interview and answers to survey questions gathered by in-house primary team.
For primary research, interviews are conducted with industry experts/CEOs/Marketing Managers/Sales Managers/VPs/Subject Matter Experts from both demand and supply side to get a 360-degree view of the market. The primary team conducts several interviews based on the complexity of the markets to understand the various market trends and dynamics which makes research more credible and precise.
A typical research interview fulfils the following functions:
- Provides first-hand information on the market size, market trends, growth trends, competitive landscape, and outlook
- Validates and strengthens in-house secondary research findings
- Develops the analysis team’s expertise and market understanding
Primary research involves email interactions and telephone interviews for each market, category, segment, and sub-segment across geographies. The participants who typically take part in such a process include, but are not limited to:
- Industry participants: VPs, business development managers, market intelligence managers and national sales managers
- Outside experts: Valuation experts, research analysts and key opinion leaders specializing in the electronics and semiconductor industry.
Below is the breakup of our primary respondents by company, designation, and region:

Once we receive the confirmation from primary research sources or primary respondents, we finalize the base year market estimation and forecast the data as per the macroeconomic and microeconomic factors assessed during data collection.
- Data Analysis:
Once data is validated through both secondary as well as primary respondents, we finalize the market estimations by hypothesis formulation and factor analysis at regional and country level.
- 3.1 Macro-Economic Factor Analysis:
We analyse macroeconomic indicators such the gross domestic product (GDP), increase in the demand for goods and services across industries, technological advancement, regional economic growth, governmental policies, the influence of COVID-19, PEST analysis, and other aspects. This analysis aids in setting benchmarks for various nations/regions and approximating market splits. Additionally, the general trend of the aforementioned components aid in determining the market's development possibilities.
- 3.2 Country Level Data:
Various factors that are especially aligned to the country are taken into account to determine the market size for a certain area and country, including the presence of vendors, such as headquarters and offices, the country's GDP, demand patterns, and industry growth. To comprehend the market dynamics for the nation, a number of growth variables, inhibitors, application areas, and current market trends are researched. The aforementioned elements aid in determining the country's overall market's growth potential.
- 3.3 Company Profile:
The “Table of Contents” is formulated by listing and analyzing more than 25 - 30 companies operating in the market ecosystem across geographies. However, we profile only 10 companies as a standard practice in our syndicate reports. These 10 companies comprise leading, emerging, and regional players. Nonetheless, our analysis is not restricted to the 10 listed companies, we also analyze other companies present in the market to develop a holistic view and understand the prevailing trends. The “Company Profiles” section in the report covers key facts, business description, products & services, financial information, SWOT analysis, and key developments. The financial information presented is extracted from the annual reports and official documents of the publicly listed companies. Upon collecting the information for the sections of respective companies, we verify them via various primary sources and then compile the data in respective company profiles. The company level information helps us in deriving the base number as well as in forecasting the market size.
- 3.4 Developing Base Number:
Aggregation of sales statistics (2020-2022) and macro-economic factor, and other secondary and primary research insights are utilized to arrive at base number and related market shares for 2022. The data gaps are identified in this step and relevant market data is analyzed, collected from paid primary interviews or databases. On finalizing the base year market size, forecasts are developed on the basis of macro-economic, industry and market growth factors and company level analysis.
- Data Triangulation and Final Review:
The market findings and base year market size calculations are validated from supply as well as demand side. Demand side validations are based on macro-economic factor analysis and benchmarks for respective regions and countries. In case of supply side validations, revenues of major companies are estimated (in case not available) based on industry benchmark, approximate number of employees, product portfolio, and primary interviews revenues are gathered. Further revenue from target product/service segment is assessed to avoid overshooting of market statistics. In case of heavy deviations between supply and demand side values, all thes steps are repeated to achieve synchronization.
We follow an iterative model, wherein we share our research findings with Subject Matter Experts (SME’s) and Key Opinion Leaders (KOLs) until consensus view of the market is not formulated – this model negates any drastic deviation in the opinions of experts. Only validated and universally acceptable research findings are quoted in our reports.
We have important check points that we use to validate our research findings – which we call – data triangulation, where we validate the information, we generate from secondary sources with primary interviews and then we re-validate with our internal data bases and Subject matter experts. This comprehensive model enables us to deliver high quality, reliable data in shortest possible time.

Jan 2024
Negative Pressure Wound Therapy Devices Market
Size and Forecast (2021 - 2034), Global and Regional Share, Trend, and Growth Opportunity Analysis Report Coverage: By Product (Conventional NPWT Devices, Single-use NPWT Devices, and NPWT Accessories), Wound Type (Chronic Wounds [Diabetic Foot Ulcers, Pressure Ulcers, Venous Leg Ulcers, and Other Chronic Wounds], Acute Wounds [Surgical and Traumatic Wounds, Burns]), End User (Hospitals, Specialty Clinics, Homecare Settings, and Others), and Geography (North America, Europe, Asia Pacific, Middle East and Africa, and South and Central America)
Jan 2024
Colistin Market
Size and Forecast (2021 - 2034), Global and Regional Share, Trend, and Growth Opportunity Analysis Report Coverage: By Formulation [Injectables (IV or IM), Oral, Topical Formulations, and Inhalation Solutions], Indication [Human Health (Bloodstream Infections (BSI) and Sepsis Lower, Respiratory Tract Infections (LRTI), Urinary Tract Infections (UTIs), Central Nervous System Infections, Skin Infections, Cystic Fibrosis, Tracheobronchitis or VAP, Gastrointestinal Infections, and Bowel Decontamination) and Animal Health], Distribution Channel (Hospital Pharmacy, Retail Pharmacy, Online Channel, and Other Distribution Channels), and Geography (North America, Europe, Asia Pacific, Middle East and Africa, and South and Central America)
Jan 2024
Impulse Oscillometry Market
Size and Forecast (2021 - 2034), Global and Regional Share, Trend, and Growth Opportunity Analysis Report Coverage: By Product (Device and Accessories), Application (Asthma, COPD, and Other Applications), End User (Hospitals and Clinics, Diagnostic Laboratories, and Other End Users), and Geography (North America, Europe, Asia Pacific, Middle East and Africa, and South and Central America)
Jan 2024
Anesthesia Machines Market
Size and Forecast (2021 - 2034), Global and Regional Share, Trend, and Growth Opportunity Analysis Report Coverage: By Product (Advanced Anesthesia Machines, Basic Anesthesia Machines, and Consumables), Customer (Small Hospitals & Nursing Home, Standalone Hospitals, Tertiary Care Hospitals, and Hospital Chain), End User (Anaesthesiologists, Critical Care Specialists, and Others), and Geography (North America, Europe, Asia Pacific, Middle East and Africa, and South and Central America)
Jan 2024
Hospital at Home Market
Size and Forecast (2021 - 2034), Global and Regional Share, Trend, and Growth Opportunity Analysis Report Coverage: By Component (Equipment & Devices and Software & Services), Service Type (Acute Care at Home, Chronic Disease Management at Home, Post Acute or Transitional Care, Palliative Care and Hospice Care, and Rehabilitation Services), Delivery Mode (Remote Monitoring and Telehealth, In-person Home Visits, and Hybrid Models), Patient Demographic ( Adult Patients and Pediatric Patients), Indication (Cardiovascular Conditions, Respiratory Diseases, Orthopedic and Post-Surgical Recovery, Infectious Diseases, Neurological Rehabilitation, and Others), Care Provider (Hospitals and Health Systems, Home Health Agencies, Primary Care or Physician Groups, and Private HaH Providers), and Geography (North America, Europe, Asia Pacific, Middle East and Africa, and South and Central America)
Jan 2024
MRI-guided Focused Ultrasound Therapy Market
Size and Forecast (2021 - 2034), Global and Regional Share, Trend, and Growth Opportunity Analysis Report Coverage: By Application (Breast Cancer, Prostate Cancer, Liver Cancer, Pancreatic Cancer, Breast Lifting and Aesthetic Application, Nipple and Areola Preservation, Post Surgical Applications, and Others), End User (Healthcare Facilities, Diagnostic Imaging Centers, and Research Centers), and Geography (North America, Europe, Asia Pacific, Middle East and Africa, and South and Central America)
Jan 2024
Drug Delivery Devices Contract Manufacturing Market
Size and Forecast (2021 - 2034), Global and Regional Share, Trend, and Growth Opportunity Analysis Report Coverage: By Device Type (Infusion Devices and Administration Set, Syringes, Inhalers, Autoinjectors, and Pen Injectors), Service Type (Full-device Manufacturing, Sub-assembly and Components, and Materials-specific Services), and Geography (North America, Europe, Asia Pacific, Middle East and Africa, and South and Central America)
Jan 2024
IVD Devices Contract Manufacturing Market
Size and Forecast (2021 - 2034), Global and Regional Share, Trend, and Growth Opportunity Analysis Report Coverage: By Service Type (Full-device Manufacturing, Sub-assembly and Components, and Materials-specific Services), Device Type (IVD consumables, IVD equipment), and Geography (North America, Europe, Asia Pacific, Middle East and Africa, and South and Central America)
 Get Free Sample For