贸易促销管理软件市场规模、增长及需求预测(至2034年)
历史数据 : 2021-2024 | 基准年 : 2025 | 预测期 : 2026-2034贸易促销管理软件市场规模及预测(2021-2034 年)、全球及区域份额、趋势和增长机会分析报告涵盖范围:按组件(解决方案和服务)、部署类型(云端和本地部署)、应用(大型企业和中小企业)以及行业垂直领域(零售和消费品、制药、IT 和服务、制造业及其他)划分
- 状态 : 数据发布
- 报告代码 : TIPRE00012304
- 类别 : 科技、媒体和电信
- 页数 : 150
- 可用报告格式 :


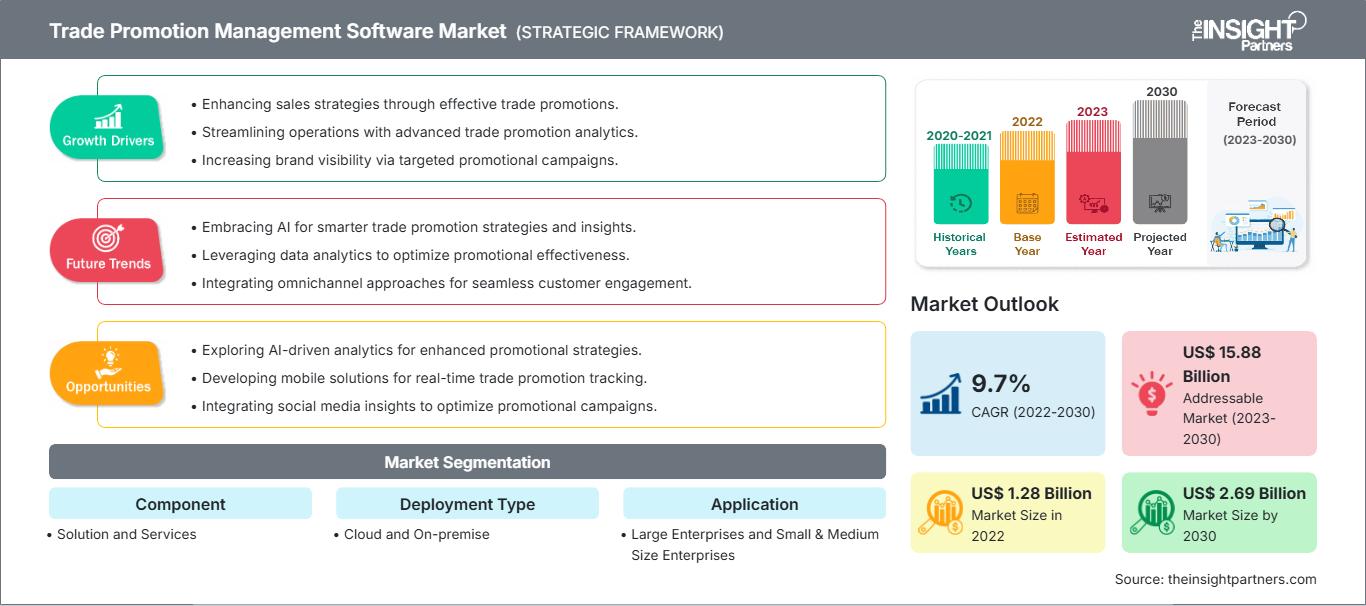
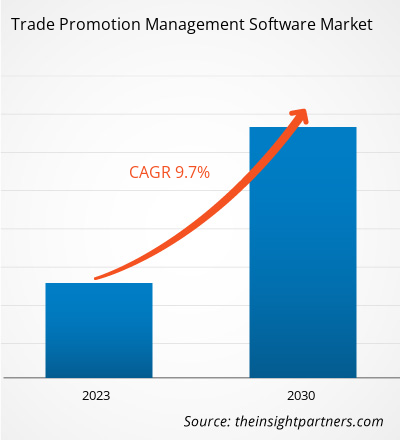
全球贸易促销管理软件市场规模预计将从2025年的15亿美元增长到2034年的48亿美元。预计该市场在2026年至2034年的预测期内将以14.05%的复合年增长率增长。
关键市场动态包括全球对投资回报率衡量指标的日益重视、零售业竞争加剧以及向全渠道零售的显著转变。此外,市场有望受益于对数据驱动型洞察日益增长的需求、新兴经济体云解决方案的扩展,以及人工智能 (AI) 和机器学习 (ML) 在高价值软件领域(用于预测建模和实时决策)的日益普及。
贸易促销管理软件市场分析
贸易促销管理软件市场分析显示,随着企业将实时财务准确性置于周期性计划之上,自主收入管理正成为一种趋势。市场正在分化,一部分是集成生态系统参与者,他们将贸易支出直接与供应链物流连接起来;另一部分是专注于预测提升建模的细分优化专家。针对中小企业的模块化平台正在涌现出战略机遇,通过多租户架构降低高昂的前期实施成本,从而带来明显的竞争优势。分析还指出,市场扩张取决于整合分散的数据孤岛,特别是将内部发货数据与外部电子销售点 (ePoS) 指标相结合。如今,品牌塑造凸显了自动化扣款管理、无缝 ERP 连接以及通过移动现场工具跟踪促销合规性等优势,从而实现差异化竞争。这种方法有助于供应商在企业对贸易支出管理不善导致的业绩不满的市场中,与客户建立长期合作关系。
贸易促销管理软件市场概览
贸易促销系统已从静态的记录数据库发展成为动态的决策支持引擎。贸易促销管理软件包含集成的贸易促销优化 (TPO) 套件、人工智能辅助的需求预测和自动化结算流程。全球技术领导者和敏捷的 SaaS 初创公司都在该市场展开竞争,利用自然语言处理 (NLP) 和机器人流程自动化 (RPA) 的进步来简化复杂的资金管理任务。北美和欧洲制造商对财务收益透明度的需求日益增长,使得 TPM 软件作为保护运营利润率的关键解决方案而广受欢迎。北美地区凭借大型消费品企业的高度集中和先进的技术基础设施,在收入方面领先,而亚太地区则在零售数字化和移动优先的促销执行方面取得了进展。美国市场仍然是主要的创新者,这得益于高促销压力和零售媒体网络的普及。品牌之间的竞争促使零售销售分析和天气分析的整合更加深入,以便在促销高峰期更准确地预测消费者行为。
根据您的需求定制此报告
获取免费定制服务贸易促销管理软件市场:战略洞察
-
获取本报告的主要市场趋势。这份免费样品将包含数据分析,内容涵盖市场趋势、估算和预测等。
贸易促销管理软件市场驱动因素和机遇
市场驱动因素:
- 对个性化的需求日益增长:消费者现在期望根据个人需求获得有针对性的激励措施,这促使企业采用 TPM 工具来制定和跟踪高度本地化的促销活动。
- 全渠道零售的复杂性:多平台商务的兴起需要整合战略,将数字货架和实体货架连接起来,确保所有渠道的价格和品牌信息保持一致。
- 人工智能/机器学习的技术进步:现代软件具有预测分析功能,可以模拟多种场景,从而显著提高容量阶段划分和基线管理的准确性。
市场机遇:
- 贸易结算自动化:除了规划之外,索赔和退款流程的自动化也蕴藏着巨大的机遇,而目前这对于许多财务团队来说仍然是一项人工操作且容易出错的负担。
- 拓展新兴市场:在亚太和南美洲建立战略伙伴关系,有助于进入快速增长的市场,在这些市场中,有组织的零售业才刚刚开始规范其贸易机制。
- 中小企业数字化转型:开发入门级云优先解决方案,旨在开拓小型品牌这一尚未开发的市场,帮助他们摆脱基于电子表格的管理方式。
贸易促销管理软件市场报告细分分析
贸易促销管理软件市场份额按多个细分市场进行分析,以便更清晰地了解其结构、增长潜力和新兴趋势。以下是大多数行业报告中使用的标准细分方法:
按组件:
- 解决方案:主要收入驱动因素,包括用于基金管理、账户规划和事后分析的核心软件套件。
- 服务:一个快速增长的领域,专注于咨询、技术支持和实施培训,以帮助组织管理向数据驱动规划的文化转变。
按部署类型:
- 云计算:增长最快且占据主导地位的部署模式(约占 64%–68% 的份额),因其可扩展性、较低的前期成本和实时数据访问性而备受青睐。
- 本地部署:某些受监管行业或拥有庞大传统基础设施的大型组织更倾向于选择本地部署,以实现对数据主权的完全控制。
按申请方式:
- 大型企业:拥有最大的市场份额(约 72%),管理着庞大的促销日程和复杂的全球分销网络。
- 中小企业 (SME):增长最快的用户群体,采用模块化工具来提高零售执行合规性并与大品牌竞争。
按行业垂直领域划分:
- 零售和消费品:最大的细分市场,利用 TPM 进行杂货店、药店和便利店的促销活动。
- 制药行业:快速增长的采用者,使用软件来管理供需权衡和高价值的机构合同。
- IT 和服务:利用 TPM 逻辑进行基于服务的促销和忠诚度计划。
- 制造:利用工具管理复杂分销商网络中的间接定价和贸易支出。
按地理位置:
- 北美
- 欧洲
- 亚太地区
- 南美洲和中美洲
- 中东和非洲
贸易促销管理软件市场报告范围
| 报告属性 | 细节 |
|---|---|
| 2025年市场规模 | 15亿美元 |
| 到2034年市场规模 | 48亿美元 |
| 全球复合年增长率(2026-2034 年) | 14.05% |
| 史料 | 2021-2024 |
| 预测期 | 2026-2034 |
| 涵盖部分 |
按组件
|
| 覆盖地区和国家 |
北美
|
| 市场领导者和主要公司简介 |
|
贸易促销管理软件市场参与者密度:了解其对业务动态的影响
贸易促销管理软件市场正快速增长,这主要得益于终端用户需求的不断增长,而终端用户需求的增长又源于消费者偏好的转变、技术的进步以及消费者对产品优势认知的提高。随着需求的增长,企业不断拓展产品和服务,持续创新以满足消费者需求,并把握新兴趋势,这些都进一步推动了市场增长。
按地域划分的贸易促销管理软件市场份额分析
预计未来几年亚太地区将实现最快增长。南美和中美洲、中东和非洲等新兴市场也为零售技术供应商和制造商提供了许多尚未开发的扩张机会。
贸易促销管理软件市场正经历着一场重大变革,从传统的行政工具向全球高价值战略引擎转型。全渠道零售日益复杂化、对实时投资回报率透明度的需求激增以及数字商务领域的扩张是推动市场增长的主要因素。以下是按地区划分的市场份额和趋势概述:
北美
- 市场份额:在全球市场占据主导地位,这得益于成熟的零售生态系统和财富 500 强消费品领导者的高度集中。
-
关键驱动因素:
- 美国消费者在食品杂货和家居用品上的支出很高。
- 零售媒体网络(RMN)的主流化需要整合推广计划。
- 可口可乐、百事可乐和宝洁等行业巨头对先进的云技术进行了大量投资。
- 趋势:快速采用垂直人工智能层,将中央贸易计划直接连接到一线执行,确保店内合规性的一致性。
欧洲
- 市场份额:在英国、德国和法国多元化且分散的零售市场中占据相当大的市场份额。
-
关键驱动因素:
- 严格的数据隐私和贸易透明度监管框架。
- 战略转向供应链多元化,以降低地缘政治紧张局势带来的风险。
- 跨境促销管理对多币种和多语言支持的需求强劲。
- 趋势:越来越注重与可持续发展相关的促销活动,并在贸易管理中采用有机认证,以满足具有环保意识的消费者的需求。
亚太
- 市场份额:增长最快的地区,中国和印度是零售数字化的主要驱动力。
-
关键驱动因素:
- 庞大的消费群体正在通过超级应用程序寻求本地化、高度个性化的数字激励。
- 快速的城市化和政府支持的数字贸易走廊(例如,印度-美国供应链弹性协议)。
- 对移动优先的现场执行工具的需求很高,以便管理分散的小型零售网络。
- 趋势:在新兴城市中心,大力依赖基于云的 SaaS 模型和 B2B 数字市场来扩大促销活动规模。
南美洲和中美洲
- 市场份额:新兴市场,例如巴西和阿根廷等国的现代零售业正在蓬勃发展。
-
关键驱动因素:
- 本地消费品品牌寻求现代化,以摆脱传统电子表格的束缚,实现贸易支出的专业化管理。
- 提高人们对自动扣款管理所带来的投资回报率的认识。
- 趋势:移动销售自动化发展,以及面向中型本地制造商的入门级TPM模块的推出。
中东和非洲
- 市场份额:具有未开发潜力的发展中市场,正在从手工非正式贸易向正规化商业结构转型。
-
关键驱动因素:
- 对智能零售基础设施进行战略投资,以改善当地粮食安全和经济多元化。
- 在物流网络不断发展的干旱气候地区,对可扩展的云解决方案有着很高的需求。
- 趋势:实施现代监管科技和数字备案技术,使贸易协定正式化并降低行政成本。
市场密度高,竞争激烈
由于SAP SE、Oracle Corporation和Salesforce等老牌领导者的存在,市场竞争日益激烈。UpClear、Aforza和Anaplan等细分领域的专家和创新者也为多元化且快速扩张的市场格局做出了贡献。
这种竞争环境促使供应商通过以下方式实现差异化:
- 预测场景建模:允许用户在批准支出之前,对每个广告系列测试 8-15 个不同的变量。
- 集成供应链可视性:将促销量预测直接与仓库和生产计划联系起来。
- 自动化数据协调:将来自多个零售商的非结构化数据清洗和整理成一个单一的、可审计的记录系统。
机遇与战略举措
- 与高端零售渠道和电子商务平台合作,以满足亚太和北美市场对个性化、无乳糖(无错误)和手工制作贸易策略的激增需求。
- 将可持续农业实践(例如再生人工智能认证)纳入数据处理,以吸引具有环保意识的千禧一代和寻求符合道德和透明贸易替代方案的 Z 世代管理者。
贸易促销管理软件市场的主要公司有:
- 威普罗有限公司
- PSignite集团公司
- Aera Technology
- 泰勒斯
- o9 Solutions, Inc.
- 甲骨文公司
- SAP SE
- UpClear
- Anaplan公司
- 阿福扎公司
免责声明:以上列出的公司不分先后顺序。
贸易促销管理软件市场新闻及最新动态
- 2026年1月,领先的软件公司o9(凭借其突破性的AI驱动型数字大脑平台,为30多个行业的企业规划和决策模型提供支持)宣布扩展其面向食品零售行业的品类管理解决方案。该解决方案提供新一代规划功能,以满足市场对更互联、数据驱动型商业决策日益增长的需求。
- 2025年4月,Oracle在Oracle Fusion Cloud供应链与制造(SCM)解决方案中新增了贸易管理功能,旨在帮助企业应对进口关税和贸易协定的复杂性。Oracle Fusion Cloud全球贸易管理的最新更新使客户能够实现全球供应链流程自动化、提高订单发货的可视性并增强供应链决策能力。
贸易促销管理软件市场报告涵盖范围及成果
《贸易促销管理软件市场规模及预测(2021-2034)》报告对市场进行了详细分析,涵盖以下领域:
- 本报告涵盖了全球、区域和国家层面的所有关键市场细分领域的市场规模和预测。
- 市场趋势以及市场动态,例如驱动因素、制约因素和关键机遇
- 详细的PEST和SWOT分析
- 市场分析涵盖关键市场趋势、全球和区域框架、主要参与者、法规以及近期市场发展动态。
- 贸易促销管理软件市场的行业格局和竞争分析,包括市场集中度、热力图分析、主要参与者和最新发展。
- 公司详细概况

Ankita 是一位充满活力的市场研究和咨询专家,在科技、媒体、信息通信技术 (ICT) 以及电子和半导体领域拥有超过 8 年的经验。她成功领导并完成了 100 多项咨询和研究项目,服务对象包括微软、甲骨文、NEC Corporation、SAP、毕马威和 Expeditors International 等全球客户。她的核心能力包括市场评估、数据分析、预测、战略制定、竞争情报和报告撰写。
Ankita 擅长处理完整的项目周期——从售前的方案设计和客户洽谈,到售后提供切实可行的洞察。她擅长管理跨职能团队、构建复杂的研究模块,并根据客户特定的业务目标调整解决方案。她卓越的沟通能力、领导能力和演讲能力使她能够在快速变化的市场环境中持续提供价值驱动的成果。
- 历史分析(2 年)、基准年、预测(7 年)及复合年增长率
- PEST和SWOT分析
- 市场规模、价值/数量 - 全球、区域、国家
- 行业和竞争格局
- Excel 数据集
客户评价
Insight Partners 的 SCADA 系统市场报告内容全面,对当前趋势和未来预测提供了宝贵的见解。该团队始终高度专业、响应迅速且乐于助人。我们非常满意,强烈推荐他们的服务。
兰·凯德姆 伙伴, Reali Technologies LTD我请求一份关于特定软件市场的报告,团队在几天内就完成了。报告信息非常相关,而且呈现得非常出色。之后,我请求对报告进行一些修改和补充。团队再次迅速响应,不到一周我就收到了最终报告。
让-埃尔韦·詹恩 主席, 未来分析公司我们与 Insight Partners 合作进行了一项重要的市场研究和预测。他们清晰地洞察了机遇和风险,帮助我们制定了计划。他们的研究简单易用,数据可靠,帮助我们做出了明智而自信的决策。我们强烈推荐他们。
皮尤什·纳格帕尔 高级副总裁, 远光全球Insight Partners 凭借其深厚的行业专业知识,提供了富有洞察力、结构合理的市场研究。他们的团队始终专业且响应迅速。用户友好的网站让访问行业报告变得顺畅无阻。我们强烈推荐他们可靠、高质量的研究服务。
安达幸彦 首席执行官, 深蓝有限责任公司这是我第一次从The Insight Partners购买市场报告。起初我有些犹豫,但访问了他们的网站后,我更放心地冒险购买市场报告。我对报告的质量和客户服务非常满意。我对最初的报告有一些疑问和意见,但在与他们的分析师通过电子邮件沟通了几次后,我相信这份报告可以作为我们战略规划流程的参考。非常感谢您抽出宝贵的时间,让这次体验如此愉快。我一定会向其他人推荐你们的服务,当我们需要更多市场数据时,你们将是我的首选。
约翰·铃木 总裁兼首席执行官、董事会董事, BK科技感谢您在处理我关于尼日利亚传染病体外诊断市场信息请求的过程中所展现的支持和专业精神。感谢您的耐心、指导,以及您愿意提供的折扣,最终促成了这笔交易。我期待未来与 Insight Partners 继续合作,这一切都要归功于您与我初次接触后留下的良好印象。
奇吉奥克博士 ONYIA 董事总经理, PineCrest 医疗保健有限公司购买理由
- 明智的决策
- 了解市场动态
- 竞争分析
- 客户洞察
- 市场预测
- 风险规避
- 战略规划
- 投资论证
- 识别新兴市场
- 优化营销策略
- 提升运营效率
- 顺应监管趋势


 获取免费样品 - 贸易促销管理软件市场