
トレードプロモーション管理ソフトウェア市場の規模、成長、需要(2034年まで)
貿易促進管理ソフトウェア市場規模と予測(2021年~2034年)、世界および地域別シェア、トレンド、成長機会分析レポートの対象範囲:コンポーネント別(ソリューションとサービス)、展開タイプ別(クラウドとオンプレミス)、アプリケーション別(大企業と中小企業)、および業界別(小売・消費財、製薬、IT・サービス、製造業、その他)
- ステータス : 公開されたデータ
- レポートコード : TIPRE00012304
- カテゴリー : テクノロジー、メディア、通信
- ページ数 : 150
- 利用可能なレポート形式 :


- 最終更新日 : March 18, 2026

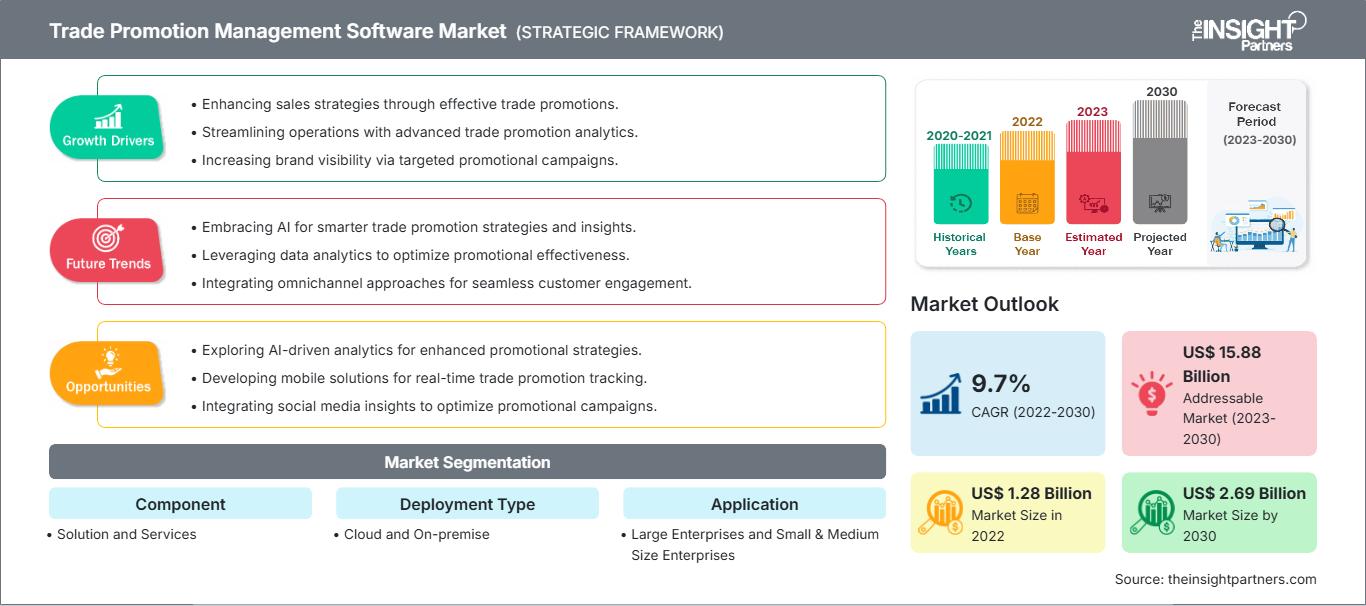
世界の貿易促進管理ソフトウェア市場規模は、2025年の15億米ドルから2034年には48億米ドルに達すると予測されています。同市場は、2026年から2034年の予測期間中に年平均成長率(CAGR)14.05%を記録すると予想されています。
市場の主要な動向としては、ROI測定に対する世界的な注目度の高まり、小売業界における競争の激化、そしてオムニチャネル小売への大きなシフトが挙げられます。さらに、データ駆動型インサイトへの需要の高まり、新興国におけるクラウドベースソリューションの拡大、そして予測モデリングやリアルタイム意思決定のための高付加価値ソフトウェア分野における人工知能(AI)と機械学習(ML)の導入拡大も、市場の成長に貢献すると予想されます。
貿易促進管理ソフトウェア市場分析
販売促進管理ソフトウェア市場の分析によると、企業が定期的な計画よりもリアルタイムの財務精度を優先するにつれ、自律的な収益管理への移行が進んでいることが明らかになりました。市場は、販売促進費をサプライチェーン物流に直接接続する統合エコシステムプレーヤーと、予測リフトモデリングのみに特化したニッチ最適化スペシャリストに二分されています。中小企業向けのモジュール型プラットフォームでは、マルチテナントアーキテクチャによる高額な初期導入コストの削減が明確な競争優位性をもたらすため、戦略的な機会が生まれています。また、この分析では、市場の拡大は、ばらばらのデータサイロの調和、特に社内出荷データと外部の電子POS(ePoS)指標の統合にかかっていると指摘しています。現在、競争上の差別化は、自動控除管理、シームレスなERP接続、モバイルフィールドツールによる販売促進コンプライアンスの追跡機能を強調するブランディングによって際立っています。このアプローチは、管理されていない販売促進費の結果に不満を抱く組織が多い市場において、ベンダーが長期的なパートナーシップを確保するのに役立ちます。
貿易促進管理ソフトウェア市場の概要
販売促進システムは、静的な記録管理データベースから動的な意思決定支援エンジンへと進化しました。販売促進管理ソフトウェアには、統合されたTPO(販売促進最適化)スイート、AI支援による需要予測、自動決済ワークフローが含まれています。この市場では、グローバルなテクノロジーリーダーとアジャイルなSaaSスタートアップの両方が、自然言語処理(NLP)とロボティックプロセスオートメーション(RPA)の進歩を利用して複雑な資金管理タスクを簡素化し、競争しています。北米とヨーロッパの製造業者の間で財務計上の透明性に対する需要が高まっていることから、営業利益率を保護するための重要なソリューションとしてTPMソフトウェアの人気が高まっています。北米は、大規模なCPG企業の密度が高く、高度な技術インフラがあるため、収益でリードしていますが、アジア太平洋地域は小売のデジタル化とモバイルファーストのプロモーション実行で進歩しています。米国市場は、高いプロモーション圧力と小売メディアネットワークの主流化によって、依然として主要なイノベーターです。ブランド間の競争により、小売販売分析と気象分析との統合が進み、プロモーションのピーク期間中の消費者の行動をより正確に予測しています。
お客様のご要望に合わせてこのレポートをカスタマイズしてください
無料カスタマイズ貿易促進管理ソフトウェア市場:戦略的洞察
-
本レポートの主要市場トレンドをご覧ください。この無料サンプルには、市場動向から予測、見通しまで、幅広いデータ分析が含まれています。
貿易促進管理ソフトウェア市場の推進要因と機会
市場の推進要因:
- パーソナライゼーションへの需要の高まり:消費者は個々のニーズに基づいたターゲットを絞ったインセンティブを期待するようになり、企業は超地域密着型のプロモーションを策定・追跡できるTPMツールを採用するようになっている。
- オムニチャネル小売の複雑性:マルチプラットフォームコマースの台頭に伴い、デジタルと実店舗の両方にまたがる統合的な戦略が必要となり、すべてのチャネルで一貫した価格設定とブランドメッセージングが確保される。
- AI/MLにおける技術進歩:最新のソフトウェアは、複数のシナリオをシミュレートできる予測分析機能を備えており、ボリュームフェーズとベースライン管理の精度を大幅に向上させています。
市場機会:
- 取引決済の自動化:計画策定にとどまらず、請求および払い戻しプロセスを自動化することには大きなチャンスがあります。現状では、多くの財務チームにとって、このプロセスは手作業で行われ、エラーが発生しやすい負担となっています。
- 新興市場への進出:アジア太平洋地域および南米における戦略的パートナーシップは、組織的な小売業が貿易メカニズムを正式に確立し始めたばかりの、急速に成長している地域へのアクセスを容易にする。
- 中小企業向けデジタルトランスフォーメーション:エントリーレベルのクラウドファーストソリューションを開発することで、スプレッドシートベースの管理から脱却しようとしている、これまで開拓されていなかった小規模ブランド層をターゲットにする。
貿易促進管理ソフトウェア市場レポートのセグメンテーション分析
貿易促進管理ソフトウェア市場の市場シェアは、その構造、成長可能性、および新たなトレンドをより明確に理解するために、さまざまなセグメントにわたって分析されます。以下は、ほとんどの業界レポートで使用されている標準的なセグメンテーション手法です。
コンポーネント別:
- 解決策:主な収益源となるのは、ファンド管理、口座計画、イベント後の分析のためのコアソフトウェアスイートです。
- サービス:コンサルティング、技術サポート、導入トレーニングに重点を置いた、急速に成長している分野であり、組織がデータ主導型計画への文化的な変化に対応できるよう支援します。
展開タイプ別:
- クラウド:最も急速に成長し、支配的な導入形態(シェア約64%~68%)。拡張性、初期費用の低さ、リアルタイムでのデータアクセス性といった利点から好まれている。
- オンプレミス:特定の規制対象分野や、広範なレガシーインフラストラクチャを抱え、データ主権を完全に制御したい大規模組織に好まれます。
申請方法:
- 大企業:最大の市場シェア(約72%)を占め、膨大なプロモーションカレンダーと複雑なグローバル流通ネットワークを管理している。
- 中小企業(SME):最も急速に成長しているユーザーグループであり、小売業務のコンプライアンスを向上させ、大手ブランドと競争するためにモジュール型ツールを採用している。
業界別:
- 小売・消費財:最大のセグメントであり、食料品店、ドラッグストア、コンビニエンスストアのプロモーションにTPMを活用している。
- 製薬業界:需要と供給のトレードオフや高額な機関契約を管理するためにソフトウェアを導入している、急速に成長している企業。
- ITおよびサービス:サービスベースのプロモーションおよびロイヤルティプログラムにTPMロジックを活用する。
- 製造業:複雑な販売代理店ネットワーク全体にわたる間接価格設定と取引支出を管理するためのツールを活用する。
地域別:
- 北米
- ヨーロッパ
- アジア太平洋地域
- 南米および中央アメリカ
- 中東・アフリカ
貿易促進管理ソフトウェア市場レポートの範囲
| レポート属性 | 詳細 |
|---|---|
| 2025年の市場規模 | 15億米ドル |
| 2034年までの市場規模 | 48億米ドル |
| 世界の年間平均成長率(2026年~2034年) | 14.05% |
| 履歴データ | 2021年~2024年 |
| 予測期間 | 2026年~2034年 |
| 対象分野 |
コンポーネント別
|
| 対象地域および国 |
北米
|
| 市場リーダーと主要企業の概要 |
|
貿易促進管理ソフトウェア市場のプレーヤー密度:ビジネスダイナミクスへの影響を理解する
販売促進管理ソフトウェア市場は、消費者の嗜好の変化、技術革新、製品のメリットに対する認識の高まりといった要因によるエンドユーザー需要の増加を背景に、急速に成長しています。需要の高まりに伴い、企業は提供する製品やサービスを拡大し、消費者のニーズに応えるべく革新を進め、新たなトレンドを活用することで、市場の成長をさらに加速させています。
地域別貿易促進管理ソフトウェア市場シェア分析
アジア太平洋地域は今後数年間で最も急速な成長が見込まれる。南米・中米、中東、アフリカの新興市場にも、小売テクノロジープロバイダーやメーカーにとって、事業拡大のための未開拓の機会が数多く存在する。
販売促進管理ソフトウェア市場は、従来の管理ツールからグローバルな高付加価値戦略エンジンへと大きく変革を遂げています。この成長は、オムニチャネル小売の複雑化、リアルタイムROI透明性への需要の高まり、そしてデジタルコマース分野の拡大によって牽引されています。以下に、地域別の市場シェアとトレンドの概要を示します。
北米
- 市場シェア:成熟した小売エコシステムと、フォーチュン500に名を連ねる消費財大手企業の集中度の高さに支えられ、世界市場を席巻している。
-
主な推進要因:
- 特に米国において、食料品や家庭用品への消費支出が高い。
- 統合的なプロモーション計画を必要とする小売メディアネットワーク(RMN)の主流化。
- コカ・コーラ、ペプシコ、プロクター・アンド・ギャンブルといった業界大手による、高度なクラウド機能への多額の投資。
- トレンド:中央の販売計画と最前線の実行を直接接続し、店舗での一貫したコンプライアンスを確保する垂直型AIレイヤーの急速な普及。
ヨーロッパ
- 市場シェア:英国、ドイツ、フランスにまたがる多様で細分化された小売市場を基盤として、相当なシェアを占めている。
-
主な推進要因:
- データプライバシーと貿易透明性に関する厳格な規制枠組み。
- 地政学的緊張によるリスクを軽減するため、サプライチェーンの多様化に向けた戦略的転換を図る。
- 国境を越えたプロモーションを管理するために、複数通貨および複数言語対応に対する強い需要がある。
- トレンド:環境意識の高い消費者のニーズに応えるため、持続可能性に関連したプロモーションへの注目が高まり、貿易管理において有機認証の導入が進んでいる。
アジア太平洋
- 市場シェア:最も急速に成長している地域であり、中国とインドが小売業のデジタル化を牽引する主要な原動力となっている。
-
主な推進要因:
- 膨大な数の消費者が、スーパーアプリを通じて地域に特化した、高度にパーソナライズされたデジタル特典を求めている。
- 急速な都市化と政府支援によるデジタル貿易回廊(例:インド・米国間のサプライチェーン強靭性協定)。
- 断片化された小規模小売店ネットワークを管理するための、モバイルファーストの現場実行ツールに対する需要が高い。
- トレンド:新興都市部における販促活動の規模拡大のため、クラウドベースのSaaSモデルとB2Bデジタルマーケットプレイスへの依存度が高まっている。
南米および中央アメリカ
- 市場シェア:ブラジルやアルゼンチンなどの国々で、現代的な小売産業が成長している新興市場。
-
主な推進要因:
- 従来の表計算ソフトにとらわれず、販促費の支出を専門化しようとする、地元の消費財ブランドの近代化。
- 自動控除管理によって得られる投資対効果(ROI)のメリットに対する認識を高める。
- トレンド:モバイルベースの営業支援システムの普及と、中規模の国内製造業者向けエントリーレベルのTPMモジュールの導入。
中東およびアフリカ
- 市場シェア:未開拓の潜在力を持つ発展途上市場であり、手作業による非公式な取引から正式な商業構造への移行が進んでいる。
-
主な推進要因:
- 地域における食料安全保障の向上と経済の多角化を図るため、スマート小売インフラへの戦略的な投資を行う。
- 乾燥地帯における物流ネットワークの進化に伴い、拡張性の高いクラウドソリューションへの需要が高まっている。
- トレンド:貿易協定を正式なものとし、事務手続きの負担を軽減するために、最新のレグテック(規制技術)やデジタルファイリング技術が導入されている。
市場密度の高さと競争の激しさ
SAP SE、Oracle Corporation、Salesforceといった既存の大手企業の存在により、競争は激化している。UpClear、Aforza、Anaplanといったニッチ分野の専門家やイノベーターも、多様化し急速に拡大する市場環境に貢献している。
このような競争環境は、ベンダーに以下の方法で差別化を図るよう促します。
- 予測シナリオモデリング:ユーザーが支出を承認する前に、キャンペーンごとに8~15種類の異なる変数をテストできる機能を提供します。
- 統合されたサプライチェーンの可視化:販促品の販売量予測を倉庫および生産スケジュールに直接連携させる。
- 自動データ統合:複数の小売業者から収集された非構造化データを、単一の監査可能な記録システムに整理・統合します。
機会と戦略的動き
- アジア太平洋地域および北米市場における、パーソナライズされた、乳糖不耐症対応(エラーのない)、そして職人技による製品に対する需要の高まりに対応するため、高級小売チャネルやeコマースプラットフォームと提携する。
- 環境意識の高いミレニアル世代やZ世代の経営者が求める倫理的で透明性の高い貿易代替手段にアピールするため、再生型AI認証などの持続可能な農業手法をデータに取り入れる。
貿易促進管理ソフトウェア市場で事業を展開する主要企業は以下のとおりです。
- ウィプロ株式会社
- PSignite Group Inc
- Aera Technology
- TELUS
- o9ソリューションズ株式会社
- オラクル社
- SAP SE
- アップクリア
- アナプラン社
- アフォルザ株式会社
免責事項:上記に掲載されている企業は、特定の順序でランク付けされているわけではありません。
貿易促進管理ソフトウェア市場のニュースと最新動向
- 2026年1月、o9(画期的なAI搭載デジタルブレインプラットフォームで30以上の業界にわたる企業計画および意思決定モデルを支える大手ソフトウェア企業)は、食料品小売業向けカテゴリー管理ソリューションの拡張を発表しました。このソリューションは、より連携のとれたデータ駆動型の商業的意思決定に対する市場の需要の高まりに対応するため、次世代の計画機能を提供します。
- 2025年4月、オラクルはOracle Fusion Cloud Supply Chain & Manufacturing (SCM)に新たな貿易管理機能を追加し、企業が輸入関税や貿易協定の複雑さを管理できるよう支援しました。Oracle Fusion Cloud Global Trade Managementの最新アップデートにより、顧客はグローバルサプライチェーンプロセスの自動化、注文出荷状況の可視性の向上、サプライチェーンにおける意思決定の強化が可能になります。
貿易促進管理ソフトウェア市場レポートの対象範囲と成果物
「貿易促進管理ソフトウェア市場規模と予測(2021年~2034年)」レポートは、以下の分野を網羅した市場の詳細な分析を提供します。
- 調査範囲に含まれるすべての主要市場セグメントについて、世界、地域、国レベルでの市場規模と予測
- 市場動向、および推進要因、阻害要因、主要な機会などの市場ダイナミクス
- 詳細なPEST分析とSWOT分析
- 主要な市場動向、世界および地域的な枠組み、主要企業、規制、および最近の市場動向を網羅した市場分析
- 貿易促進管理ソフトウェア市場における市場集中度、ヒートマップ分析、主要企業、および最近の動向を網羅した業界概況と競争分析。
- 詳細な企業プロフィール

アンキタは、テクノロジー、メディア、ICT、エレクトロニクス・半導体の各分野で8年以上の経験を持つ、ダイナミックな市場調査およびコンサルティングのプロフェッショナルです。Microsoft、Oracle、NEC、SAP、KPMG、Expeditors Internationalといったグローバルクライアントに対し、100件以上のコンサルティングおよび調査案件を主導・遂行してきました。彼女のコアコンピテンシーは、市場評価、データ分析、予測、戦略策定、競合情報、レポート作成です。
アンキタは、販売前の提案書作成やクライアントとの協議から、販売後の実用的なインサイトの提供まで、プロジェクトサイクル全体を巧みに管理することに長けています。彼女は、部門横断的なチームの管理、複雑な調査モジュールの構築、そしてクライアント固有のビジネス目標に合わせたソリューションの調整に長けています。優れたコミュニケーション能力、リーダーシップ、そしてプレゼンテーション能力により、急速に変化する市場環境において、常に価値主導の成果を生み出しています。
- 包括的な市場規模および予測分析
- 詳細なセグメンテーション分析
- 市場動向(ダイナミクス)の徹底的な評価
- 地域および国別のインサイト
- 競争環境および企業ベンチマーク
- 戦略的ビジネスインテリジェンス
お客様の声
Insight PartnersのSCADAシステム市場レポートは包括的で、現在のトレンドと将来の予測に関する貴重な洞察が含まれています。チームは終始、非常にプロフェッショナルで、対応が早く、サポートも充実していました。私たちは彼らのサービスに非常に満足しており、強くお勧めします。
ラン・ケデム パートナー, レアリテクノロジーズ株式会社非常に特殊なソフトウェア市場に関するレポートを依頼したところ、チームは数日でレポートを作成してくれました。情報は非常に関連性が高く、分かりやすくまとめられていました。その後、レポートにいくつか修正と追加を依頼しましたが、チームは非常に迅速に対応し、1週間も経たないうちに最終レポートを受け取ることができました。
ジャン=エルヴェ・ジェン 会長, フューチャー・アナリティカ重要な市場調査と予測のために、The Insight Partnersと協力しました。彼らは機会とリスクに関する明確な洞察を提供し、私たちの計画策定に役立ちました。彼らの調査は使いやすく、確かなデータに基づいており、賢明で自信に満ちた意思決定に役立ちました。彼らを強くお勧めします。
ピユーシュ・ナグパル 上級副社長, ハイビームグローバルInsight Partnersは、深い専門知識に基づき、洞察力に富み、構造化された市場調査を提供しました。チームは終始プロフェッショナルで、対応力も抜群でした。ユーザーフレンドリーなウェブサイトにより、業界レポートへのアクセスもスムーズでした。信頼性の高い高品質な調査サービスをお探しなら、Insight Partnersを強くお勧めします。
安達幸彦 最高経営責任者(CEO), ディープブルーLLC。The Insight Partnersから市場レポートを購入するのは今回が初めてです。最初は不安でしたが、ウェブサイトを見て、リスクを負ってでも購入してみようという気持ちになりました。レポートの品質とカスタマーサービスには大変満足しています。最初のレポートにはいくつか質問やコメントがありましたが、アナリストとメールで何度かやり取りした結果、戦略策定プロセスへのインプットとして活用できるレポートが完成しました。貴重なお時間を割いていただき、貴重な体験をさせていただき、誠にありがとうございました。他の方にもぜひお勧めしたいですし、今後さらに市場データが必要になった際には、まずThe Insight Partnersにご連絡させていただきます。
ジョン・スズキ 社長兼最高経営責任者、取締役, BKテクノロジーズナイジェリアの感染症IVD市場に関する情報提供依頼に対し、ご対応いただいた際、ご尽力とプロフェッショナルな姿勢に深く感謝申し上げます。忍耐強く、的確なアドバイスをいただき、また、最終的に取引成立に至った割引のご提供にも深く感謝申し上げます。今回の最初の出会いで得た強い印象のおかげで、今後もThe Insight Partnersとの連携を心待ちにしております。
チジオケ博士 オニア マネージングディレクター, パインクレストヘルスケア株式会社購入理由
- 情報に基づいた意思決定
- 市場動向の理解
- 競合分析
- 顧客インサイト
- 市場予測
- リスク軽減
- 戦略計画
- 投資の正当性
- 新興市場の特定
- マーケティング戦略の強化
- 業務効率の向上
- 規制動向への対応


