سوق FPSO – المحركات والاتجاهات والفرص وإحصاءات النمو | 2031
البيانات التاريخية : 2021-2022 | سنة الأساس : 2023 | فترة التنبؤ : 2024-2031حجم سوق FPSO وتوقعاته (2021-2031)، والحصة العالمية والإقليمية، والاتجاهات، وفرص النمو، وتغطية تقرير تحليلي: حسب عمق المياه [المياه الضحلة، والمياه العميقة، والمياه العميقة جدًا]، والهيكل [الهيكل الفردي والهيكل المزدوج]، والرسو [الرسو المنتشر والرسو المنفصل]، والبناء [البناء الحديث والمُحوّل] والجغرافيا.
- تاريخ التقرير : Feb 2026
- رمز التقرير : TIPRE00027554
- الفئة : الطاقة والقوة
- الحالة : البيانات الصادرة
- تنسيقات التقارير المتاحة :


- عدد الصفحات : 150
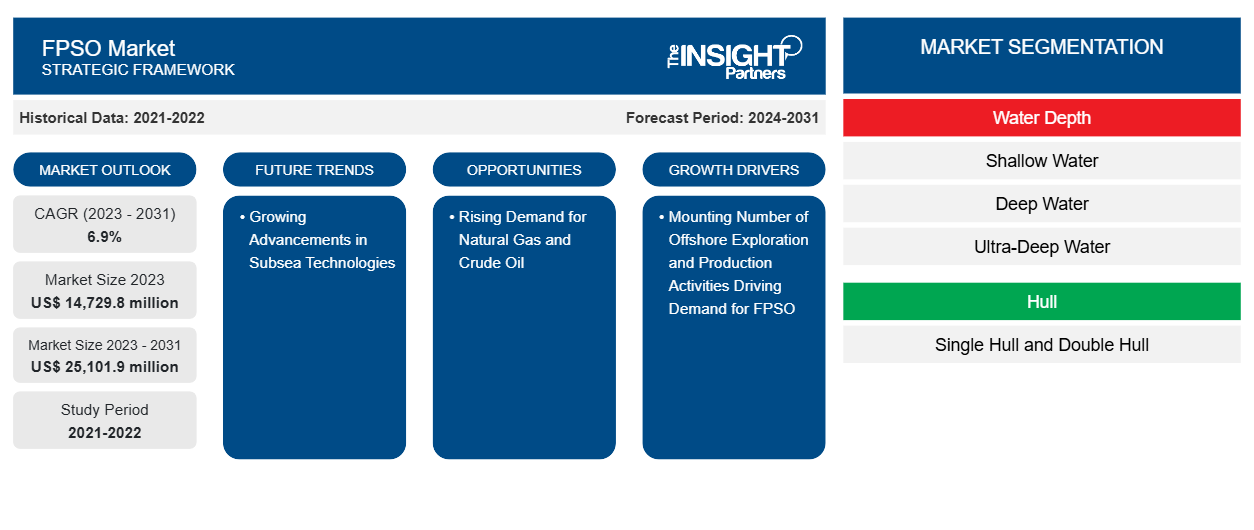
من المتوقع أن يصل حجم سوق FPSO إلى 25,101.9 مليون دولار أمريكي بحلول عام 2031 من 14,729.8 مليون دولار أمريكي في عام 2023. ومن المتوقع أن يسجل السوق معدل نمو سنوي مركب بنسبة 6.9٪ في الفترة 2023-2031. ومن بين الاتجاهات الأخرى لسوق FPSO زيادة تطوير قطاع النفط والغاز وزيادة أنشطة التنقيب عن النفط والغاز.
تحليل سوق FPSO
إن التوسع المتزايد في مشاريع النفط والغاز هو العامل الرئيسي الذي يحفز الطلب على سفن الإنتاج والتخزين العائمة. ومن المتوقع أن يؤدي الطلب على سفن الإنتاج والتخزين العائمة، وخاصة في البحر، إلى جانب استقرار أسعار النفط بشكل معتدل إلى جانب زيادة أنشطة الاستكشاف والإنتاج النفطي في البحر إلى تعزيز النمو القوي في الطلب العالمي على سفن الإنتاج والتخزين العائمة في السنوات الخمس المقبلة. وتركز بعض شركات إنتاج وتخزين وتخزين العائمة الرئيسية مثل Total Energies وPetrobras وCNOOC Ltd وEquinor ASA وExxon Mobil وغيرها على دفع عجلة تطوير سوق سفن الإنتاج والتخزين العائمة.
نظرة عامة على سوق FPSO
تركز شركات استكشاف النفط والغاز، مثل Equinor ASA، على أنشطة استكشاف النفط والغاز في المياه العميقة والعميقة للغاية. على سبيل المثال، في عام 2022، بدأت شركة Shell مشاريع لإنتاج النفط في حقل PowerNap. بالإضافة إلى ذلك، تنفذ شركات النفط والغاز تقنيات جديدة بسبب التطورات في التقنيات البحرية، مثل الأبراج المنفصلة وتصميمات الهيكل الأسطواني وتصميمات الهيكل المزدوج. بالإضافة إلى ذلك، فإن التطورات التكنولوجية في FPSO على أنظمة الإنتاج الأخرى، مثل رقمنة FPSO واختراق الأتمتة والكثير في صناعة النفط والغاز، تزيد من تركيز شركات السوق على أنشطة البحث والتطوير وتطوير منتجات جديدة من شأنه أن يولد اتجاهات لنمو سوق FPSO في السنوات القادمة.
قم بتخصيص هذا التقرير ليناسب متطلباتك
ستحصل على تخصيص لأي تقرير - مجانًا - بما في ذلك أجزاء من هذا التقرير، أو تحليل على مستوى الدولة، وحزمة بيانات Excel، بالإضافة إلى الاستفادة من العروض والخصومات الرائعة للشركات الناشئة والجامعات
سوق FPSO: رؤى استراتيجية
-
احصل على أهم اتجاهات السوق الرئيسية لهذا التقرير.ستتضمن هذه العينة المجانية تحليلاً للبيانات، بدءًا من اتجاهات السوق وحتى التقديرات والتوقعات.
محركات وفرص سوق FPSO
العدد المتزايد من أنشطة الاستكشاف والإنتاج البحرية يعزز الطلب على سفن الإنتاج والتخزين العائمة
في العقود القليلة الماضية، تكثفت عمليات استكشاف وإنتاج النفط والغاز في الخارج بشكل كبير. وعلاوة على ذلك، تتوسع اكتشافات احتياطيات النفط والغاز الجديدة بشكل كبير في جميع أنحاء العالم. كما زاد حضور شركات استخراج النفط والغاز الكبرى، مثل بتروبراس، في أنشطة الاستكشاف والإنتاج البحرية. في بتروبراس، توجد معظم احتياطيات النفط في الحقول البحرية، والتي وجهت أنشطة الحفر. بالإضافة إلى ذلك، وفقًا لوكالة الطاقة الدولية، بحلول عام 2040، ستبلغ النفقات الرأسمالية السنوية لأنشطة إنتاج النفط والغاز البحرية في البرازيل 60 مليار دولار أمريكي. وعلاوة على ذلك، فإن العدد المتزايد من عمليات استغلال احتياطيات النفط الهامشية في المناطق البحرية النائية، جنبًا إلى جنب مع مرونة وحدات الإنتاج والتخزين العائمة للعمل بدون دعم من هيكل ثابت، يعزز نمو السوق.IEA, by 2040, annual capital expenses for offshore oil and exploitations of marginal oil reserves in remote offshore areas, along with the flexibility of FPSOs to operate without the support of a fixed structure, boosts market growth.
ارتفاع الطلب على الغاز الطبيعي والنفط الخام – فرصة في سوق سفن الإنتاج والتخزين العائمة
إن الطلب المتزايد على النفط الخام والغاز الطبيعي يتزايد باستمرار، وهو أحد الأسباب الرئيسية وراء نمو سوق FPSO. ومن المتوقع أن يشهد الطلب على النفط اتجاهًا صعوديًا خلال الفترة 2022-2025 في دول منظمة التعاون الاقتصادي والتنمية، وفقًا لمنظمة أوبك. ومع ذلك، من المتوقع أن يزيد الطلب في الدول غير الأعضاء في منظمة التعاون الاقتصادي والتنمية بمقدار 22.5 مليون برميل يوميًا خلال الفترة المتوقعة حتى عام 2045. وحدد تقرير أوبك أن الغاز الطبيعي من المتوقع أن يكون أسرع أنواع الوقود الأحفوري نموًا وسيكون ثاني أكبر مساهم في مزيج الطاقة، والذي من المتوقع أن يحتفظ بحصة تبلغ حوالي 25٪ في عام 2045. ومن المتوقع أن تشهد منطقة آسيا والمحيط الهادئ في السنوات القادمة طلبًا مرتفعًا على الغاز الطبيعي بسبب الاستخدام المتزايد للغاز الطبيعي في القطاعات الصناعية المتنوعة. وبالتالي، من المتوقع أن يوفر الطلب المتزايد على الغاز الطبيعي والنفط الخام عالميًا فرصًا جديرة بالاهتمام لنمو سوق FPSO في السنوات القادمة.
تحليل تجزئة تقرير سوق FPSO
إن القطاعات الرئيسية التي ساهمت في استخلاص تحليل سوق FPSO هي عمق المياه، والهيكل، والرسو، والبناء.
- بناءً على عمق المياه، تم تقسيم سوق FPSO إلى المياه الضحلة والمياه العميقة والمياه العميقة للغاية. احتل قطاع المياه الضحلة حصة سوقية أكبر في عام 2023.
- بناءً على الهيكل، تم تقسيم سوق FPSO إلى هيكل واحد وهيكل مزدوج. احتل قطاع الهيكل المزدوج حصة سوقية أكبر في عام 2023.
- بناءً على الربط، تم تقسيم سوق FPSO إلى ربط متباعد وربط منفصل. احتل قطاع الربط المتباعد حصة سوقية أكبر في عام 2023.
- بناءً على البناء، تم تقسيم سوق FPSO إلى وحدات مبنية حديثًا ووحدات محولة. احتلت شريحة الوحدات المبنية حديثًا حصة سوقية أكبر في عام 2023.
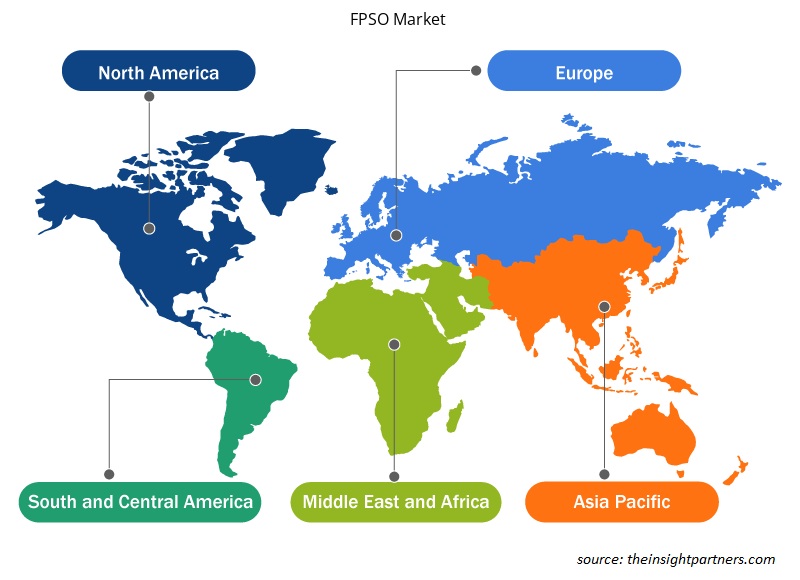
تحليل حصة سوق FPSO حسب المنطقة الجغرافية
ينقسم النطاق الجغرافي لتقرير سوق FPSO بشكل أساسي إلى خمس مناطق: أمريكا الشمالية، ومنطقة آسيا والمحيط الهادئ، وأوروبا، والشرق الأوسط وأفريقيا، وأمريكا الجنوبية/أمريكا الجنوبية والوسطى.
تشمل منطقة أمريكا الجنوبية البرازيل والأرجنتين وبقية دول أمريكا الجنوبية. وتشمل بقية دول أمريكا الجنوبية تشيلي وكولومبيا وغواتيمالا وبيرو. وقد أثرت التطورات التكنولوجية بقوة على اقتصاد البرازيل والأرجنتين، مما ساعد في تقدمه إلى حد كبير. وقد انخفض استخدام النفط في أمريكا الجنوبية تدريجيًا على مدى السنوات الثلاث الماضية. ومع ذلك، مع استعادة استخراج النفط الخام، من المحتمل أن يتغير الوضع، وتركز الشركات الآن على المزيد من أنشطة استكشاف وإنتاج النفط والغاز، وهو ما يدفع الطلب على سوق FPSO في أمريكا الجنوبية.
رؤى إقليمية حول سوق FPSO
لقد قام المحللون في Insight Partners بشرح الاتجاهات والعوامل الإقليمية المؤثرة على سوق FPSO طوال فترة التوقعات بشكل شامل. يناقش هذا القسم أيضًا قطاعات سوق FPSO والجغرافيا في جميع أنحاء أمريكا الشمالية وأوروبا ومنطقة آسيا والمحيط الهادئ والشرق الأوسط وأفريقيا وأمريكا الجنوبية والوسطى.
- احصل على البيانات الإقليمية المحددة لسوق FPSO
نطاق تقرير سوق FPSO
| سمة التقرير | تفاصيل |
|---|---|
| حجم السوق في عام 2023 | 14,729.8 مليون دولار أمريكي |
| حجم السوق بحلول عام 2031 | 25,101.9 مليون دولار أمريكي |
| معدل النمو السنوي المركب العالمي (2023 - 2031) | 6.9% |
| البيانات التاريخية | 2021-2022 |
| فترة التنبؤ | 2024-2031 |
| القطاعات المغطاة |
حسب عمق المياه
|
| المناطق والدول المغطاة |
أمريكا الشمالية
|
| قادة السوق وملفات تعريف الشركات الرئيسية |
|
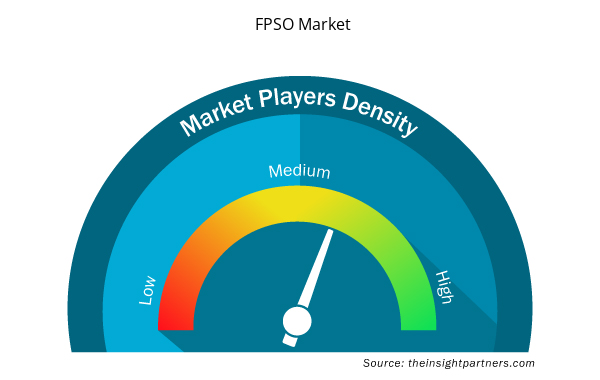
كثافة اللاعبين في السوق: فهم تأثيرها على ديناميكيات الأعمال
يشهد سوق FPSO نموًا سريعًا، مدفوعًا بالطلب المتزايد من المستخدم النهائي بسبب عوامل مثل تفضيلات المستهلك المتطورة والتقدم التكنولوجي والوعي المتزايد بفوائد المنتج. ومع ارتفاع الطلب، تعمل الشركات على توسيع عروضها والابتكار لتلبية احتياجات المستهلكين والاستفادة من الاتجاهات الناشئة، مما يؤدي إلى زيادة نمو السوق.
تشير كثافة اللاعبين في السوق إلى توزيع الشركات أو المؤسسات العاملة في سوق أو صناعة معينة. وهي تشير إلى عدد المنافسين (اللاعبين في السوق) الموجودين في مساحة سوق معينة نسبة إلى حجمها أو قيمتها السوقية الإجمالية.
الشركات الرئيسية العاملة في سوق FPSO هي:
- شركة مودك
- شركة البترول البرازيلية المحدودة
- بومي أرمادا بيرهاد
- شركة إس بي إم أوفشور إن في
- شركة سينوك المحدودة
- توتال انرجيز اس اي
إخلاء المسؤولية : الشركات المذكورة أعلاه ليست مرتبة بأي ترتيب معين.
- احصل على نظرة عامة على أهم اللاعبين الرئيسيين في سوق FPSO
أخبار سوق FPSO والتطورات الأخيرة
يتم تقييم سوق FPSO من خلال جمع البيانات النوعية والكمية بعد البحث الأولي والثانوي، والتي تتضمن منشورات الشركات المهمة وبيانات الجمعيات وقواعد البيانات. فيما يلي قائمة بالتطورات في السوق فيما يتعلق بالابتكارات وتوسيع الأعمال والاستراتيجيات:
- في مايو 2023، أعلنت شركة MODEC، Inc. عن المضي قدمًا في أعمال الهندسة والمشتريات والبناء على سفينة الإنتاج والتخزين والتفريغ العائمة Uaru لمشروع Uaru التابع لشركة ExxonMobil Guyana. (المصدر: MODEC، Inc.، بيان صحفي/موقع الشركة الإلكتروني/النشرة الإخبارية)
- في أبريل 2024، قامت شركة إكسون موبيل باستثمار نهائي في تطوير حقل ويبتيل قبالة سواحل غيانا، بعد الحصول على الموافقات الحكومية والتنظيمية المطلوبة. (المصدر: شركة إكسون موبيل، بيان صحفي/موقع الشركة الإلكتروني/النشرة الإخبارية)
تغطية تقرير سوق FPSO والمنتجات النهائية
يوفر تقرير "حجم سوق FPSO والتوقعات (2021-2031)" تحليلاً مفصلاً للسوق يغطي المجالات التالية:
- حجم سوق FPSO والتوقعات على المستويات العالمية والإقليمية والوطنية لجميع قطاعات السوق الرئيسية التي يغطيها النطاق
- ديناميكيات السوق مثل المحركات والقيود والفرص الرئيسية
- اتجاهات سوق FPSO
- تحليل مفصل لـ PEST و SWOT
- تحليل سوق FPSO يغطي اتجاهات السوق الرئيسية والإطار العالمي والإقليمي والجهات الفاعلة الرئيسية واللوائح والتطورات الأخيرة في السوق
- تحليل صناعة FPSO والمناظر الطبيعية والمنافسة، بما في ذلك تركيز السوق، وتحليل خريطة الحرارة، واللاعبين البارزين، والتطورات الأخيرة
- ملفات تعريف الشركة التفصيلية

نيفيديتا خبيرة أبحاث مُتميزة، تتمتع بخبرة تزيد عن 9 سنوات في أبحاث السوق واستشارات الأعمال. تشغل حاليًا منصب مديرة مشاريع في مجال تكنولوجيا المعلومات والاتصالات لدى شركة "ذا إنسايت بارتنرز"، وتتمتع بخبرة واسعة في إدارة وتنفيذ مهام الأبحاث المُجمعة والمُخصصة والقائمة على الاشتراكات والاستشارات في مختلف قطاعات التكنولوجيا.
بفضل سجلها الحافل في تقديم تحليلات قائمة على البيانات ورؤى عملية، ساهمت نيفيديتا بشكل رئيسي في العديد من المشاريع الحيوية. يشمل عملها تنفيذ المشاريع من البداية إلى النهاية، بدءًا من فهم أهداف العملاء، وتحليل اتجاهات السوق، وصولًا إلى استخلاص التوصيات الاستراتيجية. وقد تعاونت على نطاق واسع مع شركات رائدة في مجال تكنولوجيا المعلومات والاتصالات، مما ساعدها على تحديد فرص السوق ومواكبة تحولات القطاع.
تحمل نيفيديتا ماجستير إدارة أعمال في الإدارة من شركة "آي إم إس" في دهرادون. قبل انضمامها إلى "ذا إنسايت بارتنرز"، اكتسبت خبرة قيّمة في شركتي "ماركتس آند ماركتس" و"فيوتشر ماركت إنسايتس" في بونا، حيث شغلت مناصب بحثية مُختلفة وبنت أساسًا قويًا في تحليل القطاع والتفاعل مع العملاء.
- التحليل التاريخي (سنتان)، سنة الأساس، التوقعات (7 سنوات) مع معدل النمو السنوي المركب
- تحليل PEST و SWOT
- حجم السوق والقيمة / الحجم - عالمي، إقليمي، بلد
- الصناعة والمنافسة
- مجموعة بيانات إكسل
التقارير الحديثة
شهادات العملاء
تقرير سوق أنظمة SCADA من Insight Partners شامل، ويقدم رؤى قيّمة حول الاتجاهات الحالية والتوقعات المستقبلية. تميّز الفريق باحترافية عالية وسرعة في الاستجابة ودعم مستمر طوال الوقت. نحن راضون جدًا ونوصي بشدة بخدماتهم.
ران كيديم شريك, شركة ريالي تكنولوجيز المحدودةطلبتُ تقريرًا عن سوق برمجيات محدد، وأعدّه الفريق في غضون أيام قليلة. كانت المعلومات ذات صلة وثيقة وعرضها جيد. ثم طلبتُ بعض التعديلات والإضافات على التقرير. وكان الفريق متجاوبًا للغاية، وحصلتُ على التقرير النهائي في أقل من أسبوع.
جان هيرفيه جين رئيس مجلس الإدارة, فيوتشر أناليتيكاعملنا مع شركة "إنسايت بارتنرز" لإجراء دراسة سوقية وتوقعات مهمة. زودونا برؤى واضحة حول الفرص والمخاطر، مما ساعدنا في صياغة خططنا. كانت أبحاثهم سهلة الاستخدام ومبنية على بيانات دقيقة، مما ساعدنا على اتخاذ قرارات ذكية وواثقة. نوصي بهم بشدة.
بيوش ناجبال نائب الرئيس الأول, شعاع عالي عالميقدّمت شركة Insight Partners أبحاثًا سوقية ثاقبة ومنظمة جيدًا بخبرة واسعة في هذا المجال. تميّز فريقهم بالاحترافية وسرعة الاستجابة طوال الوقت. وسهّل موقعهم الإلكتروني سهل الاستخدام الوصول إلى تقارير القطاع. نوصي بهم بشدة لخدمات بحثية موثوقة وعالية الجودة.
يوكيهيكو أداتشي المدير التنفيذي, ديب بلو، ذ.م.م.هذه أول مرة أشتري فيها تقرير سوق من The Insight Partners. رغم أنني كنت مترددًا في البداية، إلا أنني زرت موقعهم الإلكتروني وشعرت براحة أكبر للمخاطرة وشراء تقرير السوق. أنا راضٍ تمامًا عن جودة التقرير وخدمة العملاء. كانت لديّ عدة أسئلة وتعليقات حول التقرير الأولي، ولكن بعد بضع محادثات عبر البريد الإلكتروني مع محللهم، أعتقد أن لديّ تقريرًا يمكنني استخدامه كمدخل لعملية التخطيط الاستراتيجي لدينا. شكرًا جزيلاً لكم على تخصيص وقتكم الإضافي وجعل هذه التجربة إيجابية. سأوصي بخدماتكم للآخرين بالتأكيد، وستكونون أول من ألجأ إليه عندما نحتاج إلى المزيد من بيانات السوق.
جون سوزوكي الرئيس والرئيس التنفيذي وعضو مجلس الإدارة, بي كيه تكنولوجيزأود أن أقدّر دعمكم واحترافيتكم في الاستجابة لطلبي للحصول على معلومات بشأن سوق التشخيص المخبري للأمراض المعدية في نيجيريا. كما أُقدّر صبركم وتوجيهكم، واستعدادكم لتقديم خصم، مما مكّننا في النهاية من إتمام الصفقة. أتطلع إلى التعامل مع "ذا إنسايت بارتنرز" مستقبلًا، كل ذلك بفضل الانطباع الذي تركتموه لديّ نتيجةً لهذا اللقاء الأول.
الدكتور تشيجيوك أونيا المدير الإداري, شركة باينكريست للرعاية الصحية المحدودةسبب الشراء
- اتخاذ قرارات مدروسة
- فهم ديناميكيات السوق
- تحليل المنافسة
- رؤى العملاء
- توقعات السوق
- تخفيف المخاطر
- التخطيط الاستراتيجي
- مبررات الاستثمار
- تحديد الأسواق الناشئة
- تحسين استراتيجيات التسويق
- تعزيز الكفاءة التشغيلية
- مواكبة التوجهات التنظيمية


 احصل على عينة مجانية ل - سوق FPSO