استراتيجيات السوق لتحليلات المنتجات وأفضل اللاعبين وفرص النمو والتحليل والتوقعات بحلول عام 2031
البيانات التاريخية : 2021-2022 | سنة الأساس : 2023 | فترة التنبؤ : 2024-2031حجم سوق تحليلات المنتجات وتوقعاته (2021-2031)، والحصة العالمية والإقليمية، والاتجاهات، وفرص النمو. يغطي التقرير تحليلات حسب المكونات (الحلول والخدمات)، والنشر (محليًا وسحابيًا)، والوضع (تتبع البيانات وتحليلها)، والقطاعات (التجزئة والسلع الاستهلاكية، والأغذية والمشروبات، والرعاية الصحية والأدوية، والطاقة والمرافق، والسيارات، والتصنيع، وغيرها)، والجغرافيا.
- تاريخ التقرير : Mar 2026
- رمز التقرير : TIPRE00006175
- الفئة : التكنولوجيا والإعلام والاتصالات
- الحالة : البيانات الصادرة
- تنسيقات التقارير المتاحة :


- عدد الصفحات : 150
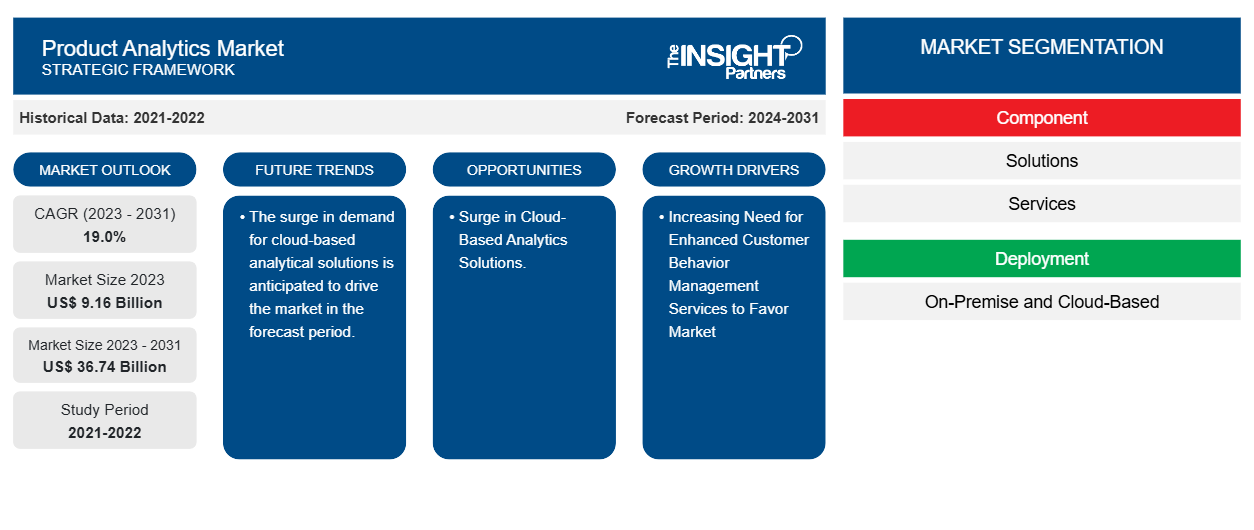
من المتوقع أن يصل حجم سوق تحليلات المنتجات إلى 36.74 مليار دولار أمريكي بحلول عام 2031 من 9.16 مليار دولار أمريكي في عام 2023. ومن المتوقع أن يسجل السوق معدل نمو سنوي مركب بنسبة 19.0٪ خلال الفترة 2023-2031. ومن المرجح أن تكون الحاجة المتزايدة إلى خدمات إدارة سلوك العملاء المحسنة والزيادة في استخدام التقنيات المتقدمة هي المحركات والاتجاهات الرئيسية للسوق.
تحليلات المنتج تحليل السوق
يشهد سوق تحليلات المنتجات نموًا كبيرًا على مستوى العالم. ويعزى هذا النمو إلى عوامل مثل الحاجة المتزايدة إلى خدمات إدارة سلوك العملاء المحسنة والارتفاع في استخدام التقنيات المتقدمة. وعلاوة على ذلك، من المتوقع أن يحمل الارتفاع في الطلب على الحلول التحليلية المستندة إلى السحابة العديد من الفرص لسوق تحليلات المنتجات.
نظرة عامة على سوق تحليلات المنتجات
تحليلات المنتج هي طريقة تحليل كيفية احتفاظ المستخدمين بمنتج أو خدمة. وهي تمكن فرق المنتج من تحليل وتتبع وتصور بيانات مشاركة المستخدم وسلوكه. تستخدم الفرق هذه البيانات لتحسين المنتج أو الخدمة.
قم بتخصيص هذا التقرير ليناسب متطلباتك
ستحصل على تخصيص لأي تقرير - مجانًا - بما في ذلك أجزاء من هذا التقرير، أو تحليل على مستوى الدولة، وحزمة بيانات Excel، بالإضافة إلى الاستفادة من العروض والخصومات الرائعة للشركات الناشئة والجامعات
سوق تحليلات المنتجات: رؤى استراتيجية
-
احصل على أهم اتجاهات السوق الرئيسية لهذا التقرير.ستتضمن هذه العينة المجانية تحليلاً للبيانات، بدءًا من اتجاهات السوق وحتى التقديرات والتوقعات.
محركات وفرص سوق تحليلات المنتجات
الحاجة المتزايدة إلى خدمات إدارة سلوك العملاء المحسنة لصالح السوق
إن الحاجة المتزايدة إلى خدمات إدارة سلوك العملاء المحسنة هي في الواقع محرك لسوق تحليلات المنتجات حيث تفهم العديد من الشركات تفضيلات وسلوكيات العملاء الفردية لتخصيص تجارب مخصصة. تقدم العديد من الشركات في السوق تحليلات المنتجات لتحسين سلوك العملاء. على سبيل المثال، في مارس 2023، كشفت Adobe عن Adobe Product Analytics الجديد في Adobe Experience Cloud . يعيد التطبيق الجديد تصور فئة تحليلات المنتجات من خلال توحيد رؤى رحلة العميل عبر التسويق والمنتجات. لأول مرة، يمكن للفرق التي تركز على تجارب العملاء الاستفادة من رؤية موحدة حقًا للعميل والتعاون بسلاسة عبر المؤسسة، مما يؤدي إلى نمو مربح نتيجة لذلك.
ارتفاع في حلول التحليلات المستندة إلى السحابة.
يمكن أن تؤدي الزيادة الكبيرة في حلول التحليلات المستندة إلى السحابة إلى دفع سوق تحليلات المنتجات بعدة طرق. نظرًا لأن الحلول المستندة إلى السحابة توفر إمكانية التوسع، مما يسمح للشركات بتعديل قدراتها التحليلية بسهولة بناءً على الطلب. علاوة على ذلك، تقدم العديد من الشركات حلول تحليلات مستندة إلى السحابة. على سبيل المثال، حل SAP Analytics Cloud، وهو جزء من منصة SAP Business Technology Platform، تعمل العديد من الشركات على تمكين الأشخاص من جميع الرتب ومجموعات المهارات لاتخاذ القرارات التي تؤدي إلى نتائج مهمة لأعمالهم ومجتمعهم .
تقرير تحليلات السوق وتحليل التجزئة للمنتج
القطاعات الرئيسية التي ساهمت في استنباط تحليل سوق تحليلات المنتجات هي المكون، والنشر، والوضع، والعمودي.
- بناءً على المكونات، ينقسم سوق تحليلات المنتجات إلى حلول وخدمات. ومن المتوقع أن يحظى قطاع الحلول بحصة سوقية كبيرة خلال فترة التوقعات.
- بناءً على النشر، ينقسم سوق تحليلات المنتجات إلى بيانات التتبع وتحليل البيانات. ومن المتوقع أن يحظى قطاع بيانات التتبع بحصة سوقية كبيرة في فترة التوقعات.
- من حيث القطاعات، يتم تقسيم السوق إلى سلع التجزئة والسلع الاستهلاكية، والأغذية والمشروبات، والرعاية الصحية والأدوية، والطاقة والمرافق، والسيارات، والتصنيع، وغيرها. ومن المتوقع أن تستحوذ سلع التجزئة والسلع الاستهلاكية على حصة سوقية كبيرة خلال الفترة المتوقعة.
تحليل حصة سوق تحليلات المنتجات حسب المنطقة الجغرافية
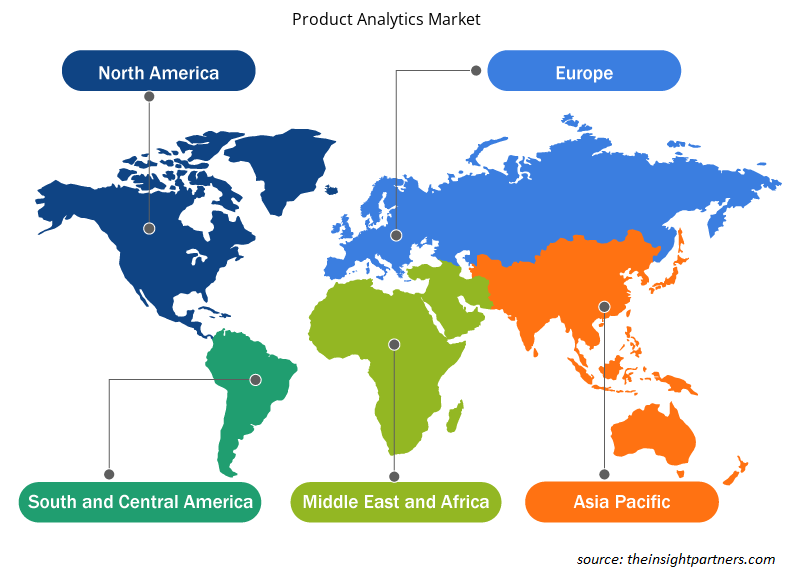
ينقسم النطاق الجغرافي لتقرير سوق تحليلات المنتجات بشكل أساسي إلى خمس مناطق: أمريكا الشمالية، ومنطقة آسيا والمحيط الهادئ، وأوروبا، والشرق الأوسط وأفريقيا، وأمريكا الجنوبية والوسطى.
سيطرت أمريكا الشمالية على سوق تحليلات المنتجات. وقد أدت اتجاهات تبني التكنولوجيا العالية في مختلف الصناعات في منطقة أمريكا الشمالية إلى تغذية نمو سوق تحليلات المنتجات. ومن المتوقع أن تؤدي عوامل مثل زيادة اعتماد الأدوات الرقمية والإنفاق التكنولوجي العالي من قبل الوكالات الحكومية إلى دفع نمو سوق تحليلات المنتجات في أمريكا الشمالية. علاوة على ذلك، فإن التركيز القوي على البحث والتطوير في الاقتصادات المتقدمة في الولايات المتحدة وكندا يجبر اللاعبين في أمريكا الشمالية على جلب حلول متقدمة تقنيًا إلى السوق. بالإضافة إلى ذلك، يوجد في الولايات المتحدة عدد كبير من اللاعبين في سوق تحليلات المنتجات الذين يركزون بشكل متزايد على تطوير حلول مبتكرة. تساهم كل هذه العوامل في نمو سوق تحليلات المنتجات في المنطقة.
رؤى إقليمية حول سوق تحليلات المنتجات
لقد قام المحللون في Insight Partners بشرح الاتجاهات والعوامل الإقليمية المؤثرة على سوق تحليلات المنتجات طوال فترة التوقعات بشكل شامل. يناقش هذا القسم أيضًا قطاعات سوق تحليلات المنتجات والجغرافيا في جميع أنحاء أمريكا الشمالية وأوروبا ومنطقة آسيا والمحيط الهادئ والشرق الأوسط وأفريقيا وأمريكا الجنوبية والوسطى.
- احصل على بيانات إقليمية محددة لسوق تحليلات المنتجات
نطاق تقرير سوق تحليلات المنتجات
| سمة التقرير | تفاصيل |
|---|---|
| حجم السوق في عام 2023 | 9.16 مليار دولار أمريكي |
| حجم السوق بحلول عام 2031 | 36.74 مليار دولار أمريكي |
| معدل النمو السنوي المركب العالمي (2023 - 2031) | 19.0% |
| البيانات التاريخية | 2021-2022 |
| فترة التنبؤ | 2024-2031 |
| القطاعات المغطاة |
حسب المكون
|
| المناطق والدول المغطاة |
أمريكا الشمالية
|
| قادة السوق وملفات تعريف الشركات الرئيسية |
|
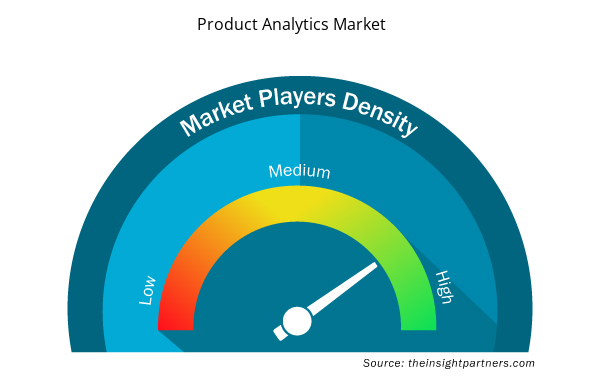
كثافة اللاعبين في سوق تحليلات المنتجات: فهم تأثيرها على ديناميكيات الأعمال
يشهد سوق تحليلات المنتجات نموًا سريعًا، مدفوعًا بالطلب المتزايد من المستخدم النهائي بسبب عوامل مثل تفضيلات المستهلكين المتطورة والتقدم التكنولوجي والوعي المتزايد بفوائد المنتج. ومع ارتفاع الطلب، تعمل الشركات على توسيع عروضها والابتكار لتلبية احتياجات المستهلكين والاستفادة من الاتجاهات الناشئة، مما يؤدي إلى زيادة نمو السوق.
تشير كثافة اللاعبين في السوق إلى توزيع الشركات أو المؤسسات العاملة في سوق أو صناعة معينة. وهي تشير إلى عدد المنافسين (اللاعبين في السوق) الموجودين في مساحة سوق معينة نسبة إلى حجمها أو قيمتها السوقية الإجمالية.
الشركات الرئيسية العاملة في سوق تحليلات المنتجات هي:
- شركة أمبليتيود
- اكتساب البصيرة
- شركة هيب
- شركة آي بي إم
- ميكس بانل
- شركة Pendo.io
إخلاء المسؤولية : الشركات المذكورة أعلاه ليست مرتبة بأي ترتيب معين.
- احصل على نظرة عامة على أهم اللاعبين الرئيسيين في سوق تحليلات المنتجات
أخبار سوق تحليلات المنتجات والتطورات الأخيرة
يتم تقييم سوق تحليلات المنتجات من خلال جمع البيانات النوعية والكمية بعد البحث الأولي والثانوي، والذي يتضمن منشورات الشركات المهمة وبيانات الجمعيات وقواعد البيانات. فيما يلي بعض التطورات في سوق تحليلات المنتجات:
- أطلقت شركة Instructure، وهي الشركة الرائدة في مجال تكنولوجيا التعلم وصانعة Canvas LMS، منتج Intelligent Insights، وهو منتج جديد يعمل بالذكاء الاصطناعي والتحليلات، مما يفتح المجال أمام مستوى من قدرات إعداد التقارير ذاتية الخدمة غير المتاحة عمومًا للمؤسسات التعليمية. (المصدر: موقع شركة Instructure، يونيو 2024)
- أعلنت LSEG (مجموعة بورصة لندن) وDow Jones عن شراكة جديدة متعددة السنوات في مجال البيانات والأخبار والتحليلات. ستدمج Dow Jones قدرات LSEG العالمية في مجال البيانات والتحليلات عبر وسائل الإعلام الرقمية والمطبوعة، بما في ذلك The Wall Street Journal وBarron's وInvestor's Business Daily وMarketWatch. (المصدر: موقع شركة LSEG الإلكتروني، يوليو 2024)
تغطية تقرير سوق تحليلات المنتجات والمنتجات النهائية
يوفر تقرير "حجم سوق تحليلات المنتجات والتوقعات (2021-2031)" تحليلاً مفصلاً للسوق يغطي المجالات التالية:
- حجم سوق تحليلات المنتجات وتوقعاتها على المستويات العالمية والإقليمية والوطنية لجميع قطاعات السوق الرئيسية التي يغطيها النطاق.
- تحليلات المنتجات واتجاهات السوق بالإضافة إلى ديناميكيات السوق مثل المحركات والقيود والفرص الرئيسية.
- تحليل مفصل لقوى PEST/Porter الخمس و SWOT.
- تحليلات سوق المنتج تغطي اتجاهات السوق الرئيسية والإطار العالمي والإقليمي واللاعبين الرئيسيين واللوائح والتطورات الأخيرة في السوق.
- تحليل المشهد الصناعي والمنافسة الذي يغطي تركيز السوق، وتحليل خريطة الحرارة، واللاعبين البارزين، والتطورات الأخيرة في سوق تحليلات المنتجات.
- ملفات تعريفية مفصلة للشركة.

أنكيتا خبيرة ديناميكية في أبحاث السوق والاستشارات، تتمتع بخبرة تزيد عن 8 سنوات في قطاعات التكنولوجيا والإعلام وتكنولوجيا المعلومات والاتصالات والإلكترونيات وأشباه الموصلات. وقد قادت ونفذت بنجاح أكثر من 100 مهمة استشارية وبحثية لعملاء عالميين مثل مايكروسوفت وأوراكل وشركة NEC وSAP وKPMG وExpeditors International. تشمل كفاءاتها الأساسية تقييم السوق، وتحليل البيانات، والتنبؤ، وصياغة الاستراتيجيات، والاستخبارات التنافسية، وكتابة التقارير.
أنكيتا بارعة في إدارة دورات المشاريع الكاملة، بدءًا من تصميم عروض ما قبل البيع ومناقشات العملاء، وصولًا إلى تقديم رؤى عملية بعد البيع. كما أنها ماهرة في إدارة فرق متعددة الوظائف، وهيكلة وحدات بحثية معقدة، ومواءمة الحلول مع أهداف العمل الخاصة بالعملاء. وقد مكنتها مهاراتها الممتازة في التواصل والقيادة والعرض التقديمي من تحقيق نتائج قيّمة باستمرار في بيئات سوقية سريعة التطور.
- التحليل التاريخي (سنتان)، سنة الأساس، التوقعات (7 سنوات) مع معدل النمو السنوي المركب
- تحليل PEST و SWOT
- حجم السوق والقيمة / الحجم - عالمي، إقليمي، بلد
- الصناعة والمنافسة
- مجموعة بيانات إكسل
التقارير الحديثة
شهادات العملاء
تقرير سوق أنظمة SCADA من Insight Partners شامل، ويقدم رؤى قيّمة حول الاتجاهات الحالية والتوقعات المستقبلية. تميّز الفريق باحترافية عالية وسرعة في الاستجابة ودعم مستمر طوال الوقت. نحن راضون جدًا ونوصي بشدة بخدماتهم.
ران كيديم شريك, شركة ريالي تكنولوجيز المحدودةطلبتُ تقريرًا عن سوق برمجيات محدد، وأعدّه الفريق في غضون أيام قليلة. كانت المعلومات ذات صلة وثيقة وعرضها جيد. ثم طلبتُ بعض التعديلات والإضافات على التقرير. وكان الفريق متجاوبًا للغاية، وحصلتُ على التقرير النهائي في أقل من أسبوع.
جان هيرفيه جين رئيس مجلس الإدارة, فيوتشر أناليتيكاعملنا مع شركة "إنسايت بارتنرز" لإجراء دراسة سوقية وتوقعات مهمة. زودونا برؤى واضحة حول الفرص والمخاطر، مما ساعدنا في صياغة خططنا. كانت أبحاثهم سهلة الاستخدام ومبنية على بيانات دقيقة، مما ساعدنا على اتخاذ قرارات ذكية وواثقة. نوصي بهم بشدة.
بيوش ناجبال نائب الرئيس الأول, شعاع عالي عالميقدّمت شركة Insight Partners أبحاثًا سوقية ثاقبة ومنظمة جيدًا بخبرة واسعة في هذا المجال. تميّز فريقهم بالاحترافية وسرعة الاستجابة طوال الوقت. وسهّل موقعهم الإلكتروني سهل الاستخدام الوصول إلى تقارير القطاع. نوصي بهم بشدة لخدمات بحثية موثوقة وعالية الجودة.
يوكيهيكو أداتشي المدير التنفيذي, ديب بلو، ذ.م.م.هذه أول مرة أشتري فيها تقرير سوق من The Insight Partners. رغم أنني كنت مترددًا في البداية، إلا أنني زرت موقعهم الإلكتروني وشعرت براحة أكبر للمخاطرة وشراء تقرير السوق. أنا راضٍ تمامًا عن جودة التقرير وخدمة العملاء. كانت لديّ عدة أسئلة وتعليقات حول التقرير الأولي، ولكن بعد بضع محادثات عبر البريد الإلكتروني مع محللهم، أعتقد أن لديّ تقريرًا يمكنني استخدامه كمدخل لعملية التخطيط الاستراتيجي لدينا. شكرًا جزيلاً لكم على تخصيص وقتكم الإضافي وجعل هذه التجربة إيجابية. سأوصي بخدماتكم للآخرين بالتأكيد، وستكونون أول من ألجأ إليه عندما نحتاج إلى المزيد من بيانات السوق.
جون سوزوكي الرئيس والرئيس التنفيذي وعضو مجلس الإدارة, بي كيه تكنولوجيزأود أن أقدّر دعمكم واحترافيتكم في الاستجابة لطلبي للحصول على معلومات بشأن سوق التشخيص المخبري للأمراض المعدية في نيجيريا. كما أُقدّر صبركم وتوجيهكم، واستعدادكم لتقديم خصم، مما مكّننا في النهاية من إتمام الصفقة. أتطلع إلى التعامل مع "ذا إنسايت بارتنرز" مستقبلًا، كل ذلك بفضل الانطباع الذي تركتموه لديّ نتيجةً لهذا اللقاء الأول.
الدكتور تشيجيوك أونيا المدير الإداري, شركة باينكريست للرعاية الصحية المحدودةسبب الشراء
- اتخاذ قرارات مدروسة
- فهم ديناميكيات السوق
- تحليل المنافسة
- رؤى العملاء
- توقعات السوق
- تخفيف المخاطر
- التخطيط الاستراتيجي
- مبررات الاستثمار
- تحديد الأسواق الناشئة
- تحسين استراتيجيات التسويق
- تعزيز الكفاءة التشغيلية
- مواكبة التوجهات التنظيمية


 احصل على عينة مجانية ل - سوق تحليلات المنتجات