Marktstrategien für elektronischen Datenaustausch, Top-Player, Wachstumschancen, Analyse und Prognose bis 2031
Historische Daten : 2021-2023 | Basisjahr : 2024 | Prognosezeitraum : 2025-2031Marktgröße und Prognose für den elektronischen Datenaustausch (2021 – 2031), Berichtsabdeckung für globale und regionale Anteils-, Trend- und Wachstumschancenanalyse: Nach Komponente (Lösung und Dienste), Typ (Direkt-EDI, EDI über AS2, EDI über VAN, Mobile EDI, Web-EDI, EDI-Outsourcing und andere) und Branche (BFSI, Einzelhandel und Konsumgüter, Gesundheitswesen, IT und Telekommunikation, Transport und Logistik und andere) und Geografie
- Status : Veröffentlicht
- Berichtscode : TIPRE00006160
- Kategorie : Technologie, Medien und Telekommunikation
- Anzahl der Seiten : 256
- Verfügbare Berichtsformate :


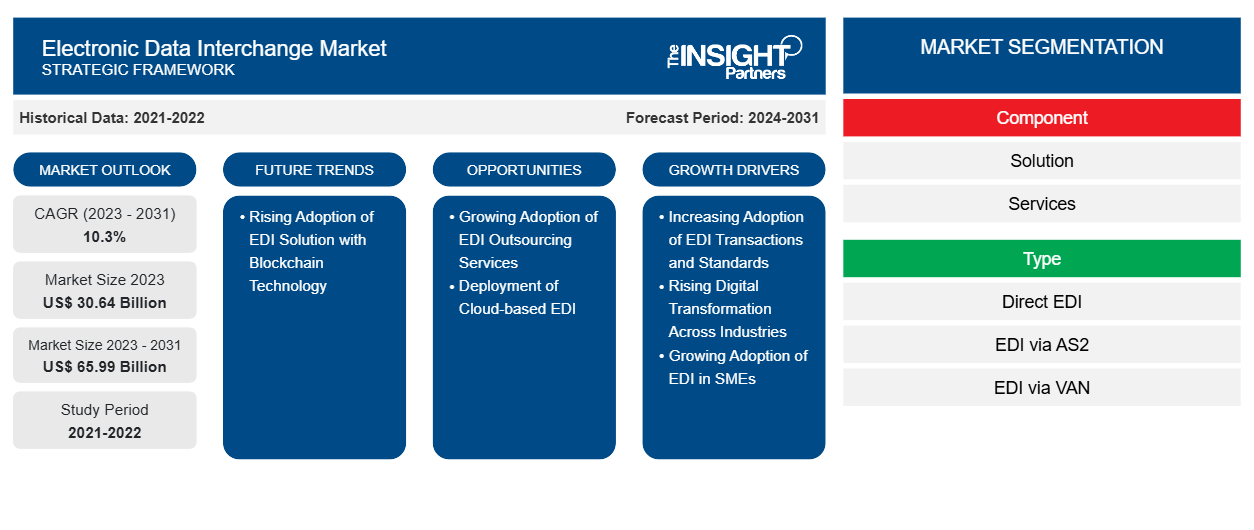
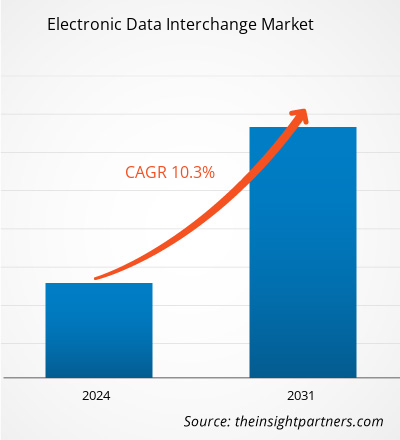
Der Markt für elektronischen Datenaustausch wird voraussichtlich bis 2031 ein Volumen von 74,36 Milliarden US-Dollar erreichen, ausgehend von 34,02 Milliarden US-Dollar im Jahr 2024. Für den Zeitraum 2025–2031 wird eine durchschnittliche jährliche Wachstumsrate (CAGR) von 11,9 % erwartet. Die Integration von Lösungen für den elektronischen Datenaustausch (EDI) in die Blockchain-Technologie dürfte in den kommenden Jahren neue Trends auf dem Markt bringen.
Marktanalyse für elektronischen Datenaustausch
EDI-Lösungen erfordern ständige Wartung, da der gesamte Geschäftsablauf davon abhängt. Viele Unternehmen gehen davon aus, dass EDI zahlreiche Konformitäten und Standards erfüllt. Dies erschwert kleineren Unternehmen die Zusammenarbeit mit größeren Unternehmen bei der Bereitstellung aktualisierter Dokumentenstandards. Die Unternehmen tauschen EDI-Dokumente direkt mit ihren Kunden aus oder nutzen externe Dienstleister. Mit dem wachsenden Trend zur Digitalisierung von Geschäftsdokumenten für eine effiziente Verarbeitung werden verschiedene Konformitäten implementiert, die den Übergang von papierbasierten zu elektronischen Rechnungen weltweit fördern.
Die zunehmende digitale Transformation und Akzeptanz von EDI-Lösungen für Datentransaktionen in den Branchen Finanzwesen, Einzelhandel und Fertigung, die steigenden EDI-Compliance-Anforderungen und positive staatliche Initiativen zur Förderung der EDI-Nutzung sind einige der entscheidenden Faktoren, die die weltweite Nachfrage nach EDI-Lösungen antreiben. Nachteile von EDI sind jedoch die hohen Implementierungskosten und die zeitaufwändige Implementierung der Lösungen. Trotz dieser Einschränkungen wird erwartet, dass die zunehmende Akzeptanz von EDI-Transaktionen und -Standards sowie die zunehmende digitale Transformation in allen Branchen das Marktwachstum im Prognosezeitraum vorantreiben werden.
Marktübersicht für elektronischen Datenaustausch
EDI ist ein automatisierter Prozess für Unternehmen zum elektronischen Austausch von Dokumenten wie Rechnungen, Bestellungen, Versandbenachrichtigungen, Zoll-, Zahlungs-, Lager-, Frachtbrief- und Versandstatusdokumenten. EDI ermöglicht Unternehmen, den Datenaustausch zwischen Supply-Chain-Anwendungen zu regulieren. Es garantiert zudem die pünktliche Übermittlung geschäftskritischer Daten. EDI ersetzt die traditionelle Geschäftskommunikation mit Postvorbereitung und -bearbeitung. EDI-Lösungen ermöglichen Unternehmen, ihre Workflow-Leistung insgesamt zu verbessern. Die schnelle und präzise Verarbeitung von EDI-Dokumenten reduziert die Anzahl wiederkehrender Aufträge sowie die Anzahl stornierter Bestellungen und Lagerausfälle.
Sie erhalten kostenlos Anpassungen an jedem Bericht, einschließlich Teilen dieses Berichts oder einer Analyse auf Länderebene, eines Excel-Datenpakets sowie tolle Angebote und Rabatte für Start-ups und Universitäten
Markt für elektronischen Datenaustausch: Strategische Einblicke
-
Informieren Sie sich über die wichtigsten Markttrends in diesem Bericht.Dieses KOSTENLOSE Beispiel umfasst Datenanalysen, von Markttrends bis hin zu Schätzungen und Prognosen.
Markttreiber und Chancen für den elektronischen Datenaustausch
Zunehmende Nutzung von EDI in KMU
EDI wird regelmäßig von kleinen und mittleren Unternehmen (KMU) eingesetzt. Da kleine und mittlere Unternehmen (KMU) über weniger Ressourcen und Humankapital verfügen, unterstützt EDI sie bei der Automatisierung von Prozessen, anstatt sich auf traditionelle Methoden zu verlassen. Es ermöglicht den Austausch einer Vielzahl von Dokumenten und Daten gemäß globalen und regionalen EDI-Regeln und -Standards für den gesamten elektronischen Austauschprozess. Dies umfasst Übertragung, Nachrichtenfluss, Dokumentformat und die zum Senden und Empfangen von Dokumenten in KMU verwendete Software. Das weltweite Wachstum von KMU erhöht die Anzahl automatisierter Transaktionen, was die Nachfrage nach EDI-Lösungen für KMU steigert. So verzeichnete Europa laut Daten der Europäischen Kommission (EU) vom Juli 2024 einen Anstieg der Anzahl von KMU um 5,4 %, wobei die Beschäftigungsquote um 4,8 % zunahm. Das Gesamtwachstum der KMU in der Region erreichte zwischen 2021 und 2023 4,5 %. Dieses Wachstum erhöht die Anzahl der Geschäftsaktivitäten und steigert die Nachfrage nach EDI-Lösungen zur Rationalisierung von Abläufen, Verbesserung der Betriebseffizienz und Reduzierung überschüssiger IT-Kosten. EDI-Lösungen ermöglichen KMU den reibungslosen elektronischen Austausch wichtiger Dokumente wie Bestellungen und Rechnungen und vermeiden so manuelle Prozesse und Papierkram. Dies führt zu einer schnelleren Auftragsabwicklung, weniger Fehlern und einem besseren Bestandsmanagement , was wiederum die Gesamtleistung des Unternehmens verbessert.
Darüber hinaus ermutigen die zunehmende Digitalisierung und die steigende Nachfrage nach automatisierten Lösungen KMU, Cloud-basierte Lösungen zu nutzen. Cloud-basierte Lösungen automatisieren viele Aspekte des EDI-Prozesses – wie Validierung, Datenmapping, Formatkonvertierung, optimierte Arbeitsabläufe und reduzierte manuelle Dateneingabe. Laut einer 2024 durchgeführten Public First-Umfrage stimmten 85 % der befragten KMU, die Cloud-Dienste nutzen, zu, dass die Nutzung von Cloud-Diensten es ihnen erleichtert, mit größeren Unternehmen zu konkurrieren. Die zunehmende Nutzung von EDI-Lösungen kann zu höheren Umsätzen für EDI-Anbieter führen. Dadurch machen Anbieter EDI-Lösungen erschwinglicher und zugänglicher für die Expansion ihrer Unternehmen. Darüber hinaus ermöglicht es KMU, in EDI zu investieren, mit größeren Organisationen Handel zu treiben und gleichzeitig mehr Geschäftstransaktionen abzuwickeln. Insgesamt hilft EDI KMU, effizienter zu arbeiten und gleichzeitig mehr Transaktionen abzuwickeln und Geschäfte mit größeren Organisationen zu tätigen. Somit fördert die zunehmende Nutzung von EDI bei KMU das Wachstum des Marktes für elektronischen Datenaustausch .
Steigende Nachfrage nach EDI-Outsourcing-Diensten
Das Outsourcing des EDI-Programms erfolgt über Managed Services, indem eine EDI-Plattform für einen Drittanbieter verwaltet und implementiert wird. Der Outsourcing-Anbieter bietet typischerweise eine Cloud-basierte Lösung oder Services an, die Unternehmen beim sicheren Austausch von Dokumenten wie Bestellungen, Rechnungen und Lieferscheinen unterstützen. Outsourcing erfordert von den Unternehmen den Zugriff auf ein breites Spektrum an Fähigkeiten und Investitionen in Hard- und Software. Viele Unternehmen konzentrieren sich aktiv auf die Integration von EDI in ihre Backoffice-Systeme, einschließlich eines ERP-Systems, das ihnen hilft, den Bedarf an internen Ressourcen zu decken. Darüber hinaus erfreut sich die Einführung eines Managed-Services-Ansatzes für EDI aufgrund seiner erheblichen Vorteile bei Unternehmen großer Beliebtheit, wie beispielsweise:
- Cloudbasierte, verwaltete EDI-Outsourcing-Dienste unterstützen Unternehmen bei der Koordination mit Handelspartnern, um den Datenfluss zu validieren und End-to-End-EDI-Tests durchzuführen.
- Stellen Sie automatische interne Updates entsprechend den geänderten Anforderungen der Handelspartner bereit
- Unterstützen Sie die interne Überwachung und Optimierung von EDI-Transaktionen und Wartungsinitiativen
- 24/7-Support durch Handelspartner, Systeme, Vertriebskanäle und EDI-Service-Experten
- Bietet kontinuierliche Überwachung, um die Dateneingabe zu minimieren und Fehler zu vermeiden
Die Implementierung von EDI-Outsourcing ist attraktiver als Outsourcing in anderen Bereichen der IT-Branche. Ziel des EDI-Outsourcings ist es, die Infrastrukturkosten zu senken, einen präzisen und zeitnahen Datenaustausch zu gewährleisten, eine schnelle Anpassung an veränderte Anforderungen der Handelspartner zu ermöglichen und den Zugang zu den erforderlichen Kompetenzen für die Erbringung von Dienstleistungen für den Kunden sicherzustellen. EDI-Outsourcing bietet verschiedene Vorteile, darunter den Zugriff auf neueste Technologien, die Anbindung an externe Systeme und Mehrwertdienste für weltweiten Handel. EDI steigert die Geschäftsflexibilität, indem es Nutzern ermöglicht, schnell neue Märkte zu erschließen und die Produktivität durch die Bereitstellung erweiterter Informationen zu Leistung, Lieferkette und Geschäftspartnern zu steigern. Daher wird erwartet, dass die steigende Nachfrage nach EDI-Outsourcing-Dienstleistungen im Prognosezeitraum Wachstumschancen für den Markt für elektronischen Datenaustausch bietet.
Segmentierungsanalyse des Marktberichts zum elektronischen Datenaustausch
Die wichtigsten Segmente, die zur Ableitung der Marktanalyse für den elektronischen Datenaustausch beigetragen haben, sind Komponente, Typ und Branche.
- Basierend auf den Komponenten ist der Markt in Lösungen und Dienstleistungen unterteilt. Das Lösungssegment dominierte den Markt im Jahr 2024.
- Der Markt wird nach Typ in direktes EDI, EDI über AS2, EDI über VAN, Mobile EDI, Web EDI, EDI-Outsourcing und andere unterteilt. Das Segment EDI über VAN dominierte den Markt im Jahr 2024.
- Der Markt für elektronischen Datenaustausch wird branchenbezogen in die Bereiche BFSI, Gesundheitswesen, Einzelhandel und Konsumgüter, IT und Telekommunikation, Transport und Logistik, Automobilindustrie, Lebensmittel und Getränke und andere unterteilt. Das Segment Einzelhandel und Konsumgüter dominierte den Markt im Jahr 2024.
Marktanteilsanalyse für den elektronischen Datenaustausch nach geografischen Gesichtspunkten
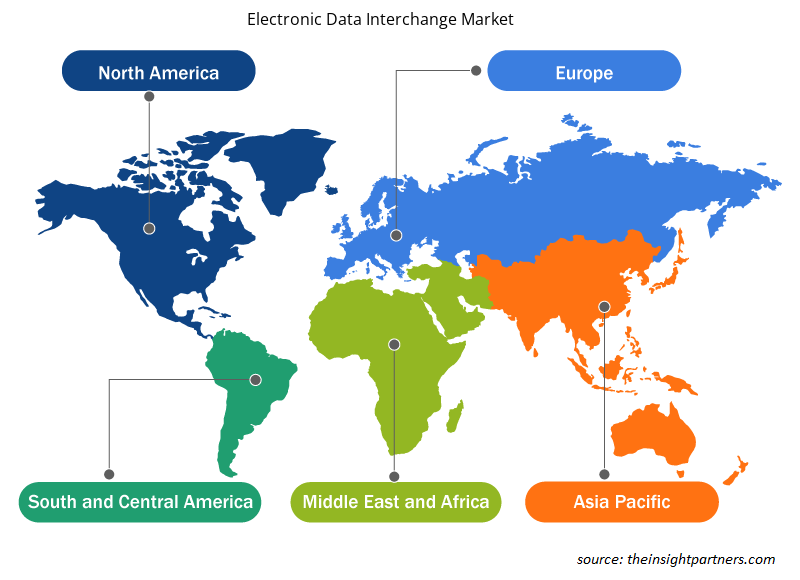
Der Markt für elektronischen Datenaustausch ist in fünf Hauptregionen unterteilt: Nordamerika, Europa, Asien-Pazifik, Naher Osten und Afrika (MEA) sowie Südamerika. Nordamerika dominierte den Markt im Jahr 2024.
Nordamerika beherbergt mehrere Technologieriesen, die erheblich in die Entwicklung robuster Technologien investieren. Angesichts des kontinuierlichen Anstiegs der Datentransaktionen im B2C- und B2B-Bereich wird für viele Unternehmen und ihre Partner in Zukunft ein Geschäftswachstum erwartet. Viele Unternehmen interessieren sich für EDI-Lösungen, um ihre Daten präzise, effizient und sicher auszutauschen. In den USA bieten mehrere Dienstleister automatisierte EDI-Lösungen an. Die Einführung von EDI-Lösungen hat zu Effizienzsteigerungen und Kosteneinsparungen in verschiedenen US-Regierungsorganisationen geführt. Darüber hinaus nimmt die EDI-Implementierung in der Region dank neuer Technologien und Investitionen von Unternehmen in Cloud-Systeme stetig zu.
Regionale Einblicke in den Markt für elektronischen Datenaustausch
Die Analysten von Insight Partners haben die regionalen Trends und Faktoren, die den Markt für elektronischen Datenaustausch im Prognosezeitraum beeinflussen, ausführlich erläutert. In diesem Abschnitt werden auch die Marktsegmente und die geografische Lage des elektronischen Datenaustauschs in Nordamerika, Europa, Asien-Pazifik, dem Nahen Osten und Afrika sowie Süd- und Mittelamerika erörtert.
- Erhalten Sie regionale Daten zum Markt für elektronischen Datenaustausch
Umfang des Marktberichts zum elektronischen Datenaustausch
| Berichtsattribut | Details |
|---|---|
| Marktgröße im Jahr 2024 | 34,02 Milliarden US-Dollar |
| Marktgröße bis 2031 | 74,36 Milliarden US-Dollar |
| Globale CAGR (2025 – 2031) | 11,9 % |
| Historische Daten | 2021-2023 |
| Prognosezeitraum | 2025–2031 |
| Abgedeckte Segmente |
Nach Komponente
|
| Abgedeckte Regionen und Länder |
Nordamerika
|
| Marktführer und wichtige Unternehmensprofile |
|
Marktteilnehmerdichte im elektronischen Datenaustausch: Auswirkungen auf die Geschäftsdynamik
Der Markt für elektronischen Datenaustausch wächst rasant. Dies wird durch die steigende Endverbrauchernachfrage aufgrund veränderter Verbraucherpräferenzen, technologischer Fortschritte und eines stärkeren Bewusstseins für die Produktvorteile vorangetrieben. Mit der steigenden Nachfrage erweitern Unternehmen ihr Angebot, entwickeln Innovationen, um den Verbraucherbedürfnissen gerecht zu werden, und nutzen neue Trends, was das Marktwachstum weiter ankurbelt.
Die Marktteilnehmerdichte beschreibt die Verteilung der in einem bestimmten Markt oder einer bestimmten Branche tätigen Unternehmen. Sie gibt an, wie viele Wettbewerber (Marktteilnehmer) in einem bestimmten Marktraum im Verhältnis zu dessen Größe oder Gesamtmarktwert präsent sind.
Die wichtigsten Unternehmen auf dem Markt für elektronischen Datenaustausch sind:
- Salesforce, Inc. (MuleSoft)
- SPS Commerce, Inc.
- TrueCommerce Inc.
- IBM Corporation
- Cleo
- Generix-Gruppe
Haftungsausschluss : Die oben aufgeführten Unternehmen sind nicht in einer bestimmten Reihenfolge aufgeführt.
- Überblick über die wichtigsten Akteure auf dem Markt für elektronischen Datenaustausch
Neuigkeiten und aktuelle Entwicklungen zum Markt für elektronischen Datenaustausch
Der Markt für elektronischen Datenaustausch wird durch die Erhebung qualitativer und quantitativer Daten aus Primär- und Sekundärforschung bewertet, die wichtige Unternehmenspublikationen, Verbandsdaten und Datenbanken umfasst. Nachfolgend sind einige der Entwicklungen im Markt für elektronischen Datenaustausch aufgeführt:
- Cleo gab eine Partnerschaft mit Programmers.io bekannt, einem führenden Anbieter von KI- und Technologielösungen für Unternehmen aus den Bereichen Fertigung, Transport, Versicherung und Einzelhandel. Diese strategische Partnerschaft kombiniert die Leistungsfähigkeit der Cleo Integration Cloud (CIC) mit der umfassenden technischen Expertise von Programmers.io. Gemeinsam werden die Unternehmen maßgeschneiderte EDI- und API-Integrationen anbieten, die sich nahtlos an die wachsenden Kundenanforderungen anpassen.
(Quelle: Liberty Mutual Insurance, Pressemitteilung, März 2025)
- AWS B2B Data Interchange ermöglicht die Generierung von EDI-Mapping-Code (Electronic Data Interchange) mithilfe generativer KI. Diese neue Funktion beschleunigt das Schreiben und Testen bidirektionaler EDI-Mappings und reduziert so den Zeit-, Arbeits- und Kostenaufwand für die Migration von EDI-Workloads zu AWS. AWS B2B Data Interchange ist ein vollständig verwalteter Service, der die Transformation geschäftskritischer EDI-Transaktionen in großem Maßstab automatisiert, flexibel und mit nutzungsbasierter Preisgestaltung.
(Quelle: Liberty Mutual Surety, Pressemitteilung, November 2024)
Marktbericht zum elektronischen Datenaustausch – Umfang und Ergebnisse
Die Studie „Marktgröße und Prognose für den elektronischen Datenaustausch (2021–2031)“ bietet eine detaillierte Analyse des Marktes, die die unten genannten Bereiche abdeckt:
- Marktgröße und Prognose für den elektronischen Datenaustausch auf globaler, regionaler und Länderebene für alle wichtigen Marktsegmente, die im Rahmen des Berichts abgedeckt sind
- Markttrends im Bereich des elektronischen Datenaustauschs sowie Marktdynamiken wie Treiber, Einschränkungen und wichtige Chancen
- Detaillierte PEST- und SWOT-Analyse
- Marktanalyse für den elektronischen Datenaustausch mit wichtigen Markttrends, globalen und regionalen Rahmenbedingungen, wichtigen Akteuren, Vorschriften und aktuellen Marktentwicklungen
- Branchenlandschafts- und Wettbewerbsanalyse mit Marktkonzentration, Heatmap-Analyse, prominenten Akteuren und aktuellen Entwicklungen auf dem Markt für elektronischen Datenaustausch
- Detaillierte Firmenprofile

Ankita ist eine dynamische Marktforschungs- und Beratungsexpertin mit über 8 Jahren Erfahrung in den Bereichen Technologie, Medien, IKT sowie Elektronik und Halbleiter. Sie hat über 100 Beratungs- und Forschungsaufträge für globale Kunden wie Microsoft, Oracle, NEC Corporation, SAP, KPMG und Expeditors International erfolgreich geleitet und durchgeführt. Zu ihren Kernkompetenzen gehören Marktbewertung, Datenanalyse, Prognose, Strategieformulierung, Wettbewerbsbeobachtung und das Verfassen von Berichten. Ankita ist versiert in der Abwicklung kompletter Projektzyklen – von der Angebotserstellung vor dem Verkauf und Kundengesprächen bis hin zur Bereitstellung umsetzbarer Erkenntnisse nach dem Verkauf. Sie ist versiert in der Leitung funktionsübergreifender Teams, der Strukturierung komplexer Forschungsmodule und der Ausrichtung von Lösungen an kundenspezifischen Geschäftszielen. Ihre ausgezeichneten Kommunikationsfähigkeiten, Führungsqualitäten und Präsentationsfähigkeiten haben es ihr ermöglicht, in einem schnelllebigen und sich entwickelnden Marktumfeld stets wertorientierte Ergebnisse zu liefern.
- Historische Analyse (2 Jahre), Basisjahr, Prognose (7 Jahre) mit CAGR
- PEST- und SWOT-Analyse
- Marktgröße Wert/Volumen – Global, Regional, Land
- Branchen- und Wettbewerbslandschaft
- Excel-Datensatz
Erfahrungsberichte
Der SCADA-Systemmarktbericht von Insight Partners ist umfassend und bietet wertvolle Einblicke in aktuelle Trends und Zukunftsprognosen. Das Team war durchweg hochprofessionell, reaktionsschnell und hilfsbereit. Wir sind sehr zufrieden und können die Dienstleistungen wärmstens empfehlen.
RAN KEDEM Partner, Reali Technologies LTDsIch habe einen Bericht über einen sehr spezifischen Softwaremarkt angefordert, und das Team hat ihn innerhalb weniger Tage erstellt. Die Informationen waren sehr relevant und gut präsentiert. Anschließend habe ich einige Änderungen und Ergänzungen zum Bericht angefordert. Das Team reagierte erneut sehr schnell, und ich erhielt den Abschlussbericht in weniger als einer Woche.
JEAN-HERVE JENN Vorsitzende, Future AnalyticaWir haben mit The Insight Partners für eine wichtige Marktstudie und Prognose zusammengearbeitet. Sie gaben uns klare Einblicke in Chancen und Risiken, die uns bei der Gestaltung unserer Pläne halfen. Ihre Recherchen waren benutzerfreundlich und basierten auf soliden Daten. Sie halfen uns, kluge und sichere Entscheidungen zu treffen. Wir können sie wärmstens empfehlen.
PIYUSH NAGPAL Sr. Vizepräsident, Fernlicht GlobalDie Insight Partners lieferten aufschlussreiche, gut strukturierte Marktforschung mit fundierter Fachkompetenz. Ihr Team war durchweg professionell und reaktionsschnell. Die benutzerfreundliche Website ermöglichte den Zugriff auf Branchenberichte. Wir empfehlen sie wärmstens für zuverlässige und hochwertige Forschungsdienstleistungen.
YUKIHIKO ADACHI Geschäftsführer, Deep Blue, LLC.Dies ist das erste Mal, dass ich einen Marktbericht von The Insight Partners erworben habe. Obwohl ich zunächst unsicher war, besuchte ich die Website und fühlte mich dann sicherer, das Risiko einzugehen und einen Marktbericht zu kaufen. Ich bin mit der Qualität des Berichts und dem Kundenservice rundum zufrieden. Ich hatte einige Fragen und Anmerkungen zum ersten Bericht, aber nach einigen E-Mail-Gesprächen mit dem Analysten bin ich überzeugt, dass ich einen Bericht habe, den ich als Input für unseren strategischen Planungsprozess verwenden kann. Vielen Dank, dass Sie sich die Zeit genommen und dies zu einer positiven Erfahrung gemacht haben. Ich werde Ihren Service auf jeden Fall weiterempfehlen und Sie werden meine erste Anlaufstelle sein, wenn wir weitere Marktdaten benötigen.
JOHN SUZUKI Präsident und Chief Executive Officer, Vorstandsmitglied, BK TechnologiesIch möchte mich für Ihre Unterstützung und die Professionalität bedanken, die Sie bei der Bearbeitung meiner Informationsanfrage zum IVD-Markt für Infektionskrankheiten in Nigeria gezeigt haben. Ich schätze Ihre Geduld, Ihre Beratung und die Tatsache, dass Sie bereit waren, einen Rabatt anzubieten, der uns schließlich den Abschluss eines Geschäfts ermöglichte. Ich freue mich darauf, The Insight Partners in Zukunft wieder zu beauftragen, dank des Eindrucks, den Sie bei dieser ersten Begegnung bei mir hinterlassen haben.
DR. CHIJIOKE ONYIA GESCHÄFTSFÜHRERIN, PineCrest Healthcare Ltd.Grund zum Kauf
- Fundierte Entscheidungsfindung
- Marktdynamik verstehen
- Wettbewerbsanalyse
- Kundeneinblicke
- Marktprognosen
- Risikominimierung
- Strategische Planung
- Investitionsbegründung
- Identifizierung neuer Märkte
- Verbesserung von Marketingstrategien
- Steigerung der Betriebseffizienz
- Anpassung an regulatorische Trends


Exklusive Berichtsrabatte freischalten
Jetzt anfragen


 Kostenlose Probe anfordern für - Markt für elektronischen Datenaustausch