Markt für Engineering-Software – Erkenntnisse durch globale und regionale Analyse – Prognose bis 2031
Historische Daten : 2021-2022 | Basisjahr : 2023 | Prognosezeitraum : 2024-2031Marktgröße und Prognose für Engineering-Software (2021–2031), Bericht über globale und regionale Anteile, Trends und Wachstumschancenanalyse: Nach Softwaretyp (CAD, CAM, CAE, AEC, EDA) und Anwendung (Anlagenplanung, Konstruktionsautomatisierung, Entwurf und 3D-Modellierung, Produktdesign und -prüfung usw.) und Geografie
- Status : Veröffentlichte Daten
- Berichtscode : TIPTE100000135
- Kategorie : Technologie, Medien und Telekommunikation
- Anzahl der Seiten : 150
- Verfügbare Berichtsformate :


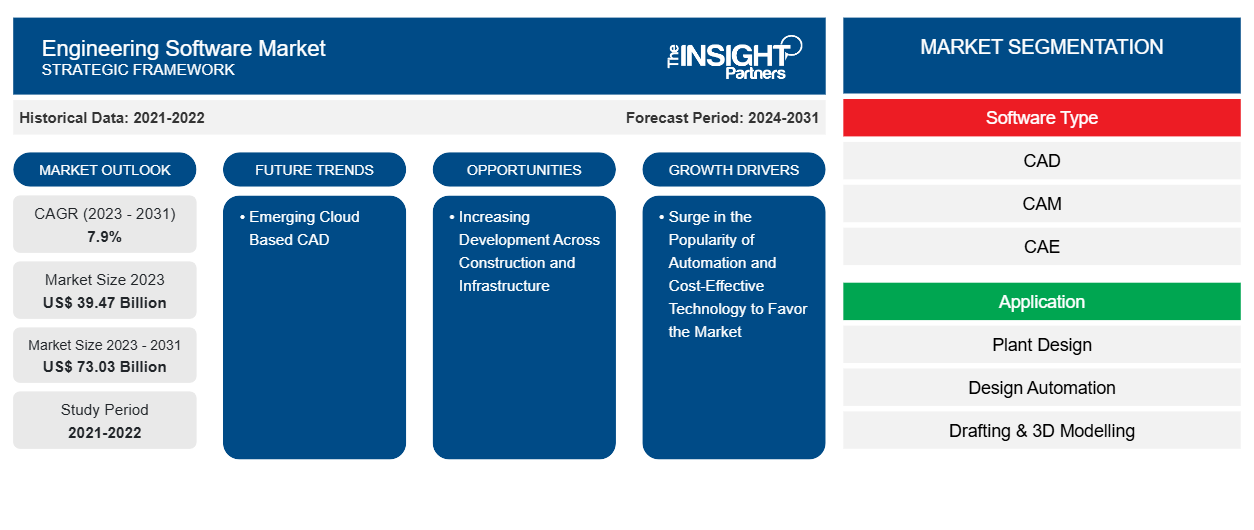
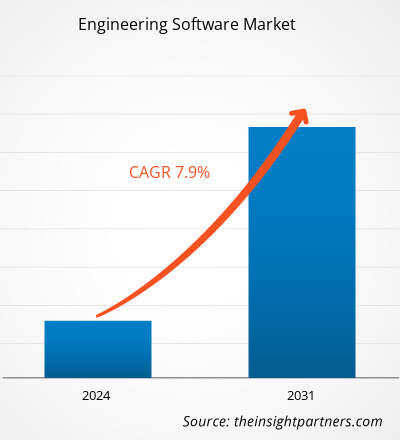
Der Markt für Engineering-Software soll von 39,47 Milliarden US-Dollar im Jahr 2023 auf 73,03 Milliarden US-Dollar im Jahr 2031 anwachsen. Der Markt soll zwischen 2023 und 2031 eine durchschnittliche jährliche Wachstumsrate (CAGR) von 7,9 % verzeichnen. Die steigende Beliebtheit von Automatisierung und kosteneffizienter Technologie dürfte weiterhin ein wichtiger Trend auf dem Markt für Engineering-Software bleiben.CAGR of 7.9% in 2023—2031. The surge in popularity of automation and cost-effective technology is likely to remain key engineering software market trends.
Marktanalyse für Engineering-Software
Der zunehmende Einsatz von CAD- und CAE-Software in einer Reihe von Branchen, darunter der Automobil-, Luft- und Raumfahrt-, Bau- und Gesundheitssektor, ist für die Marktexpansion verantwortlich. Software für das Engineering umfasst unter anderem Computer-Aided Design (CAD), Computer-Aided Manufacturing (CAM) und Computer-Aided Engineering (CAE). Der Markt für Engineering-Software wird im Prognosezeitraum voraussichtlich aus verschiedenen Gründen erheblich wachsen, darunter die steigende Nachfrage der Unternehmen nach kürzeren Zeit- und Kostenzeiten bei der Produktentwicklung.
Marktübersicht für Engineering-Software
Ingenieure, Designer und Hersteller können mithilfe von Engineering-Softwarelösungen wichtige technische Dokumentationen schreiben, Produktleistung und -betrieb analysieren und simulieren und komplexe Modelle entwickeln. Mit Cloud-basierten Lösungen können Teammitglieder remote zusammenarbeiten und dabei jedes beliebige Gerät verwenden, da der Zugriff über einen Webbrowser möglich ist. Dadurch können Unternehmen ihre Hardware modernisieren und ihre Ausgaben senken, ohne dabei Rechenleistung oder Nutzbarkeit einzubüßen.
Passen Sie diesen Bericht Ihren Anforderungen an
Sie erhalten kostenlose Anpassungen an jedem Bericht, einschließlich Teilen dieses Berichts oder einer Analyse auf Länderebene, eines Excel-Datenpakets sowie tolle Angebote und Rabatte für Start-ups und Universitäten.
Markt für Engineering-Software: Strategische Einblicke
-
Holen Sie sich die wichtigsten Markttrends aus diesem Bericht.Dieses KOSTENLOSE Beispiel umfasst eine Datenanalyse von Markttrends bis hin zu Schätzungen und Prognosen.
Treiber und Chancen auf dem Engineering-Softwaremarkt
Der Markt profitiert von der zunehmenden Beliebtheit von Automatisierung und kosteneffizienter Technologie.
Aufgrund der zunehmenden Konkurrenz auf dem Markt stehen die Anlagenbauer und EPCs weltweit unter Druck, Produktionsfehler und Betriebskosten zu reduzieren. Anlageningenieure können die Qualität verbessern, indem sie während der Konstruktions-, Produktions- und Inbetriebnahmeprozesse bestimmte internationale Standards einhalten. Produktions- und Intensitätsprobleme können mit Konstruktionssoftware , kontinuierlicher Analyse und Standardaktualisierungen gelöst werden. Aus diesem Grund verwenden Unternehmen auf der ganzen Welt immer mehr Engineering-Software, um Fehler bei Konstruktion und Produktion zu reduzieren.
Zunehmende Entwicklung im Bau- und Infrastrukturbereich
Einer der Hauptfaktoren, die zur sozioökonomischen Entwicklung eines Landes beitragen, ist vermutlich das Baugewerbe. Die Bauwirtschaft wächst in Entwicklungsländern auf der ganzen Welt rasant, darunter in Äthiopien, Indien, China, Brasilien, Usbekistan, Kambodscha, Tansania und Myanmar. Auch die grundlegende Infrastruktur dieser Volkswirtschaften entwickelt sich rasant. So ziehen beispielsweise die Entwicklungsländer im asiatisch-pazifischen Raum und in SAM viele ausländische Direktinvestitionen in ihre Infrastrukturentwicklung an. Diese Fortschritte werden auch das Wachstum ihrer Infrastruktur ankurbeln, und mit der Expansion der Bauwirtschaft steigt auch der Bedarf an technischer Software. Daher wird erwartet, dass die zunehmenden Fortschritte in den Bereichen Infrastruktur und Bauwesen zu weiteren Verbesserungen führen werden.
Segmentierungsanalyse des Marktberichts für Engineering-Software
Wichtige Segmente, die zur Ableitung der Marktanalyse für technische Software beigetragen haben, sind Softwaretyp und Anwendung.
- Basierend auf dem Softwaretyp ist der Markt für Engineering-Software in CAD, CAM, CAE, AEC und EDA unterteilt. Das CAD-Segment dürfte im Prognosezeitraum wachsen.CAE, AEC, and EDA. The CAD segment is anticipated to grow in the forecast period.
- Nach Anwendung ist der Markt segmentiert in Anlagendesign, Designautomatisierung , technisches Zeichnen und 3D-Modellierung, Produktdesign und -prüfung und andere. Das Segment Designautomatisierung dürfte im Prognosezeitraum wachsen.
Marktanteilsanalyse für Engineering-Software nach geografischer Lage
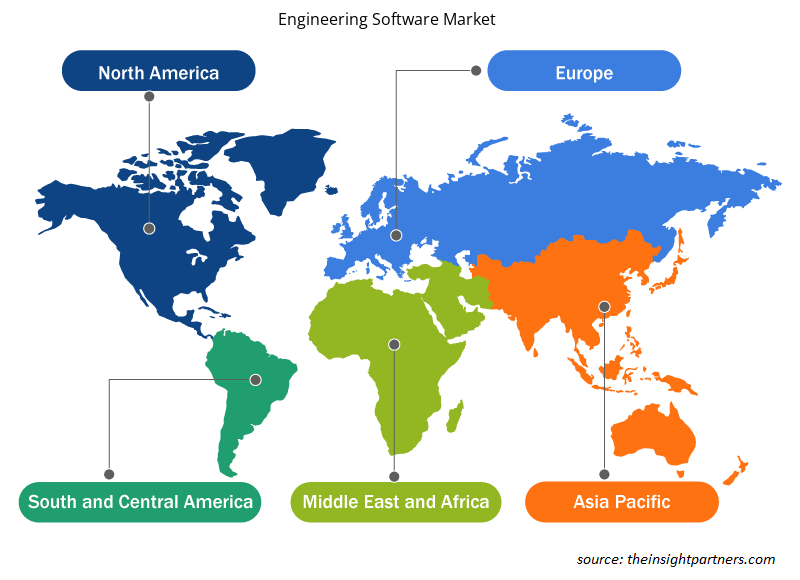
Der geografische Umfang des Berichts zum Markt für Engineering-Software ist hauptsächlich in fünf Regionen unterteilt: Nordamerika, Asien-Pazifik, Europa, Naher Osten und Afrika sowie Südamerika/Süd- und Mittelamerika. Nordamerika hat den Markt für Engineering-Software dominiert. Hochtechnologische Trends in verschiedenen Branchen in der nordamerikanischen Region haben das Wachstum des Marktes für Engineering-Software vorangetrieben. Faktoren wie die zunehmende Einführung digitaler Tools und hohe Technologieausgaben von Regierungsbehörden werden voraussichtlich das Wachstum des nordamerikanischen Marktes für Engineering-Software vorantreiben. Darüber hinaus zwingt eine starke Betonung von Forschung und Entwicklung in den entwickelten Volkswirtschaften der USA und Kanadas die nordamerikanischen Akteure dazu, technologisch fortschrittliche Lösungen auf den Markt zu bringen. Darüber hinaus gibt es in den USA eine große Anzahl von Akteuren auf dem Markt für Engineering-Software, die sich zunehmend auf die Entwicklung innovativer Lösungen konzentrieren. All diese Faktoren tragen zum Wachstum des Marktes für Engineering-Software in der Region bei.
Regionale Einblicke in den Markt für Engineering-Software
Die regionalen Trends und Faktoren, die den Markt für Engineering-Software im Prognosezeitraum beeinflussen, wurden von den Analysten von Insight Partners ausführlich erläutert. In diesem Abschnitt werden auch die Marktsegmente und die Geografie von Engineering-Software in Nordamerika, Europa, im asiatisch-pazifischen Raum, im Nahen Osten und Afrika sowie in Süd- und Mittelamerika erörtert.
- Erhalten Sie regionale Daten zum Engineering-Softwaremarkt
Umfang des Marktberichts für Engineering-Software
| Berichtsattribut | Details |
|---|---|
| Marktgröße im Jahr 2023 | 39,47 Milliarden US-Dollar |
| Marktgröße bis 2031 | 73,03 Milliarden US-Dollar |
| Globale CAGR (2023 - 2031) | 7,9 % |
| Historische Daten | 2021-2022 |
| Prognosezeitraum | 2024–2031 |
| Abgedeckte Segmente |
Nach Softwaretyp
|
| Abgedeckte Regionen und Länder |
Nordamerika
|
| Marktführer und wichtige Unternehmensprofile |
|
Dichte der Marktteilnehmer für Engineering-Software: Die Auswirkungen auf die Geschäftsdynamik verstehen
Der Markt für Engineering-Software wächst rasant. Dies wird durch die steigende Nachfrage der Endnutzer aufgrund von Faktoren wie sich entwickelnden Verbraucherpräferenzen, technologischen Fortschritten und einem größeren Bewusstsein für die Vorteile des Produkts vorangetrieben. Mit der steigenden Nachfrage erweitern Unternehmen ihr Angebot, entwickeln Innovationen, um die Bedürfnisse der Verbraucher zu erfüllen, und nutzen neue Trends, was das Marktwachstum weiter ankurbelt.
Die Marktteilnehmerdichte bezieht sich auf die Verteilung von Firmen oder Unternehmen, die in einem bestimmten Markt oder einer bestimmten Branche tätig sind. Sie gibt an, wie viele Wettbewerber (Marktteilnehmer) in einem bestimmten Marktraum im Verhältnis zu seiner Größe oder seinem gesamten Marktwert präsent sind.
Die wichtigsten auf dem Markt für technische Software tätigen Unternehmen sind:
- PTC
- Rockwell Automation, Inc
- SAP SE
- Siemens
- Synopsys, Inc.
- Autodesk Inc.
Haftungsausschluss : Die oben aufgeführten Unternehmen sind nicht in einer bestimmten Reihenfolge aufgeführt.
- Überblick über die wichtigsten Akteure auf dem Engineering-Softwaremarkt
Neuigkeiten und aktuelle Entwicklungen zum Engineering-Softwaremarkt
Der Markt für Engineering-Software wird durch die Erhebung qualitativer und quantitativer Daten nach Primär- und Sekundärforschung bewertet, die wichtige Unternehmensveröffentlichungen, Verbandsdaten und Datenbanken umfasst. Im Folgenden finden Sie eine Liste der Entwicklungen auf dem Markt:
- Im Februar 2024 will das globale Technologieunternehmen Cognizant die Modernisierung seines Geschäfts durch die Erweiterung seines Plattformangebots beschleunigen. Das Unternehmen kündigte die Einführung von Cognizant Flowsource an, einer generativen KI-gestützten Plattform, die die neue Ära der Softwareentwicklung vorantreiben soll.
(Quelle: Cognizant, Pressemitteilung, 2024)
- Im Juni 2023 wurde Nullspace, Inc. als Spin-off von IERUS Technologies, einem etablierten Verteidigungsunternehmen in Huntsville, Alabama, gegründet. Nullspace, Inc. konzentriert sich auf die Bereitstellung fortschrittlicher Engineering-Software für elektromagnetische Anwendungen.
(Quelle: Nullspace, Pressemitteilung, 2023)
Marktbericht zu Engineering-Software – Umfang und Ergebnisse
Der Bericht „Marktgröße und Prognose für Engineering-Software (2021–2031)“ bietet eine detaillierte Analyse des Marktes, die die folgenden Bereiche abdeckt:
- Marktgröße und Prognose auf globaler, regionaler und Länderebene für alle wichtigen Marktsegmente, die im Rahmen des Projekts abgedeckt sind
- Marktdynamik wie Treiber, Beschränkungen und wichtige Chancen
- Wichtige Zukunftstrends
- Detaillierte PEST/Porters Five Forces- und SWOT-Analyse
- Globale und regionale Marktanalyse mit wichtigen Markttrends, wichtigen Akteuren, Vorschriften und aktuellen Marktentwicklungen
- Branchenlandschaft und Wettbewerbsanalyse, einschließlich Marktkonzentration, Heatmap-Analyse, prominenten Akteuren und aktuellen Entwicklungen
- Detaillierte Firmenprofile

Ankita ist eine dynamische Marktforschungs- und Beratungsexpertin mit über 8 Jahren Erfahrung in den Bereichen Technologie, Medien, IKT sowie Elektronik und Halbleiter. Sie hat über 100 Beratungs- und Forschungsaufträge für globale Kunden wie Microsoft, Oracle, NEC Corporation, SAP, KPMG und Expeditors International erfolgreich geleitet und durchgeführt. Zu ihren Kernkompetenzen gehören Marktbewertung, Datenanalyse, Prognose, Strategieformulierung, Wettbewerbsbeobachtung und das Verfassen von Berichten. Ankita ist versiert in der Abwicklung kompletter Projektzyklen – von der Angebotserstellung vor dem Verkauf und Kundengesprächen bis hin zur Bereitstellung umsetzbarer Erkenntnisse nach dem Verkauf. Sie ist versiert in der Leitung funktionsübergreifender Teams, der Strukturierung komplexer Forschungsmodule und der Ausrichtung von Lösungen an kundenspezifischen Geschäftszielen. Ihre ausgezeichneten Kommunikationsfähigkeiten, Führungsqualitäten und Präsentationsfähigkeiten haben es ihr ermöglicht, in einem schnelllebigen und sich entwickelnden Marktumfeld stets wertorientierte Ergebnisse zu liefern.
- Historische Analyse (2 Jahre), Basisjahr, Prognose (7 Jahre) mit CAGR
- PEST- und SWOT-Analyse
- Marktgröße Wert/Volumen – Global, Regional, Land
- Branchen- und Wettbewerbslandschaft
- Excel-Datensatz
Erfahrungsberichte
Der SCADA-Systemmarktbericht von Insight Partners ist umfassend und bietet wertvolle Einblicke in aktuelle Trends und Zukunftsprognosen. Das Team war durchweg hochprofessionell, reaktionsschnell und hilfsbereit. Wir sind sehr zufrieden und können die Dienstleistungen wärmstens empfehlen.
RAN KEDEM Partner, Reali Technologies LTDsIch habe einen Bericht über einen sehr spezifischen Softwaremarkt angefordert, und das Team hat ihn innerhalb weniger Tage erstellt. Die Informationen waren sehr relevant und gut präsentiert. Anschließend habe ich einige Änderungen und Ergänzungen zum Bericht angefordert. Das Team reagierte erneut sehr schnell, und ich erhielt den Abschlussbericht in weniger als einer Woche.
JEAN-HERVE JENN Vorsitzende, Future AnalyticaWir haben mit The Insight Partners für eine wichtige Marktstudie und Prognose zusammengearbeitet. Sie gaben uns klare Einblicke in Chancen und Risiken, die uns bei der Gestaltung unserer Pläne halfen. Ihre Recherchen waren benutzerfreundlich und basierten auf soliden Daten. Sie halfen uns, kluge und sichere Entscheidungen zu treffen. Wir können sie wärmstens empfehlen.
PIYUSH NAGPAL Sr. Vizepräsident, Fernlicht GlobalDie Insight Partners lieferten aufschlussreiche, gut strukturierte Marktforschung mit fundierter Fachkompetenz. Ihr Team war durchweg professionell und reaktionsschnell. Die benutzerfreundliche Website ermöglichte den Zugriff auf Branchenberichte. Wir empfehlen sie wärmstens für zuverlässige und hochwertige Forschungsdienstleistungen.
YUKIHIKO ADACHI Geschäftsführer, Deep Blue, LLC.Dies ist das erste Mal, dass ich einen Marktbericht von The Insight Partners erworben habe. Obwohl ich zunächst unsicher war, besuchte ich die Website und fühlte mich dann sicherer, das Risiko einzugehen und einen Marktbericht zu kaufen. Ich bin mit der Qualität des Berichts und dem Kundenservice rundum zufrieden. Ich hatte einige Fragen und Anmerkungen zum ersten Bericht, aber nach einigen E-Mail-Gesprächen mit dem Analysten bin ich überzeugt, dass ich einen Bericht habe, den ich als Input für unseren strategischen Planungsprozess verwenden kann. Vielen Dank, dass Sie sich die Zeit genommen und dies zu einer positiven Erfahrung gemacht haben. Ich werde Ihren Service auf jeden Fall weiterempfehlen und Sie werden meine erste Anlaufstelle sein, wenn wir weitere Marktdaten benötigen.
JOHN SUZUKI Präsident und Chief Executive Officer, Vorstandsmitglied, BK TechnologiesIch möchte mich für Ihre Unterstützung und die Professionalität bedanken, die Sie bei der Bearbeitung meiner Informationsanfrage zum IVD-Markt für Infektionskrankheiten in Nigeria gezeigt haben. Ich schätze Ihre Geduld, Ihre Beratung und die Tatsache, dass Sie bereit waren, einen Rabatt anzubieten, der uns schließlich den Abschluss eines Geschäfts ermöglichte. Ich freue mich darauf, The Insight Partners in Zukunft wieder zu beauftragen, dank des Eindrucks, den Sie bei dieser ersten Begegnung bei mir hinterlassen haben.
DR. CHIJIOKE ONYIA GESCHÄFTSFÜHRERIN, PineCrest Healthcare Ltd.Grund zum Kauf
- Fundierte Entscheidungsfindung
- Marktdynamik verstehen
- Wettbewerbsanalyse
- Kundeneinblicke
- Marktprognosen
- Risikominimierung
- Strategische Planung
- Investitionsbegründung
- Identifizierung neuer Märkte
- Verbesserung von Marketingstrategien
- Steigerung der Betriebseffizienz
- Anpassung an regulatorische Trends


Exklusive Berichtsrabatte freischalten
Jetzt anfragen


 Kostenlose Probe anfordern für - Markt für Engineering-Software